Research
Minnesota’s 35% can’t cover basics. The average still spent $26,000 on them.
The report counts households. The books count averages.
Rochester residents told KAAL they had dropped name-brand groceries, combined cars and winced at $100 fill-ups after an ALICE report found 35 percent of Minnesota households do not have the income to cover basic needs. The station’s grocery examples were homely on purpose: milk about a dollar more than a decade ago, beef almost twice as expensive as in 2016. Economist Mike Walden said wages were not keeping up. That is a distribution story — a household survival budget — and the official national accounts cannot rerun ALICE’s worksheet. What they can do is show how large the same categories already were, on average, before 2025 and 2026 piled on another year of prices.
The latest state consumption accounts run through 2024. They are per person, not per household, and they include children, retirees and high spenders in the same average. They also impute rent for people who own their homes. None of that is a household checkbook. It is still the cleanest official map of how much Minnesota already spends on the things ALICE calls basics.
Four tickets already cost $26,000 a head
In 2024, Minnesota spent $3,766 per person on food and beverages bought for home, $10,132 on housing and utilities, $10,567 on health-care services and $1,482 on gasoline and other energy goods. Add those four lines and the bill is $25,947 — 44.4 percent of the state’s $58,433 in total per-person consumption. Health care here is outpatient, hospital and nursing-home services, not insurance premiums. Food includes alcohol purchased for home use. Housing includes tenant rent, an imputed rent for owner-occupied dwellings, and utilities. Those caveats matter, and they do not make the total small.
The composition is lopsided in a way the grocery-aisle interviews understate. Housing and health care dwarf the supermarket. Food at home was only 6.4 percent of Minnesota spending in 2024; gasoline and other energy goods were 2.5 percent. The two medical-and-shelter lines were 17.3 and 18.1 percent. If a third of households cannot cover “basics,” the official average says the expensive basics are not the cereal box. They are the roof and the clinic.
Minnesota’s total per-person consumption in 2024, $58,433, was almost identical to the U.S. average of $58,499. The mix was not. Minnesotans spent less than the country on groceries ($3,766 versus $4,350) and a little less on housing ($10,132 versus $10,595). They spent more on health-care services ($10,567 versus $9,747) and more on gasoline and other energy goods ($1,482 versus $1,295). The $100 fill-up is visible in the fuel line. The name-brand freeze is visible in a grocery bill that is still rising but remains cheaper, per person, than the national average.
Minnesota’s grocery, housing, health and fuel bills per person

View exact chart values
| year | total_pce | food | housing | health | gasoline | basics | food_share | housing_share | health_share | gas_share | basics_share | income | real_income |
|---|---|---|---|---|---|---|---|---|---|---|---|---|---|
| 2010 | 36024 | 2513 | 6353 | 6384 | 1349 | 16599 | 7 | 17.6 | 17.7 | 3.7 | 46.1 | 42538 | 48225 |
| 2011 | 37337 | 2619 | 6349 | 6534 | 1670 | 17172 | 7 | 17 | 17.5 | 4.5 | 46 | 45134 | 50086 |
| 2012 | 38165 | 2715 | 6538 | 6657 | 1664 | 17574 | 7.1 | 17.1 | 17.4 | 4.4 | 46 | 47399 | 51554 |
| 2013 | 39023 | 2719 | 6764 | 6856 | 1616 | 17955 | 7 | 17.3 | 17.6 | 4.1 | 46 | 47413 | 50857 |
| 2014 | 40100 | 2707 | 6897 | 7104 | 1551 | 18259 | 6.8 | 17.2 | 17.7 | 3.9 | 45.5 | 49357 | 51761 |
| 2015 | 41010 | 2732 | 7058 | 7361 | 1183 | 18334 | 6.7 | 17.2 | 17.9 | 2.9 | 44.7 | 51353 | 54124 |
| 2016 | 42020 | 2803 | 7178 | 7728 | 1051 | 18760 | 6.7 | 17.1 | 18.4 | 2.5 | 44.6 | 51982 | 54535 |
| 2017 | 43519 | 2887 | 7398 | 7862 | 1161 | 19308 | 6.6 | 17 | 18.1 | 2.7 | 44.4 | 53826 | 55771 |
| 2018 | 45228 | 2978 | 7644 | 8257 | 1290 | 20169 | 6.6 | 16.9 | 18.3 | 2.9 | 44.6 | 56201 | 55408 |
| 2019 | 45930 | 3028 | 7927 | 8407 | 1230 | 20592 | 6.6 | 17.3 | 18.3 | 2.7 | 44.8 | 57903 | 56749 |
| 2020 | 43698 | 3281 | 7732 | 7758 | 923 | 19694 | 7.5 | 17.7 | 17.8 | 2.1 | 45.1 | 61372 | 60139 |
| 2021 | 48947 | 3467 | 8515 | 8686 | 1334 | 22002 | 7.1 | 17.4 | 17.7 | 2.7 | 45 | 67730 | 63244 |
| 2022 | 53437 | 3667 | 9434 | 9103 | 1740 | 23944 | 6.9 | 17.7 | 17 | 3.3 | 44.8 | 69467 | 61533 |
| 2023 | 55825 | 3699 | 9592 | 9822 | 1564 | 24677 | 6.6 | 17.2 | 17.6 | 2.8 | 44.2 | 72674 | 61394 |
| 2024 | 58433 | 3766 | 10132 | 10567 | 1482 | 25947 | 6.4 | 17.3 | 18.1 | 2.5 | 44.4 | 75548 | 62039 |
Four “basic” categories already take 44% of Minnesota spending

View exact chart values
| category | dollars | share |
|---|---|---|
| Food at home | 3766 | 6.4 |
| Housing and utilities | 10132 | 17.3 |
| Health care | 10567 | 18.1 |
| Gasoline and other energy goods | 1482 | 2.5 |
| All other spending | 32486 | 55.6 |
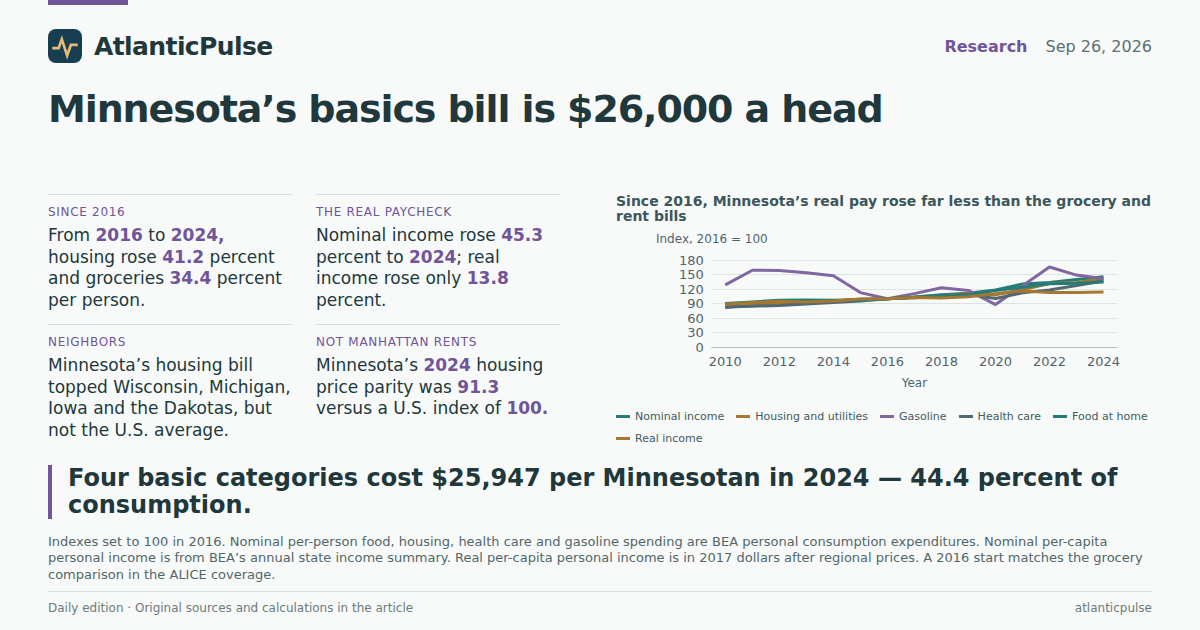
Since 2016, the paycheck looked bigger than it spent
KAAL’s beef comparison started in 2016. From that year through 2024, Minnesota’s per-person grocery bill rose 34.4 percent, housing and utilities 41.2 percent, health-care services 36.7 percent and gasoline and other energy goods 41.0 percent. Total consumption was up 39.1 percent. Nominal per-capita personal income, which includes wages, benefits, proprietors’ income and transfers, rose faster still: from $51,982 in 2016 to $75,548 in 2024, or 45.3 percent, and to $78,538 in 2025, according to BEA’s annual state income summary. On paper, the average Minnesotan’s income outran the grocery and rent lines.
Strip out prices and the story changes. Real per-capita personal income, in 2017 dollars after regional prices, rose only 13.8 percent from 2016 to 2024 — from $54,535 to $62,039. The U.S. average rose 18.8 percent over the same stretch. Minnesota still sits above the country. It no longer pulls away. Real income peaked in 2021, sagged in 2022 and 2023, and in 2024 remained below that peak. Walden’s remark that raises are not covering the cost of living is the version of this chart you can feel at the pump. The nominal raise showed up. The purchasing power mostly did not.
That is also why an average cannot argue with ALICE. If a third of households are short of a basic-needs budget, they are not living at the per-person mean. They are living in the left tail, where a 14 percent real raise over eight years is not a raise at all once rent, a second car and a clinic visit land in the same month. The accounts say the state’s typical consumption basket is not exotic. They do not say the bottom third can buy it.
Since 2016, Minnesota’s real pay rose far less than the grocery and rent bills

View exact chart values
| year | food_index | housing_index | health_index | gas_index | total_pce_index | income_index | real_income_index |
|---|---|---|---|---|---|---|---|
| 2010 | 89.7 | 88.5 | 82.6 | 128.4 | 85.7 | 81.8 | 88.4 |
| 2011 | 93.4 | 88.5 | 84.5 | 158.9 | 88.9 | 86.8 | 91.8 |
| 2012 | 96.9 | 91.1 | 86.1 | 158.3 | 90.8 | 91.2 | 94.5 |
| 2013 | 97 | 94.2 | 88.7 | 153.8 | 92.9 | 91.2 | 93.3 |
| 2014 | 96.6 | 96.1 | 91.9 | 147.6 | 95.4 | 95 | 94.9 |
| 2015 | 97.5 | 98.3 | 95.3 | 112.6 | 97.6 | 98.8 | 99.2 |
| 2016 | 100 | 100 | 100 | 100 | 100 | 100 | 100 |
| 2017 | 103 | 103.1 | 101.7 | 110.5 | 103.6 | 103.5 | 102.3 |
| 2018 | 106.2 | 106.5 | 106.8 | 122.7 | 107.6 | 108.1 | 101.6 |
| 2019 | 108 | 110.4 | 108.8 | 117 | 109.3 | 111.4 | 104.1 |
| 2020 | 117.1 | 107.7 | 100.4 | 87.8 | 104 | 118.1 | 110.3 |
| 2021 | 123.7 | 118.6 | 112.4 | 126.9 | 116.5 | 130.3 | 116 |
| 2022 | 130.8 | 131.4 | 117.8 | 165.6 | 127.2 | 133.6 | 112.8 |
| 2023 | 132 | 133.6 | 127.1 | 148.8 | 132.9 | 139.8 | 112.6 |
| 2024 | 134.4 | 141.2 | 136.7 | 141 | 139.1 | 145.3 | 113.8 |
Minnesota still out-earns the country. The gap stopped widening.

View exact chart values
| year | minnesota | united_states |
|---|---|---|
| 2008 | 49842 | 45816 |
| 2009 | 46732 | 44204 |
| 2010 | 48225 | 44808 |
| 2011 | 50086 | 45957 |
| 2012 | 51554 | 46796 |
| 2013 | 50857 | 46358 |
| 2014 | 51761 | 47661 |
| 2015 | 54124 | 49396 |
| 2016 | 54535 | 49828 |
| 2017 | 55771 | 51006 |
| 2018 | 55408 | 52242 |
| 2019 | 56749 | 53683 |
| 2020 | 60139 | 56514 |
| 2021 | 63244 | 59365 |
| 2022 | 61533 | 57104 |
| 2023 | 61394 | 58088 |
| 2024 | 62039 | 59195 |
The expensive neighbor is still cheaper than America
Among the states that share a border or a labor market with Minnesota, the 2024 housing-and-utilities bill is highest in Minnesota. South Dakota spent $8,013 per person, Iowa $8,245, North Dakota $8,494, Michigan $9,175 and Wisconsin $9,184. Minnesota’s $10,132 sits below the U.S. average of $10,595 and well above every neighbor in that group. Groceries do not follow the same ranking: Iowa’s food-at-home bill was $4,093 per person, Wisconsin’s $4,037, North Dakota’s $3,810 and South Dakota’s $3,641, against Minnesota’s $3,766. The supermarket is not where Minnesota stands out. The house is.
Prices help explain the gap without erasing it. Minnesota’s housing regional price parity in 2024 was 91.3, with the U.S. equal to 100, and its all-items parity was 98.6, according to BEA’s regional price parities. In plain English, tenant rents used to build the housing index were cheaper than the national average, and the overall consumption basket was a shade cheaper too. A high housing bill next to a below-average housing price level is a quantity-and-quality story as much as a sticker-price story: bigger units, more owner-occupied imputed rent, or both. It is not a finding that Minnesota rents like Manhattan.
Put the four basic lines against income and the average still has room — which is exactly what an average is for. In 2024 those lines were 34.3 percent of per-capita personal income; all consumption was 77.3 percent. In 2016 the same basics were 36.1 percent of income. The share did not explode. Real income simply stopped doing the work households thought a raise would do. The ALICE threshold is a household budget for working people who earn more than poverty and less than stability. The official books cannot count those households. They can say that even at the mean, Minnesota’s roof and clinic already cost more than the neighbors’, that groceries and fuel kept climbing after 2016, and that after inflation the paycheck that was supposed to cover them grew by 14 percent in eight years. That is enough to make a 35 percent figure sound less like a scold and more like arithmetic.
Minnesota’s housing bill is the highest among its neighbors

View exact chart values
| state | housing | food | total | housing_share | food_share | food_plus_housing | food_plus_housing_share |
|---|---|---|---|---|---|---|---|
| South Dakota | 8013 | 3641 | 54100 | 14.8 | 6.7 | 11654 | 21.5 |
| Iowa | 8245 | 4093 | 49473 | 16.7 | 8.3 | 12338 | 24.9 |
| North Dakota | 8494 | 3810 | 58090 | 14.6 | 6.6 | 12304 | 21.2 |
| Michigan | 9175 | — | 54197 | 16.9 | — | — | — |
| Wisconsin | 9184 | 4037 | 54705 | 16.8 | 7.4 | 13221 | 24.2 |
| Minnesota | 10132 | 3766 | 58433 | 17.3 | 6.4 | 13898 | 23.8 |
| United States | 10595 | 4350 | 58499 | 18.1 | 7.4 | 14945 | 25.5 |
Sources and methods
Spending figures are Bureau of Economic Analysis per-capita personal consumption expenditures by state (SAPCE table of major types of product), annual, current dollars, calendar years 2010–2024. The pinned snapshot is the SAPCE release identified as bea-sapce-2025-09-26. Food is “food and beverages purchased for off-premises consumption,” which includes alcohol bought for home use and farm food consumed on farms. Housing and utilities include tenant rent, an imputed rental value of owner-occupied dwellings, farm dwellings, group housing, water, electricity and gas. Health care is outpatient, hospital and nursing-home services; it is not health insurance premiums. Gasoline and other energy goods include motor fuels, lubricants and fuel oil. Per-person averages are not household budgets and are not ALICE thresholds; they include children and high-income residents in the same mean.
Nominal per-capita personal income is from BEA’s annual state personal income summary (SAINC1), calendar years 2010–2025, release identified as bea-regional-state-annual-2026-04-09. Personal income includes wages, supplements, proprietors’ income, dividends, interest, rent and current transfer receipts, minus contributions for government social insurance. It is not take-home pay. Real per-capita personal income is from BEA’s SARPI table, constant 2017 dollars after regional price parities, 2008–2024, release bea-rpp-2026-02-19. Housing and all-items regional price parities are indexes with the United States equal to 100; the housing parity is estimated from tenant-occupied housing. Provider snapshots were built in August 2026; observation years are not the edition date. Percent changes and shares were calculated from the extracted annual values. Missing values were not treated as zero. No causal claim is made about ALICE methodology, tariffs, or the Iran war.
Research completed 2026-09-27, for the September 26, 2026 news edition. The available source data may cover earlier periods; see the observation periods and source vintages above.