Research
Michigan’s cost-of-living Senate race, measured on the books
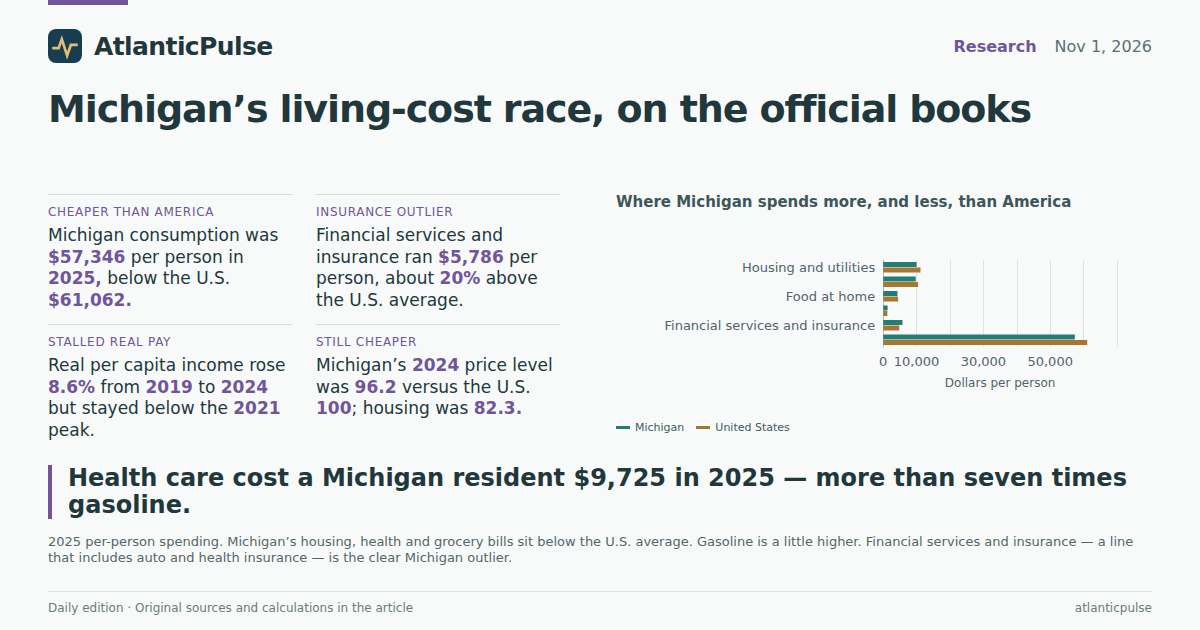
The race talks groceries. The books talk clinics.
Rep. Haley Stevens’s Sunday endorsement of Republican Mike Rogers turned Michigan’s Senate race into a party civil war. Abdul El-Sayed, the Democratic nominee, waved it off and said he was focused on what voters actually feel: the high cost of living. That is a fair campaign sentence. It is also a testable one. The Bureau of Economic Analysis publishes annual personal consumption expenditures per resident through 2025. Those figures are not a grocery receipt and they are not a household budget. They are the official, per-person ledger of what was spent in Michigan, Wisconsin, Ohio and the United States, in current dollars, before anyone stood in a Detroit church pew.
The first surprise is not that Michigan got more expensive. Every large bill did. The surprise is which bills did the work. In 2025 a Michigan resident’s consumption ran to $57,346, still below the U.S. $61,062. Housing and utilities took $10,007. Health care — outpatient, hospital and nursing-home services, not premiums — took $9,725. Food and beverages bought for home use took $4,271. Gasoline and other energy goods took $1,320. Health care alone was more than seven times the pump. If the midterm is a referendum on living costs, the clinic, not the gallon, is the larger line.
Michigan’s household bills, per person

View exact chart values
| year | total | housing_utilities | health_care | food_off_premises | gasoline_energy_goods | financial_insurance | health_to_gas_ratio | housing_share_pct | health_share_pct | food_share_pct | gas_share_pct |
|---|---|---|---|---|---|---|---|---|---|---|---|
| 2015 | 36754 | 6283 | 6371 | 2823 | 1041 | 3787 | 6.12 | 17.1 | 17.3 | 7.7 | 2.8 |
| 2016 | 38081 | 6569 | 6641 | 2959 | 933 | 3880 | 7.12 | 17.3 | 17.4 | 7.8 | 2.5 |
| 2017 | 39450 | 6688 | 6778 | 3120 | 1048 | 4173 | 6.47 | 17 | 17.2 | 7.9 | 2.7 |
| 2018 | 40991 | 6925 | 6950 | 3173 | 1199 | 4417 | 5.8 | 16.9 | 17 | 7.7 | 2.9 |
| 2019 | 42091 | 7209 | 7275 | 3260 | 1151 | 4441 | 6.32 | 17.1 | 17.3 | 7.7 | 2.7 |
| 2020 | 41203 | 7445 | 6777 | 3506 | 817 | 4516 | 8.29 | 18.1 | 16.4 | 8.5 | 2 |
| 2021 | 46187 | 7796 | 7504 | 3847 | 1229 | 4888 | 6.11 | 16.9 | 16.2 | 8.3 | 2.7 |
| 2022 | 49775 | 8388 | 7875 | 4075 | 1585 | 5007 | 4.97 | 16.9 | 15.8 | 8.2 | 3.2 |
| 2023 | 52050 | 8852 | 8391 | 4145 | 1436 | 5165 | 5.84 | 17 | 16.1 | 8 | 2.8 |
| 2024 | 54717 | 9537 | 9088 | 4197 | 1367 | 5491 | 6.65 | 17.4 | 16.6 | 7.7 | 2.5 |
| 2025 | 57346 | 10007 | 9725 | 4271 | 1320 | 5786 | 7.37 | 17.5 | 17 | 7.4 | 2.3 |
A cheaper state, with one expensive habit
Put the same 2025 categories next to the country and two neighbors voting on Tuesday, and Michigan does not look like the high-cost outlier of campaign ads. Housing and utilities were about 10 percent below the U.S. average. Food at home was a little below. Health care was below too, at $9,725 against $10,442 nationally. Wisconsin and Ohio spent more on doctors and hospitals than Michigan did — $10,920 and $10,900 per person. Gasoline was the one everyday fuel line where Michigan spent more than the United States, $1,320 against $1,225, and even that was 2.3 percent of Michigan consumption. Wisconsin’s pump-and-energy bill was higher still, at $1,664.
Regional price parities for 2024, the latest year, say the same thing in a different vocabulary. Michigan’s all-items index was 96.2, with the United States at 100. Its housing RPP was 82.3, meaning the tenant rents BEA uses to price shelter sat far below the national housing price level. Wisconsin was 94.1 on all items; Ohio was 92.8. Cheap compared with America is not the same as comfortable compared with last year. It does mean that a Michigan cost-of-living speech that sounds like California is arguing with the official price map.
2025 bills in three Great Lakes states

View exact chart values
| state | total | housing_utilities | health_care | food_off_premises | gasoline_energy_goods | housing_share_pct | health_share_pct | food_share_pct | gas_share_pct | health_minus_gas | health_to_gas_ratio |
|---|---|---|---|---|---|---|---|---|---|---|---|
| Michigan | 57346 | 10007 | 9725 | 4271 | 1320 | 17.5 | 17 | 7.4 | 2.3 | 8405 | 7.37 |
| Wisconsin | 57246 | 9704 | 10920 | 4071 | 1664 | 17 | 19.1 | 7.1 | 2.9 | 9256 | 6.56 |
| Ohio | 55295 | 8937 | 10900 | 4257 | 1228 | 16.2 | 19.7 | 7.7 | 2.2 | 9672 | 8.88 |
| United States | 61062 | 11159 | 10442 | 4459 | 1225 | 18.3 | 17.1 | 7.3 | 2 | 9217 | 8.52 |
Prices are still below the U.S. average

View exact chart values
| state | all_items_rpp | housing_rpp |
|---|---|---|
| Michigan | 96.2 | 82.3 |
| Wisconsin | 94.1 | — |
| Ohio | 92.8 | — |
| United States | 100 | 100 |
The insurance line nobody puts on a lawn sign
One Michigan bill does sit clearly above the national average, and it is not hamburger. Financial services and insurance — a bundle that includes life, household, health and motor-vehicle insurance as well as bank fees — ran to $5,786 per Michigan resident in 2025. The U.S. figure was $4,825. That is about 20 percent more, or $961 a person. It is also larger than food at home. Michigan’s auto-insurance reputation is not a myth on this ledger; it is a line item.
That matters for how to hear the campaign. El-Sayed’s cost-of-living pitch, and the independent ads Stevens denounced, tend to land on groceries, Israel or both. The official mix is more boring and more stubborn: housing (with imputed owner-occupied rent baked in), health-care services, and a fat insurance-and-finance charge. Gasoline’s share of Michigan spending was 2.7 percent in 2019 and 2.3 percent in 2025. Health care’s share was 17.3 percent then and 17.0 percent now. The pump is loud. The clinic is large.
Where Michigan spends more, and less, than America

View exact chart values
| category | michigan | united_states | mi_minus_us | mi_as_pct_of_us |
|---|---|---|---|---|
| Housing and utilities | 10007 | 11159 | -1152 | 89.7 |
| Health care | 9725 | 10442 | -717 | 93.1 |
| Food at home | 4271 | 4459 | -188 | 95.8 |
| Gasoline and other energy goods | 1320 | 1225 | 95 | 107.8 |
| Financial services and insurance | 5786 | 4825 | 961 | 119.9 |
| Total PCE | 57346 | 61062 | -3716 | 93.9 |
Real pay peaked four years ago
Current-dollar bills can rise because people buy more, or because prices rose, or both. BEA’s real per capita personal income, in 2017 dollars and adjusted for regional prices, tries to strip out the price fog. In Michigan it went from $49,306 in 2019 to $53,569 in 2024, an 8.6 percent gain. The United States gained 10.3 percent over the same span. Wisconsin matched Michigan at 8.6 percent. Ohio did a little better, at 9.7 percent. Nobody in this set recaptured 2021. Michigan’s real income peaked at $55,679 that year and was about $2,100 lower by 2024.
So the squeeze that voters describe is not a collapse in the official real paycheck. It is a stalled recovery after a pandemic spike, sitting under bills that kept climbing in current dollars. Michigan consumption per person rose 36.2 percent from 2019 to 2025; U.S. consumption rose 39.7 percent. Housing and utilities in Michigan were up 38.8 percent, food at home 31.0 percent, health care 33.7 percent, gasoline 14.7 percent. Those are price-and-quantity mixes, not inflation rates. They still explain why a state that is cheaper than America can feel worse than 2019 without anyone faking the grocery bag.
Real income rose, then stalled

View exact chart values
| year | michigan | wisconsin | ohio | united_states |
|---|---|---|---|---|
| 2015 | 47218 | 50684 | 48895 | 49396 |
| 2016 | 48000 | 50991 | 49223 | 49828 |
| 2017 | 48928 | 51773 | 50280 | 51006 |
| 2018 | 48921 | 52759 | 50500 | 52242 |
| 2019 | 49306 | 53652 | 51249 | 53683 |
| 2020 | 53586 | 57378 | 55074 | 56514 |
| 2021 | 55679 | 59816 | 57339 | 59365 |
| 2022 | 53454 | 57706 | 54882 | 57104 |
| 2023 | 53903 | 57791 | 55789 | 58088 |
| 2024 | 53569 | 58273 | 56232 | 59195 |
Sources and methods
All spending figures are BEA state personal consumption expenditures per resident in current dollars, calendar years 2015–2025, from the SAPCE release pinned as bea-sapce-2026-09-30. They are not household averages, weekly budgets or Election Day prices.
Housing and utilities include imputed rental of owner-occupied dwellings plus tenant rent and household utilities. Health care is outpatient, hospital and nursing-home services; health-insurance premiums sit in financial services and insurance, which also includes other insurance and bank fees. Gasoline and other energy goods include motor fuels, lubricants and fuel oils, not household electricity.
Real per capita personal income is BEA’s RPP-adjusted series in constant 2017 dollars, 2015–2024, from the SARPI/SARPP release pinned as bea-rpp-2026-02-19. Regional price parities set the United States at 100; housing RPPs are estimated from tenant rents. Wisconsin and Ohio housing RPPs were not extracted for this piece.
Growth rates are simple percent changes between calendar years. Missing values were not treated as zero. No causal claim is made about votes, ads or candidate positions. Provider snapshots lag publication; 2025 PCE is the latest annual estimate in the pinned extract, not a November 2026 observation.
Research completed 2026-11-02, for the November 1, 2026 news edition. The available source data may cover earlier periods; see the observation periods and source vintages above.