Research
Maine is closing birth units. The hospital bill is still going up.
A closed delivery room, an open invoice
MaineHealth will end labor and delivery at Lincoln Hospital in Damariscotta by the end of the year. The system says about 130 births a year is too few for obstetricians to keep their skills. Maine has already lost 11 hospital-based birthing centers since 2015, and more than 40 percent of women in Washington and Aroostook counties already drive at least an hour for a delivery, Maine Public reported. Lawmakers will send a letter. Letters do not keep a labor unit staffed.
The official books cannot count those 130 babies, and they cannot time a winter drive from Patten. They can answer a blunter question that the hearing left hanging: if rural hospitals are shedding services, is Maine already spending less on hospital care? It is not. In 2024, Maine residents spent $10,913 per person on health-care services — outpatient visits, hospital stays and nursing homes — against $9,747 for the United States, according to the Bureau of Economic Analysis. That is 12 percent above the national average, in current dollars, and it is not a new gap. Maine has run ahead of the country on this measure in every year of the published series.
Those dollars are consumption, not prices, and they are not a household survey. They also exclude prescription drugs and other medical products, which sit in a different BEA line. Even so, the direction is not subtle. Maine’s per-person health-care service bill was $7,363 in 2015, the year the birthing-center losses started to pile up in the reporting. By 2024 it was $10,913. The national figure rose too. Maine did not fall behind because it closed rooms. It kept writing larger checks.
Maine households spend more per person on health-care services than the U.S. average

View exact chart values
| year | me_health_pc | us_health_pc | me_minus_us | me_vs_us_pct | health_share_of_pce_pc | hosp_pc | health_fn_share | hosp_pce_share | me_hosp_gdp_share | us_hosp_gdp_share | me_hosp_real | me_gdp_real | pop |
|---|---|---|---|---|---|---|---|---|---|---|---|---|---|
| 1997 | 2972 | 2901 | 71 | 102.4 | 14.8 | 1351 | 17 | 6.7 | 2.88 | 1.93 | 1506.7 | 46325 | 1254774 |
| 1998 | 3162 | 3016 | 146 | 104.8 | 14.8 | 1420 | 17.3 | 6.7 | 2.86 | 1.91 | 1531.1 | 48138.5 | 1259127 |
| 1999 | 3318 | 3095 | 223 | 107.2 | 14.6 | 1476 | 17.2 | 6.5 | 2.88 | 1.89 | 1619.3 | 50620.3 | 1266808 |
| 2000 | 3548 | 3255 | 293 | 109 | 14.7 | 1568 | 17.4 | 6.5 | 2.88 | 1.85 | 1703.4 | 52958.5 | 1277072 |
| 2001 | 3828 | 3497 | 331 | 109.5 | 15.1 | 1690 | 17.9 | 6.7 | 3.08 | 1.95 | 1788.8 | 54066.2 | 1285692 |
| 2002 | 4144 | 3765 | 379 | 110.1 | 15.6 | 1850 | 18.6 | 6.9 | 3.28 | 2.07 | 1892.5 | 55406.5 | 1295960 |
| 2003 | 4378 | 3978 | 400 | 110.1 | 15.7 | 1999 | 18.9 | 7.2 | 3.45 | 2.14 | 2014.1 | 56882.4 | 1306513 |
| 2004 | 4738 | 4231 | 507 | 112 | 16.1 | 2199 | 19.3 | 7.5 | 3.74 | 2.17 | 2255.2 | 58934.8 | 1313688 |
| 2005 | 5039 | 4469 | 570 | 112.8 | 16.3 | 2409 | 19.5 | 7.8 | 3.81 | 2.11 | 2326 | 59589.7 | 1318787 |
| 2006 | 5303 | 4665 | 638 | 113.7 | 16.4 | 2589 | 19.7 | 8 | 4.02 | 2.13 | 2465.9 | 59986 | 1323619 |
| 2007 | 5609 | 4907 | 702 | 114.3 | 16.8 | 2751 | 20.2 | 8.3 | 4.15 | 2.15 | 2540.6 | 60032.6 | 1327040 |
| 2008 | 5881 | 5115 | 766 | 115 | 17.2 | 2921 | 20.6 | 8.5 | 4.43 | 2.3 | 2677.7 | 59845.1 | 1330509 |
| 2009 | 6103 | 5322 | 781 | 114.7 | 17.8 | 3049 | 21.3 | 8.9 | 4.7 | 2.54 | 2779.5 | 58771.8 | 1329590 |
| 2010 | 6324 | 5493 | 831 | 115.1 | 17.8 | 3239 | 21.2 | 9.1 | 4.67 | 2.46 | 2776.5 | 59958.5 | 1327967 |
| 2011 | 6591 | 5635 | 956 | 117 | 17.9 | 3433 | 21.3 | 9.3 | 4.89 | 2.45 | 2886.9 | 59429.7 | 1330060 |
| 2012 | 6672 | 5794 | 878 | 115.2 | 18 | 3505 | 21.4 | 9.5 | 5.06 | 2.45 | 2962.6 | 59181.7 | 1330954 |
| 2013 | 6711 | 5884 | 827 | 114.1 | 17.7 | 3472 | 21.2 | 9.2 | 5.07 | 2.42 | 2982.9 | 59013.9 | 1332673 |
| 2014 | 6904 | 6094 | 810 | 113.3 | 18 | 3531 | 21.6 | 9.2 | 5.07 | 2.38 | 3048.6 | 59589.8 | 1336617 |
| 2015 | 7363 | 6400 | 963 | 115 | 18.6 | 3762 | 22.4 | 9.5 | 5.21 | 2.45 | 3182.9 | 60563 | 1335768 |
| 2016 | 7777 | 6674 | 1103 | 116.5 | 18.8 | 3927 | 22.6 | 9.5 | 5 | 2.49 | 3097.4 | 62037.1 | 1340292 |
| 2017 | 8119 | 6875 | 1244 | 118.1 | 18.8 | 4069 | 22.5 | 9.4 | 5.05 | 2.48 | 3181.4 | 63000.6 | 1344956 |
| 2018 | 8475 | 7137 | 1338 | 118.7 | 18.7 | 4303 | 22.3 | 9.5 | 4.83 | 2.45 | 3144.2 | 64806.3 | 1350606 |
| 2019 | 8810 | 7487 | 1323 | 117.7 | 19 | 4472 | 22.7 | 9.6 | 4.78 | 2.44 | 3196.6 | 66758.4 | 1357523 |
| 2020 | 8245 | 7100 | 1145 | 116.1 | 17.8 | 4125 | 21.8 | 8.9 | 4.78 | 2.52 | 3251.5 | 67639.2 | 1364546 |
| 2021 | 8912 | 7956 | 956 | 112 | 17.2 | 4462 | 20.8 | 8.6 | 4.44 | 2.39 | 3236.3 | 71353.5 | 1379009 |
| 2022 | 9335 | 8440 | 895 | 110.6 | 16.6 | 4655 | 20.2 | 8.3 | 4.13 | 2.29 | 3153.7 | 72884.4 | 1391585 |
| 2023 | 10018 | 9087 | 931 | 110.2 | 16.8 | 4956 | 20.5 | 8.3 | 4.03 | 2.31 | 3136 | 75514 | 1401992 |
| 2024 | 10913 | 9747 | 1166 | 112 | 17.3 | 5306 | 21.1 | 8.4 | 3.87 | 2.36 | 3038.6 | 77758.6 | 1408438 |
| 2025 | — | — | — | — | — | — | — | — | — | — | — | 78200.8 | 1414874 |
Where the money actually goes
Narrow the lens from “health-care services” to hospitals themselves and the same pattern holds. BEA’s Health function — medical products, outpatient care, hospitals and nursing homes — came to $18.7 billion in Maine in 2024, about 21 percent of all personal consumption in the state. Hospitals alone were $7.5 billion, or 8.4 percent of total spending. Divide by resident population and that is about $5,300 per person on hospitals, up from about $3,800 in 2015.
Inside that Health-function total, hospitals were still the largest piece: 40 percent. Outpatient services were 36 percent, medical products 18 percent, nursing homes 6 percent. The mix matters because a closed obstetric unit does not automatically shrink the hospital line. Patients travel. They wait. They use emergency rooms. The dollars can follow them to Portland or Bangor and still show up as Maine consumption. The spreadsheet records the invoice. It does not record the drive.
None of this is a price index. Current dollars rose with inflation, an older population and whatever mix of services people actually received. The comparison that follows is not “Maine hospitals got 49 percent more expensive.” It is that household spending on hospitals rose about 49 percent in nominal terms from 2015 to 2024 while the state’s population rose about 5 percent. Someone paid more. The next question is whether the industry on the other side of the bill got larger.
Hospitals still take the largest slice of Maine’s household health bill

View exact chart values
| category | millions | share |
|---|---|---|
| Hospitals | 7472.9 | 40 |
| Outpatient services | 6759.4 | 36.2 |
| Nursing homes | 1100.2 | 5.9 |
| Medical products | 3353.6 | 17.9 |
Expensive, but not the most expensive
Among a set of New England neighbors, large states and other small or rural states, Maine’s 2024 health-care service bill sits in the expensive half, not at the extreme. Utah spent $7,233 per person. Texas spent $7,807. The U.S. average was $9,747. Maine was $10,913 — above New Hampshire and Connecticut, a little below California, and well below Massachusetts, West Virginia, New York and Alaska. Alaska led this comparison at $14,044.
That ranking is not a 50-state census, and it is not adjusted for age or regional prices. An older state will tend to spend more. A state with more uninsured people, or younger people, will tend to spend less. Utah’s figure is a reminder that “rural” and “cheap” are not synonyms. West Virginia’s is a reminder that a strained hospital system can still generate a large per-person bill. Maine looks, on this evidence, like a high-spending New England state with a small population and a large health-care footprint — not like a place that has already bargained hospital care down to Texas levels.
The point for Damariscotta is narrower. Closing a 130-birth unit does not, by itself, move Maine onto the cheap end of this list. The state’s households were already paying a premium, relative to the country, before Lincoln Hospital’s board voted.
Among comparable states, Maine’s 2024 health-care service bill sits in the expensive half

View exact chart values
| state | health_pc |
|---|---|
| Utah | 7233 |
| Texas | 7807 |
| Florida | 9545 |
| Wyoming | 9640 |
| United States | 9747 |
| Montana | 9747 |
| Rhode Island | 9864 |
| Connecticut | 10639 |
| New Hampshire | 10682 |
| Maine | 10913 |
| California | 11054 |
| Vermont | 11493 |
| North Dakota | 11667 |
| Massachusetts | 11985 |
| West Virginia | 12055 |
| New York | 12221 |
| Alaska | 14044 |
The industry got smaller. The invoice did not.
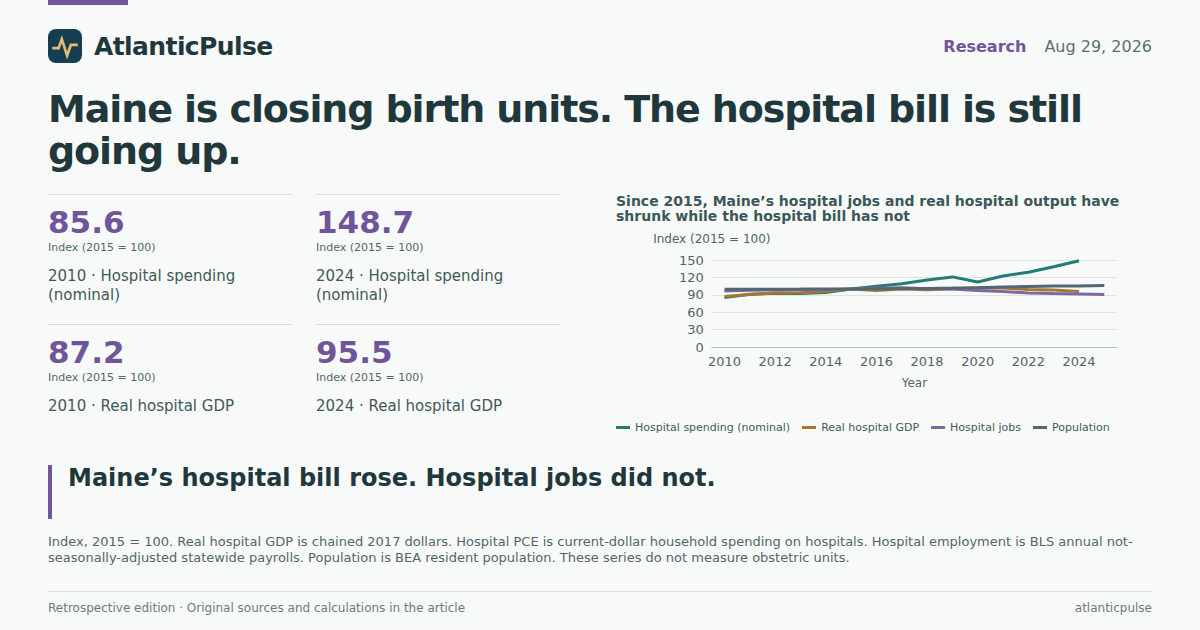
Turn from what households spent to what hospitals produced, and the lines diverge. Real hospital GDP in Maine — output, not the bill — was $3.18 billion in chained 2017 dollars in 2015. In 2024 it was $3.04 billion, about 4.5 percent lower. Over the same span, Maine’s whole economy, also in real terms, expanded about 28 percent. Indexed to 2015, hospital output is the series that bends down after a late-2010s plateau. Population keeps climbing. Nominal hospital spending keeps climbing. Real hospital GDP does not.
Hospital payrolls tell the same story in people. Statewide hospital employment averaged 33,000 in 2015 and 29,900 in 2025, according to BLS State and Area Employment annual figures that are not seasonally adjusted. That is a 9 percent decline, and it is larger if the starting point is the 2017 peak of 33,700. These are not Lincoln Hospital headcounts. They are every hospital job the survey catches in Maine. They still moved in the opposite direction of the household invoice.
Hospitals remain a bigger slice of Maine’s economy than of the nation’s. Hospital GDP was 3.9 percent of Maine’s current-dollar output in 2024, against 2.4 percent for the United States, using BEA state GDP. That Maine premium has been shrinking, not growing: the state’s hospital share peaked around 5.2 percent in 2015. The industry is still oversized relative to the country. It is no longer as oversized as it was when the birthing-center closures began to accumulate in the reporting.
Since 2015, Maine’s hospital jobs and real hospital output have shrunk while the hospital bill has not

View exact chart values
| year | health_pc_idx | us_health_pc_idx | hosp_real_idx | gdp_real_idx | hosp_emp_idx | hcsa_emp_idx | hosp_pce_idx | pop_idx |
|---|---|---|---|---|---|---|---|---|
| 2010 | 85.9 | 85.8 | 87.2 | 99 | 96.4 | 96.6 | 85.6 | 99.4 |
| 2011 | 89.5 | 88 | 90.7 | 98.1 | 97.9 | 97.2 | 90.9 | 99.6 |
| 2012 | 90.6 | 90.5 | 93.1 | 97.7 | 98.2 | 98.1 | 92.8 | 99.6 |
| 2013 | 91.1 | 91.9 | 93.7 | 97.4 | 98.8 | 98.3 | 92.1 | 99.8 |
| 2014 | 93.8 | 95.2 | 95.8 | 98.4 | 98.8 | 98.4 | 93.9 | 100.1 |
| 2015 | 100 | 100 | 100 | 100 | 100 | 100 | 100 | 100 |
| 2016 | 105.6 | 104.3 | 97.3 | 102.4 | 101.2 | 101.1 | 104.7 | 100.3 |
| 2017 | 110.3 | 107.4 | 100 | 104 | 102.1 | 102.7 | 108.9 | 100.7 |
| 2018 | 115.1 | 111.5 | 98.8 | 107 | 100.3 | 102.3 | 115.6 | 101.1 |
| 2019 | 119.7 | 117 | 100.4 | 110.2 | 100 | 104.2 | 120.8 | 101.6 |
| 2020 | 112 | 110.9 | 102.2 | 111.7 | 97.6 | 99.8 | 112 | 102.2 |
| 2021 | 121 | 124.3 | 101.7 | 117.8 | 95.8 | 101.9 | 122.4 | 103.2 |
| 2022 | 126.8 | 131.9 | 99.1 | 120.3 | 93 | 100.7 | 128.9 | 104.2 |
| 2023 | 136.1 | 142 | 98.5 | 124.7 | 92.1 | 104.9 | 138.3 | 105 |
| 2024 | 148.2 | 152.3 | 95.5 | 128.4 | 91.5 | 108.8 | 148.7 | 105.4 |
| 2025 | — | — | — | 129.1 | 90.6 | 111.6 | — | 105.9 |
Hospitals are a larger share of Maine’s economy than of the U.S. economy — and that share has been falling

View exact chart values
| year | me_health_pc | us_health_pc | me_minus_us | me_vs_us_pct | health_share_of_pce_pc | hosp_pc | health_fn_share | hosp_pce_share | me_hosp_gdp_share | us_hosp_gdp_share | me_hosp_real | me_gdp_real | pop |
|---|---|---|---|---|---|---|---|---|---|---|---|---|---|
| 1997 | 2972 | 2901 | 71 | 102.4 | 14.8 | 1351 | 17 | 6.7 | 2.88 | 1.93 | 1506.7 | 46325 | 1254774 |
| 1998 | 3162 | 3016 | 146 | 104.8 | 14.8 | 1420 | 17.3 | 6.7 | 2.86 | 1.91 | 1531.1 | 48138.5 | 1259127 |
| 1999 | 3318 | 3095 | 223 | 107.2 | 14.6 | 1476 | 17.2 | 6.5 | 2.88 | 1.89 | 1619.3 | 50620.3 | 1266808 |
| 2000 | 3548 | 3255 | 293 | 109 | 14.7 | 1568 | 17.4 | 6.5 | 2.88 | 1.85 | 1703.4 | 52958.5 | 1277072 |
| 2001 | 3828 | 3497 | 331 | 109.5 | 15.1 | 1690 | 17.9 | 6.7 | 3.08 | 1.95 | 1788.8 | 54066.2 | 1285692 |
| 2002 | 4144 | 3765 | 379 | 110.1 | 15.6 | 1850 | 18.6 | 6.9 | 3.28 | 2.07 | 1892.5 | 55406.5 | 1295960 |
| 2003 | 4378 | 3978 | 400 | 110.1 | 15.7 | 1999 | 18.9 | 7.2 | 3.45 | 2.14 | 2014.1 | 56882.4 | 1306513 |
| 2004 | 4738 | 4231 | 507 | 112 | 16.1 | 2199 | 19.3 | 7.5 | 3.74 | 2.17 | 2255.2 | 58934.8 | 1313688 |
| 2005 | 5039 | 4469 | 570 | 112.8 | 16.3 | 2409 | 19.5 | 7.8 | 3.81 | 2.11 | 2326 | 59589.7 | 1318787 |
| 2006 | 5303 | 4665 | 638 | 113.7 | 16.4 | 2589 | 19.7 | 8 | 4.02 | 2.13 | 2465.9 | 59986 | 1323619 |
| 2007 | 5609 | 4907 | 702 | 114.3 | 16.8 | 2751 | 20.2 | 8.3 | 4.15 | 2.15 | 2540.6 | 60032.6 | 1327040 |
| 2008 | 5881 | 5115 | 766 | 115 | 17.2 | 2921 | 20.6 | 8.5 | 4.43 | 2.3 | 2677.7 | 59845.1 | 1330509 |
| 2009 | 6103 | 5322 | 781 | 114.7 | 17.8 | 3049 | 21.3 | 8.9 | 4.7 | 2.54 | 2779.5 | 58771.8 | 1329590 |
| 2010 | 6324 | 5493 | 831 | 115.1 | 17.8 | 3239 | 21.2 | 9.1 | 4.67 | 2.46 | 2776.5 | 59958.5 | 1327967 |
| 2011 | 6591 | 5635 | 956 | 117 | 17.9 | 3433 | 21.3 | 9.3 | 4.89 | 2.45 | 2886.9 | 59429.7 | 1330060 |
| 2012 | 6672 | 5794 | 878 | 115.2 | 18 | 3505 | 21.4 | 9.5 | 5.06 | 2.45 | 2962.6 | 59181.7 | 1330954 |
| 2013 | 6711 | 5884 | 827 | 114.1 | 17.7 | 3472 | 21.2 | 9.2 | 5.07 | 2.42 | 2982.9 | 59013.9 | 1332673 |
| 2014 | 6904 | 6094 | 810 | 113.3 | 18 | 3531 | 21.6 | 9.2 | 5.07 | 2.38 | 3048.6 | 59589.8 | 1336617 |
| 2015 | 7363 | 6400 | 963 | 115 | 18.6 | 3762 | 22.4 | 9.5 | 5.21 | 2.45 | 3182.9 | 60563 | 1335768 |
| 2016 | 7777 | 6674 | 1103 | 116.5 | 18.8 | 3927 | 22.6 | 9.5 | 5 | 2.49 | 3097.4 | 62037.1 | 1340292 |
| 2017 | 8119 | 6875 | 1244 | 118.1 | 18.8 | 4069 | 22.5 | 9.4 | 5.05 | 2.48 | 3181.4 | 63000.6 | 1344956 |
| 2018 | 8475 | 7137 | 1338 | 118.7 | 18.7 | 4303 | 22.3 | 9.5 | 4.83 | 2.45 | 3144.2 | 64806.3 | 1350606 |
| 2019 | 8810 | 7487 | 1323 | 117.7 | 19 | 4472 | 22.7 | 9.6 | 4.78 | 2.44 | 3196.6 | 66758.4 | 1357523 |
| 2020 | 8245 | 7100 | 1145 | 116.1 | 17.8 | 4125 | 21.8 | 8.9 | 4.78 | 2.52 | 3251.5 | 67639.2 | 1364546 |
| 2021 | 8912 | 7956 | 956 | 112 | 17.2 | 4462 | 20.8 | 8.6 | 4.44 | 2.39 | 3236.3 | 71353.5 | 1379009 |
| 2022 | 9335 | 8440 | 895 | 110.6 | 16.6 | 4655 | 20.2 | 8.3 | 4.13 | 2.29 | 3153.7 | 72884.4 | 1391585 |
| 2023 | 10018 | 9087 | 931 | 110.2 | 16.8 | 4956 | 20.5 | 8.3 | 4.03 | 2.31 | 3136 | 75514 | 1401992 |
| 2024 | 10913 | 9747 | 1166 | 112 | 17.3 | 5306 | 21.1 | 8.4 | 3.87 | 2.36 | 3038.6 | 77758.6 | 1408438 |
| 2025 | — | — | — | — | — | — | — | — | — | — | — | 78200.8 | 1414874 |
Health care still hires. Hospitals, less so.
Zoom out from hospitals to the whole health-care and social-assistance payroll, and the picture flips again. Those jobs, seasonally adjusted, rose from 102,400 in July 2015 to 114,900 in July 2026. They were 16.7 percent of Maine’s nonfarm payroll in 2015 and 17.4 percent last month. The state’s labor market is more dependent on health care, not less. The shrinkage is inside the hospital building, not in the broader caring economy of clinics, home health and social assistance.
That split is what a closed obstetric unit looks like from 30,000 feet. The work does not disappear. It moves to a larger hospital, an ambulance, a clinic, or a living room that was never designed for a breech delivery. Family physician Rose Fuchs told lawmakers she has delivered twins at home in Maine because the hospital was too far. The payroll series will not record that night. It will record, eventually, whoever bills for the follow-up.
The honest limit of these numbers is that they cannot prove Lincoln Hospital should stay open, and they cannot prove the 11 lost birthing centers caused the drop in hospital jobs. Correlation across a decade of mergers, COVID, an aging census and changing insurance is not a verdict. What they can say, without stretching, is that Maine is not in a hospital-spending recession. Households are paying more. The hospital industry, measured in real output and in jobs, is smaller than it was when the closures started. If the policy goal is access within a 30- or 60-minute drive, the invoice is not evidence that the goal has been met. It is evidence that Maine has been paying hospital prices for a hospital system that is quietly contracting.
Sources and methods
This is retrospective enrichment using pinned catalogue snapshots, not a reconstruction of what was knowable on the 2026-08-29 edition date. Later releases and revisions may be present.
Research compiled 2026-09-11 against catalogue snapshots dated 2026-08-31 (BEA SAPCE and BEA annual state GDP/income) and 2026-08-24 (BLS SAE). BEA PCE observations are annual 1997–2024, release bea-sapce-2025-09-26. BEA GDP observations used here are annual; hospital GDP is available through 2024 in this snapshot, while all-industry GDP continues through 2025. BLS hospital employment is annual, not seasonally adjusted, through 2025. BLS health-care and social-assistance and total nonfarm payrolls are monthly and seasonally adjusted through July 2026; annual comparisons from those monthly series use July when present.
Per capita “health-care services” is BEA SAPCE2 spending on outpatient, hospital and nursing-home services. It excludes medical products. The SAPCE4 Health function used for composition and spending shares includes medical products, outpatient services, hospitals and nursing homes. Hospital “per person” figures divide SAPCE4 hospital millions by BEA resident population for the same year. Aggregate dollars are not household averages.
The 2024 state comparison is a selected set of New England, large and small/rural states plus the U.S. average, not a complete 50-state ranking, and is not adjusted for age, insurance or regional prices. Real GDP is chained 2017 dollars; spending series are current dollars. Missing observations were skipped and never treated as zero.
These series do not measure obstetric units, births, travel time, prices or quality. Statewide hospital employment is not Lincoln Hospital staffing. No causal effect is inferred from the overlap between birthing-center closures and the later drop in hospital jobs and real hospital GDP.
Research completed 2026-09-11, for the August 29, 2026 news edition. This is retrospective analysis, not a reconstruction of information available that day.