Research
Louisiana already has an industrial economy. A $100 billion spaceport is still a rounding error on the payroll.
A nine-figure press conference
On Tuesday, Gov. Jeff Landry and SpaceX sold Vermilion Parish a future measured in hundreds of billions. Starbase Louisiana would occupy about 125,000 acres of former Exxon marsh, start construction in 2027, and aim for a first Starship flight as soon as 2029. The talking point that filled the room was $100 billion. Louisiana Economic Development’s more grounded numbers were 3,000 direct jobs over a decade, at an average $92,600, plus more than 8,100 indirect jobs and a parish payment-in-lieu-of-taxes stream of about $25 million a year.
Those are real sums if they arrive. They are also a specific kind of number: an announced full-buildout capital plan, not cash already spent, and a jobs projection, not a payroll. One careful account of the deal separated the 2029 target from the “thousands of launches a year” ambition. This article asks a narrower question the announcement mostly skipped. How large is the Louisiana that already exists?
The answer, in the official books, is an economy of about $340 billion in 2025 current dollars — and a much slower one once prices are stripped out. Against that backdrop, $100 billion is enormous as a construction program and oddly small as a labor-market event.
Louisiana’s inflation-adjusted economy has grown slowly

View exact chart values
| year | real_gdp_billions | current_gdp_billions |
|---|---|---|
| 1997 | 202.39 | 116.42 |
| 1998 | 209.36 | 120.23 |
| 1999 | 213.48 | 125.67 |
| 2000 | 206.56 | 132.38 |
| 2001 | 210.53 | 138.2 |
| 2002 | 214.86 | 140.08 |
| 2003 | 223.58 | 155.2 |
| 2004 | 234.62 | 171 |
| 2005 | 249.56 | 199.31 |
| 2006 | 247.14 | 207.25 |
| 2007 | 234.22 | 203.77 |
| 2008 | 237.06 | 213.8 |
| 2009 | 241.87 | 206.11 |
| 2010 | 253.47 | 226.56 |
| 2011 | 241.24 | 230.52 |
| 2012 | 242.42 | 235.96 |
| 2013 | 236.48 | 231.65 |
| 2014 | 243.04 | 240.97 |
| 2015 | 239.58 | 234.32 |
| 2016 | 235.55 | 227.44 |
| 2017 | 239.83 | 239.83 |
| 2018 | 245.22 | 256.44 |
| 2019 | 246.67 | 257.5 |
| 2020 | 225.64 | 233.65 |
| 2021 | 242.58 | 273.06 |
| 2022 | 240.04 | 304.3 |
| 2023 | 248.95 | 318.04 |
| 2024 | 257.06 | 329.17 |
| 2025 | 259.93 | 340.08 |
Three hundred and forty billion, growing like a marsh
Bureau of Economic Analysis annual accounts put Louisiana’s current-dollar GDP at $340.1 billion in 2025. In chained 2017 dollars, the same economy produced $259.9 billion. That is only 28 percent above 1997. Over those 28 years the United States added entire tech and health-care industries; Louisiana added, in inflation-adjusted terms, a bit more than a quarter.
The $100 billion SpaceX figure is 29 percent of one year of Louisiana’s current-dollar output. That comparison is a scale illustration, not an accounting identity. Capital expenditure is not GDP, it is not spent in a single year, and a large share would leak to out-of-state contractors, rockets, and machine tools. Still, the ratio tells you why Baton Rouge treated the announcement as civilizational. Few private projects anywhere are pitched at a quarter of a state’s annual product.
It also tells you why the jobs math and the dollar math refuse to line up. A campus can be priced like a petrochemical complex and staffed like a mid-size mill.
The energy state is a chemical state now
Louisiana still introduces itself as an oil-and-gas place. The GDP accounts have moved on. In 2024, the latest year with a full industry split, oil and gas extraction contributed $6.7 billion, or 2.1 percent of the state’s $329.2 billion current-dollar GDP. Chemical manufacturing contributed $25.3 billion (7.7 percent). Petroleum and coal products manufacturing — refining, in plain speech — contributed $16.6 billion (5.0 percent). Construction contributed $20.9 billion (6.3 percent).
Add extraction, chemicals and refining and you get about 15 percent of the state. That is a serious industrial cluster. It is not the majority of Louisiana, and it has not been for some time. All manufacturing together was 18 percent. The residual — hospitals, government, trade, real estate, everything else — was about four-fifths of output.
The time series is ruder to nostalgia. Oil extraction GDP spiked with prices in the 2000s and again after 2020; it is not a jobs machine. Chemical output has climbed even as the headcount barely moved. Refining swings with crack spreads. Construction, the industry that would actually pour Starbase’s pads, was a $21 billion slice of a $329 billion pie in 2024 — which means a $100 billion multi-year build would be, if it happened on the advertised timetable, a construction boom the official accounts could not miss. Permits and FAA licenses still sit in front of that boom.
Chemicals and refining now dwarf oil extraction

View exact chart values
| year | oil_bn | chem_bn | refine_bn | construction_bn | mfg_bn |
|---|---|---|---|---|---|
| 1997 | 6.93 | 6.49 | 4.75 | 5.31 | 19.51 |
| 1998 | 7.11 | 6.26 | 4.72 | 6.07 | 19.72 |
| 1999 | 7.91 | 7.44 | 5.87 | 6.22 | 21.67 |
| 2000 | 11.93 | 6.51 | 4.44 | 6.58 | 19.47 |
| 2001 | 13.2 | 4.58 | 5.94 | 6.67 | 18.27 |
| 2002 | 8.5 | 6.64 | 5.9 | 6.63 | 21.11 |
| 2003 | 9.7 | 5.39 | 15.6 | 7 | 29.94 |
| 2004 | 10.98 | 7.66 | 20.03 | 7.53 | 37.67 |
| 2005 | 12.77 | 9.95 | 36.97 | 8.24 | 57.42 |
| 2006 | 14.48 | 8.78 | 32.77 | 10.09 | 53.06 |
| 2007 | 14.82 | 10.2 | 24.01 | 11.33 | 46.4 |
| 2008 | 16.84 | 9.53 | 22.19 | 11.58 | 43 |
| 2009 | 12.24 | 11.46 | 14.55 | 11.62 | 37.5 |
| 2010 | 13.01 | 14.21 | 23.09 | 10.71 | 49.34 |
| 2011 | 13.7 | 17.66 | 20.49 | 10.51 | 50.07 |
| 2012 | 12.22 | 17.62 | 21.93 | 10.71 | 52.28 |
| 2013 | 10.73 | 12.88 | 17.93 | 11.29 | 43.63 |
| 2014 | 9.48 | 12.65 | 21.57 | 12.69 | 47.35 |
| 2015 | 5.1 | 11.93 | 17.83 | 13.57 | 42.77 |
| 2016 | 4.51 | 14.43 | 9.55 | 14.49 | 36.03 |
| 2017 | 5.37 | 13.19 | 16.47 | 16.17 | 41.52 |
| 2018 | 6.32 | 17.89 | 19.72 | 16.93 | 49.94 |
| 2019 | 5.47 | 17.84 | 16.97 | 16.23 | 47.18 |
| 2020 | 2.86 | 16.36 | 3.94 | 14.75 | 32.55 |
| 2021 | 6.35 | 19.87 | 16.76 | 15.8 | 50.24 |
| 2022 | 9.49 | 22.31 | 22.39 | 16.41 | 60.03 |
| 2023 | 7.64 | 22.63 | 19.56 | 18.44 | 59.67 |
| 2024 | 6.75 | 25.25 | 16.62 | 20.85 | 59.68 |
The energy complex is large. It is not most of Louisiana.

View exact chart values
| industry | billions_current | share_pct |
|---|---|---|
| Oil and gas extraction | 6.75 | 2.1 |
| Petroleum and coal products | 16.62 | 5 |
| Construction | 20.85 | 6.3 |
| Chemical manufacturing | 25.25 | 7.7 |
| All other industries | 259.7 | 78.9 |
The jobs the coast already lost
Payrolls make the same point without the price swings. Bureau of Labor Statistics state estimates, seasonally adjusted, put Louisiana at 2.02 million nonfarm jobs in July 2026. Construction employed 151,100 people. Manufacturing employed 143,300. Mining and logging employed 27,600.
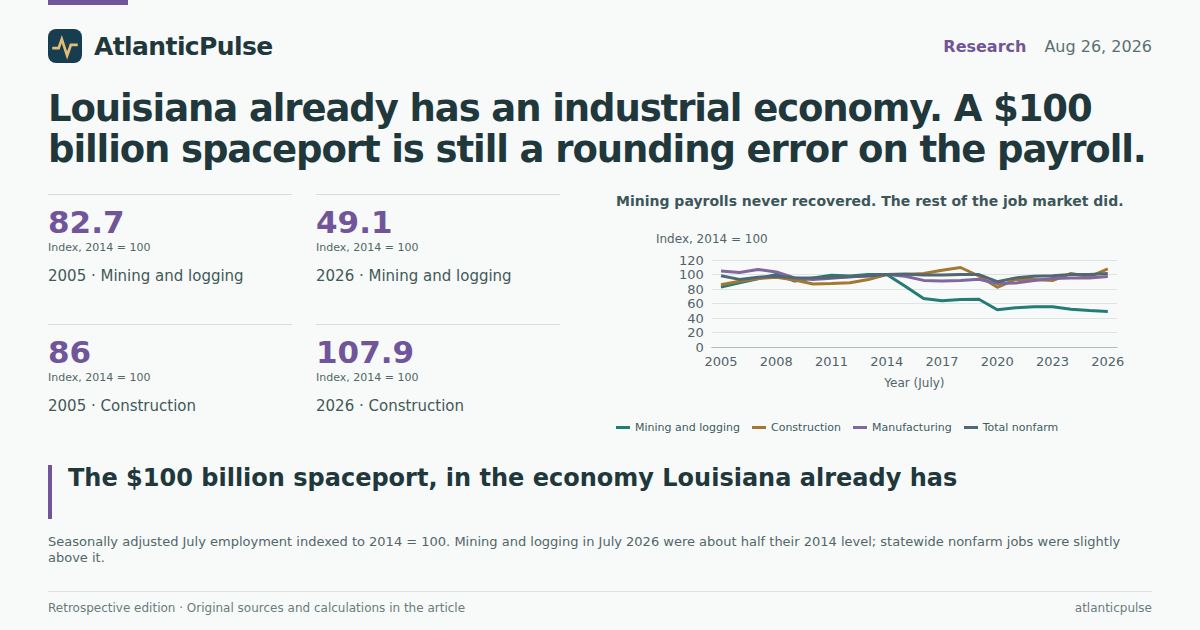
That mining number is the scar. Statewide mining and logging peaked at 58,000 in February 2012. Fourteen years later the industry is at 48 percent of that peak — 30,400 jobs gone, more than ten SpaceX direct-job pledges. Indexed to 2014, mining in July 2026 sat at 49. Total nonfarm was a shade above 100. Construction had more than recovered. Manufacturing had not quite. The oilfield did not come back.
Chemical manufacturing, measured as an annual average, employed 29,000 people in 2025 — almost exactly where it stood in 1990. The plants got more valuable. They did not become a hiring hall. That is the industrial structure SpaceX is being asked to disrupt: high-output, capital-heavy, and allergic to large net payroll gains.
Mining payrolls never recovered. The rest of the job market did.

View exact chart values
| year | mining_index | construction_index | manufacturing_index | nonfarm_index |
|---|---|---|---|---|
| 2005 | 82.7 | 86 | 105 | 98.3 |
| 2006 | 88.6 | 90.7 | 102.6 | 93.2 |
| 2007 | 94 | 94.6 | 107 | 96.3 |
| 2008 | 100.2 | 96.3 | 103.5 | 97.6 |
| 2009 | 90.9 | 92.4 | 95.3 | 95.4 |
| 2010 | 95.2 | 86.9 | 93.2 | 95 |
| 2011 | 99.1 | 87.4 | 94.9 | 96 |
| 2012 | 97.9 | 88.7 | 96.8 | 96.9 |
| 2013 | 100.2 | 93.1 | 98 | 98.3 |
| 2014 | 100 | 100 | 100 | 100 |
| 2015 | 83.8 | 99.9 | 97.6 | 100.5 |
| 2016 | 66.9 | 101.3 | 91.8 | 99.5 |
| 2017 | 63.9 | 105.8 | 91.1 | 99.3 |
| 2018 | 65.5 | 109.6 | 91.8 | 100.1 |
| 2019 | 65.8 | 98 | 93.5 | 99.9 |
| 2020 | 51.4 | 82.4 | 87.5 | 90.1 |
| 2021 | 54.1 | 93.2 | 88.1 | 95.3 |
| 2022 | 55.5 | 93 | 91.9 | 97.5 |
| 2023 | 55.5 | 91.6 | 94.3 | 98.2 |
| 2024 | 52.1 | 101.5 | 95.3 | 100.1 |
| 2025 | 50.2 | 96.8 | 95.2 | 100 |
| 2026 | 49.1 | 107.9 | 97.1 | 101.4 |
Acadiana’s existing labor market
The relevant labor market is not “Louisiana.” It is Lafayette and the coastal parishes that will feed Pecan Island. Lafayette metro nonfarm employment was 190,300 in July 2026. Construction there employed 12,400. Mining, on the annual series, was 7,200 in 2025, down from 19,400 in 2008. The oil-service town already lived through the bust this project is supposed to redeem.
Three thousand direct SpaceX jobs, delivered over ten years, would equal 1.6 percent of Lafayette’s current payroll and 0.15 percent of the state’s. The 8,100 indirect jobs in the state projection would be more noticeable, if they appear. Either figure is smaller than the mining jobs Lafayette has already shed. None of that makes the hires trivial to the people who get them. It does mean the press-conference vocabulary — transformational, generational, rewrite the future — is doing work the payroll survey will not.
Louisiana also rewrote its statutes before the countdown video. Aerospace records were pulled toward secrecy, trespass was toughened, and large operators were shielded from nuisance and sonic-boom claims. That is how a state behaves when it wants a project more than it wants a fight. The BEA and BLS books cannot tell you whether Starship will fly from Vermilion Parish in 2029. They can tell you what kind of economy would be standing next to the pad: slow-growing, chemically wealthy, short of oilfield jobs, and already large enough that 3,000 new badges would register as a plant opening, not a new planet.
3,000 SpaceX jobs are real. They are not a new labor market.

View exact chart values
| label | jobs |
|---|---|
| SpaceX promised direct jobs | 3000 |
| Lafayette mining, 2025 | 7200 |
| SpaceX promised indirect jobs | 8100 |
| LA mining and logging, Jul 2026 | 27600 |
| LA chemical manufacturing, 2025 | 29000 |
| LA mining jobs below Feb 2012 peak | 30400 |
| Lafayette total nonfarm, Jul 2026 | 190300 |
Sources and methods
This is retrospective enrichment using pinned catalogue snapshots, not a reconstruction of what was knowable on the edition date of 2026-08-26. Research retrieval ran on 2026-09-11.
BEA annual state GDP (product bea_regional_state_annual, snapshot created 2026-08-31, release bea-regional-state-annual-2026-04-09) supplied real GDP in millions of chained 2017 dollars and current-dollar GDP by industry. Statewide current-dollar GDP is observed through 2025. Industry detail for oil and gas extraction, chemical manufacturing, petroleum and coal products manufacturing, construction and all manufacturing is observed through 2024; 2025 industry cells were not in the extract and are not treated as zero.
BLS State and Area Employment (product bls_sae, snapshot 2026-08-24) supplied seasonally adjusted monthly payrolls for Louisiana total nonfarm, mining and logging, construction and manufacturing, and Lafayette total nonfarm and construction, January 2000–July 2026. Chemical manufacturing (statewide) and Lafayette mining and logging are annual not-seasonally-adjusted series as published, through 2025. Missing values were skipped and never recoded as zero. One non-null observation was kept per period. Indexed employment uses each series’ July value with 2014 = 100.
The $100 billion SpaceX figure is an announced full-buildout capital plan from contemporaneous reporting, not BEA investment and not a GDP flow. Comparing it with annual GDP is a scale illustration only. Job promises (3,000 direct, 8,100 indirect) are state economic-development projections over ten years, not filled positions. No causal claim is made that the spaceport will or will not be built, licensed or staffed on the advertised timetable. Aggregate dollars are not household averages. Lafayette metro is not Vermilion Parish; parish-level payrolls were not in the catalogue.
Research completed 2026-09-11, for the August 26, 2026 news edition. This is retrospective analysis, not a reconstruction of information available that day.