Research
LAUSD’s 6,000-job cut lands on a school payroll that already shrank
The 6,000-job cut, and the payroll already gone
Los Angeles Unified, the country’s second-largest school district, is being told it is in a “fiscal train wreck.” A state crisis team says the district is at high risk of insolvency after running a $1.5 billion to $2 billion annual structural deficit; the three-year plan would eliminate more than 6,000 of roughly 80,000 jobs, as Heartlander News reported. Enrollment has been falling. Temporary pandemic money went away. Special education costs rose. The board still signed a 14 percent teacher raise last April to avert a strike. Those are the district’s books. They are not, by themselves, the region’s labor market.
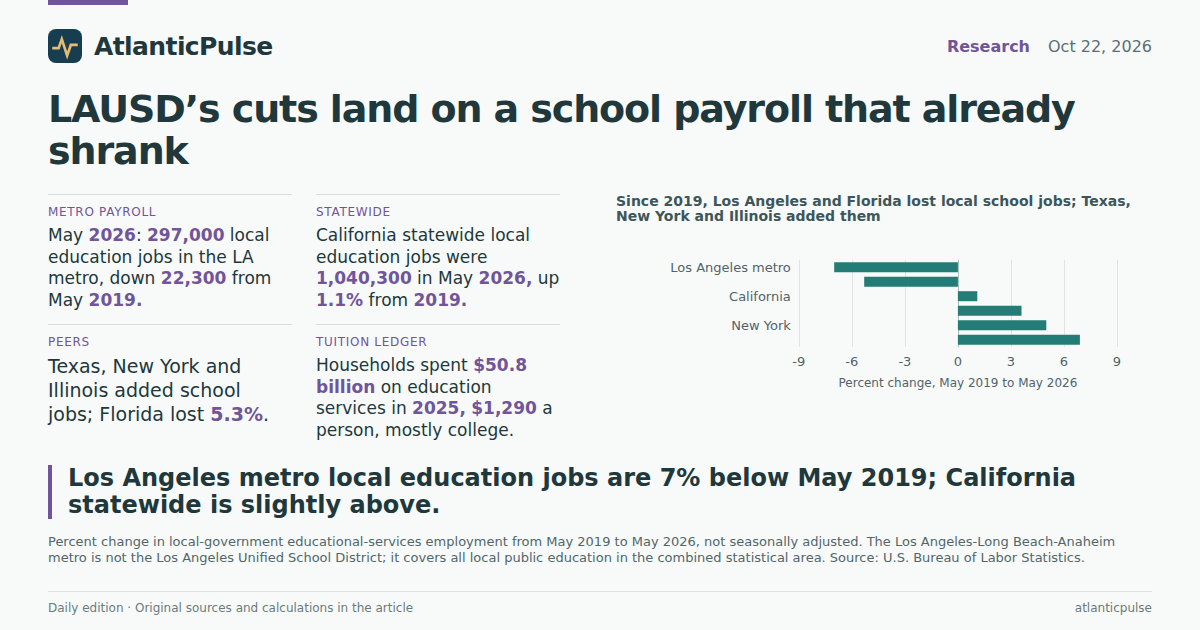
The official payroll that comes closest is local-government educational services in the Los Angeles-Long Beach-Anaheim metro — every public school employer in that combined area, not LAUSD alone. In May 2026, that series stood at 297,000 jobs. In May 2019 it was 319,300. That is a loss of 22,300 jobs, or 7 percent, before the 6,000-cut plan even starts. From May 2024 to May 2026 the metro lost another 14,900 school jobs. The annual average for 2025, 296,100, is still below 2019’s 305,500. May is the right month to look at: July and August are the school-year trough, when the same series can drop 40,000 jobs in a single summer and then bounce back when classrooms reopen.
Six thousand jobs is 7.5 percent of LAUSD’s reported 80,000-person workforce. It is only about 2 percent of the metro’s local education payroll. That arithmetic can sound reassuring until you notice the metro already shed more than three times as many school jobs since 2019 as the district now says it must cut. The proposed layoff is landing on a shrinking base, not a padded one.
Los Angeles school-payroll recovery stalled while California’s statewide count came back

View exact chart values
| year | california | la_metro | texas | new_york | florida | illinois |
|---|---|---|---|---|---|---|
| 2010 | 95.5 | 101.5 | 97 | — | 102.2 | 104.3 |
| 2011 | 93.1 | 97.8 | 96.3 | 102.2 | 101 | 102.3 |
| 2012 | 91.3 | 95.9 | 92.9 | 100.7 | 99.1 | 102.4 |
| 2013 | 90.8 | 93.3 | 93.7 | 99.5 | 100.2 | 101.9 |
| 2014 | 92.2 | 94.8 | 95.4 | 98.1 | 99.5 | 100.6 |
| 2015 | 93.7 | 95.7 | 96.9 | 98.7 | 99.3 | 100 |
| 2016 | 96.5 | 98.7 | 98.6 | 98.7 | 99.9 | 99.2 |
| 2017 | 98.4 | 100.1 | 99.7 | 98.9 | 99.6 | 98.8 |
| 2018 | 99.6 | 100.2 | 99.9 | 100.2 | 99.8 | 98.8 |
| 2019 | 100 | 100 | 100 | 100 | 100 | 100 |
| 2020 | 89 | 90.9 | 93.6 | 92.4 | 93.9 | 91.7 |
| 2021 | 88.8 | 89.9 | 96.7 | 93.8 | 94.3 | 93.9 |
| 2022 | 93.8 | 92.3 | 99.2 | 96.3 | 94 | 96.6 |
| 2023 | 97.3 | 94.6 | 101.6 | 98.2 | 95.4 | 100 |
| 2024 | 100.1 | 97.7 | 103.6 | 100.2 | 96.2 | 103.4 |
| 2025 | 102.1 | 98.6 | 103.2 | 102.5 | 96.3 | 105.5 |
| 2026 | 101.1 | 93 | 103.6 | 105 | 94.7 | 106.9 |
California came back. Los Angeles did not.
Statewide, California’s local-government education payroll did recover. May 2026 employment was 1,040,300, a hair above May 2019’s 1,029,100 and well above the 2021 trough of 913,700. The annual average for 2025, 1,001,100, is also above 2019. If you only read the California total, you would think public-school employment had returned to the pre-pandemic plateau. The Los Angeles metro is the hole inside that total.
Other large states did not move as one. From May 2019 to May 2026, Texas added 32,500 local education jobs (+3.6 percent), New York added 30,000 (+5.0 percent) and Illinois added 25,000 (+6.9 percent). Florida lost 19,500 (−5.3 percent). Los Angeles metro’s 7 percent drop is the steepest of that group. The comparison is not a verdict on test scores or on any single superintendent. It is a reminder that “California schools” is not one labor market, and that a statewide rebound can hide a metro that never got its school jobs back.
Since 2019, Los Angeles and Florida lost local school jobs; Texas, New York and Illinois added them

View exact chart values
| place | may2019 | may2026 | pct_change | job_change_thousands |
|---|---|---|---|---|
| Los Angeles metro | 319.3 | 297 | -7 | -22.3 |
| Florida | 368.5 | 349 | -5.3 | -19.5 |
| California | 1029.1 | 1040.3 | 1.1 | 11.2 |
| Texas | 891.3 | 923.8 | 3.6 | 32.5 |
| New York | 596.8 | 626.8 | 5 | 30 |
| Illinois | 360.6 | 385.6 | 6.9 | 25 |
The hiring is in hospitals, not schoolyards
Zoom out from school districts to the industries that actually added California jobs, and the contrast is rude. Seasonally adjusted health care and social assistance employment in California was 3,190,900 in August 2026, up 754,400, or 31 percent, from August 2019. Private educational services — colleges, private schools, training — rose 16.5 percent, to 444,200. Total nonfarm payrolls in California rose 4.1 percent. Local government, the bucket that includes public schools plus cities and counties, rose 3.5 percent. The Los Angeles metro’s entire nonfarm payroll rose 1.2 percent.
That is the same California labor market in which commentators keep noticing that health care is doing almost all the hiring. Public K-12 is not in that boom. Private education, which shows up on a different BLS line, is. The 6,000 jobs LAUSD wants to remove would be a rounding error on the statewide health-care payroll and a visible hole in a metro school system that has been getting smaller for years. None of this proves the raise caused the deficit, or that enrollment is the only driver. It does show where California has been willing to staff up, and where it has not.
California health care and private schools grew. Public local government barely did.

View exact chart values
| year | health_care | private_education | local_government | ca_nonfarm | la_nonfarm |
|---|---|---|---|---|---|
| 2010 | 75.6 | 77.2 | 92.7 | 81.8 | 84.9 |
| 2011 | 76.1 | 80.6 | 91.6 | 82.8 | 85.6 |
| 2012 | 78.9 | 83.8 | 90.8 | 84.8 | 87.9 |
| 2013 | 81.4 | 86.6 | 91.4 | 87.1 | 89.8 |
| 2014 | 84.1 | 89.3 | 92.8 | 89.5 | 91.5 |
| 2015 | 87.5 | 91.4 | 95.1 | 92.4 | 93.9 |
| 2016 | 90.4 | 93.4 | 97.2 | 94.7 | 96.1 |
| 2017 | 94.2 | 95.6 | 97.6 | 96.5 | 97.5 |
| 2018 | 96.8 | 98 | 98.9 | 98.5 | 99.1 |
| 2019 | 100 | 100 | 100 | 100 | 100 |
| 2020 | 97.4 | 88.4 | 91.6 | 90.2 | 88.2 |
| 2021 | 101.5 | 95.3 | 94.5 | 97.2 | 96 |
| 2022 | 105.5 | 99.7 | 97 | 101.8 | 99.8 |
| 2023 | 112 | 105.7 | 99.7 | 102.1 | 99.7 |
| 2024 | 119.4 | 109.5 | 101.6 | 102.9 | 100.6 |
| 2025 | 126.4 | 111.3 | 102.6 | 103.3 | 100.8 |
| 2026 | 131 | 116.5 | 103.5 | 104.1 | 101.2 |
Households are buying college, not plugging the district hole
Public-school payrolls are a government cost. What households buy is different, and the Bureau of Economic Analysis keeps that ledger under education services in personal consumption. In 2025 Californians spent $50.8 billion on education services, about $1,290 per person, against $1,065 for the United States. That gap has widened since 2010, when California and the country were nearly tied near $750 a person. The education share of California’s goods-plus-services consumption still fell, from 2.15 percent in 2010 to 1.84 percent in 2025, because everything else in the household budget grew faster.
Most of that household bill is not a substitute for LAUSD. In 2025, higher education was 54.7 percent of California’s education-services spending, or $27.7 billion. Nursery, elementary and secondary schools — the private-school and daycare slice of consumption, not the public district — were 17 percent, or $8.6 billion. The rest is other purchased instruction. Per-person health-care spending in California was $11,681 in 2025, nine times the education-services line. Families are buying college and clinics. They are not, on this ledger, backfilling a public-school operating deficit.
The implied resident population behind those per-person figures is about 39.4 million, derived from total PCE divided by per-capita PCE. That is an accounting identity, not a census count, and it is good enough to put a billion-dollar tuition bill next to a 6,000-job cut without pretending the two are the same pot of money.
Californians already spend more per person on education than the country — mostly not on public K-12

View exact chart values
| year | california | united_states | ca_total_billions |
|---|---|---|---|
| 2010 | 748 | 745 | 27.9 |
| 2011 | 797 | 765 | 30 |
| 2012 | 834 | 767 | 31.7 |
| 2013 | 845 | 780 | 32.4 |
| 2014 | 869 | 793 | 33.6 |
| 2015 | 893 | 812 | 34.8 |
| 2016 | 926 | 834 | 36.3 |
| 2017 | 952 | 849 | 37.5 |
| 2018 | 984 | 869 | 38.9 |
| 2019 | 1010 | 888 | 40 |
| 2020 | 988 | 874 | 39.1 |
| 2021 | 1065 | 919 | 41.7 |
| 2022 | 1126 | 969 | 44.1 |
| 2023 | 1186 | 1006 | 46.5 |
| 2024 | 1256 | 1037 | 49.4 |
| 2025 | 1290 | 1065 | 50.8 |
Of California’s $50.8 billion household education bill in 2025, college was more than half

View exact chart values
| category | billions | share |
|---|---|---|
| Higher education | 27.7 | 54.7 |
| Nursery, elementary and secondary | 8.6 | 17 |
| Other education services | 14.4 | 28.3 |
Sources and methods
Payroll figures are U.S. Bureau of Labor Statistics State and Area Employment, from the official SM bulk files in a snapshot with observations through August 2026 (release identifier bls-sm-snapshot-2026-08-24). Local-government educational services is not seasonally adjusted. Comparisons use May of each year so that summer school-year troughs do not masquerade as trend; August 2026 is reported separately and is not the basis for the 2019–2026 percent changes. New York’s local-education series begins in 2011. Annual averages are 12-month means of the monthly not-seasonally-adjusted series and match BLS annual values where both exist.
The Los Angeles series is the Los Angeles-Long Beach-Anaheim CBSA, which includes many districts besides Los Angeles Unified. Statewide California, Texas, New York, Florida and Illinois series are statewide. Seasonally adjusted series (total nonfarm, health care and social assistance, private educational services, local government) use August observations so that the latest month is comparable across years.
Household education spending is BEA personal consumption expenditures by state, SAPCE tables, 1997–2025 vintage (bea-sapce-2026-09-30). Education services is purchased instruction, not school-district expenditure. Per-person education spending is education-services totals divided by implied resident population, itself total PCE (goods plus services) divided by published per-capita PCE. Missing is not treated as zero. No causal claim is made that enrollment, the teacher raise, or any single policy produced the payroll path.
This is a retrospective reading of pinned snapshots, not current-day observation. Provider lag is normal.
Research completed 2026-10-23, for the October 22, 2026 news edition. The available source data may cover earlier periods; see the observation periods and source vintages above.