Research
Isaias is aimed at the refinery, not the wellhead
The wellhead is in Texas
Hurricane Isaias, the Atlantic’s first hurricane of a strangely quiet season, was forecast to come ashore near the Alabama-Florida line as a major storm, with surge into Florida’s Big Bend and enough inland wind to bother Atlanta. The energy market treated it as a Gulf of Mexico event: most federal offshore oil was already shut in, and analysts warned that a long outage at Pascagoula or Mobile could add cents — or, in a bad week, a dollar — to fuel that was already running about $6 a gallon for diesel. That is a real price risk. It is not, on the official books, a wellhead risk.
In 2025, the last full year of Bureau of Economic Analysis state GDP, U.S. oil-and-gas extraction was a $252 billion industry in current dollars. Texas alone booked $160 billion of that, about 64 percent of the national total. Louisiana, still a real oil state, was $6.9 billion, or about 3 percent. Mississippi and Alabama were each about $0.2 billion. Florida was $0.07 billion — a rounding error with a coastline. Add the four states on Isaias’s forecast track and you get about $7.5 billion, or 3 percent of U.S. extraction. If the storm “shuts in the Gulf,” it is shutting in federal offshore barrels and a handful of onshore fields, not the Permian.
Nominal extraction GDP moves with prices as much as with rigs. The national total peaked near $329 billion in 2022, sagged to $104 billion in the 2020 crash, and sat at $252 billion in 2025 — still above the 2010 reading of $189 billion, and still a Texas story. Louisiana’s extraction book has drifted down from $13 billion in 2010 to under $7 billion in 2025. That is not a forecast of what Isaias will do. It is the map of where the oil GDP already lives.
U.S. oil-extraction GDP, 2010–2025

View exact chart values
| year | us_oil_billion | tx_oil_billion | la_oil_billion |
|---|---|---|---|
| 2010 | 189.1 | 97.7 | 13.01 |
| 2011 | 219 | 114.6 | 13.7 |
| 2012 | 224.9 | 123.8 | 12.22 |
| 2013 | 251.8 | 146.8 | 10.73 |
| 2014 | 268.8 | 157.2 | 9.48 |
| 2015 | 151.6 | 88.6 | 5.1 |
| 2016 | 131.1 | 75.6 | 4.51 |
| 2017 | 161.1 | 92 | 5.37 |
| 2018 | 189.2 | 112.6 | 6.32 |
| 2019 | 172.8 | 105.7 | 5.47 |
| 2020 | 104 | 62.4 | 2.86 |
| 2021 | 225.9 | 138.2 | 6.44 |
| 2022 | 329 | 201.5 | 9.49 |
| 2023 | 278.3 | 178 | 8.34 |
| 2024 | 267.8 | 177.8 | 7.4 |
| 2025 | 251.7 | 160.5 | 6.93 |
Where 2025 oil-extraction GDP actually sat

View exact chart values
| state | oil_gdp_billion | share_of_us_oil_pct |
|---|---|---|
| Texas | 160.47 | 63.7 |
| Louisiana | 6.93 | 2.8 |
| Mississippi | 0.24 | 0.1 |
| Alabama | 0.23 | 0.1 |
| Florida | 0.07 | 0 |
The plants that make the diesel
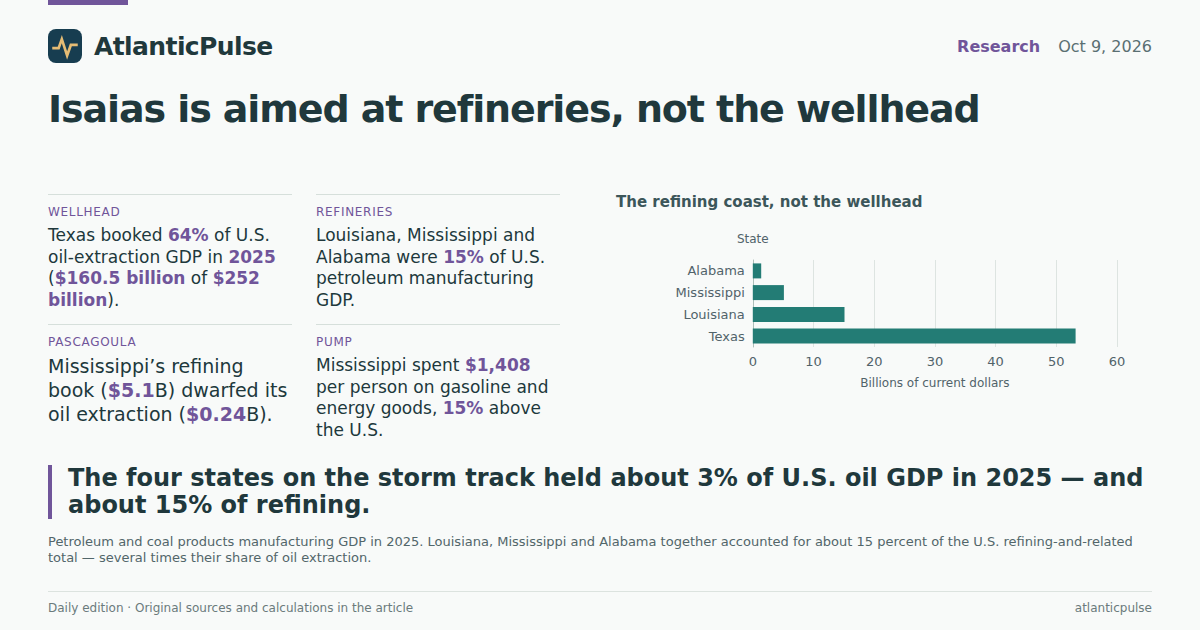
Refining is a different map. Petroleum and coal products manufacturing — the BEA industry that includes the cracking and distillation that turn crude into diesel, gasoline and jet fuel — was a $148 billion U.S. industry in 2025. Texas still led, at $53 billion, or 36 percent. But Louisiana booked $15 billion, about 10 percent of the country. Mississippi, whose extraction GDP is a rounding error, booked $5.1 billion of refining, 3.5 percent of the U.S. total. Alabama added $1.4 billion. Together, Louisiana, Mississippi and Alabama — the stretch of coast that includes Pascagoula and Mobile — accounted for about 15 percent of U.S. petroleum manufacturing GDP, several times their share of extraction.
That is why a Category 3 landfall on the Alabama-Florida line can move the pump even if it never sees a Texas well. Oil extraction plus refining was 7.3 percent of Texas’s $2.93 trillion economy in 2025 and 6.4 percent of Louisiana’s much smaller $342 billion economy. In Mississippi it was 3.3 percent of state GDP, almost all of it refining. In Alabama it was 0.5 percent. The storm’s industrial risk is concentrated in a few plants, not in a statewide oil boom. A long outage is a national fuel-supply event; a miss is a local headache.
The payroll that would actually stand in the rain is not huge. Seasonally adjusted mining-and-logging employment — a broader bucket than oil wells — was 212,400 in Texas in August 2026, down 36,000 from August 2019. Louisiana had 27,400, down about 10,000 from the same month in 2019. Alabama had 9,500; Mississippi 5,800. Florida’s exposure is hospitality: 1.34 million leisure-and-hospitality jobs in August 2026, versus a mining-and-logging series too small for the state to publish on a seasonally adjusted basis. The Panhandle’s human ledger is hotels and kitchens, not derricks.
The refining coast, not the wellhead

View exact chart values
| state | refine_gdp_billion | share_of_us_refine_pct |
|---|---|---|
| Texas | 53.17 | 35.9 |
| Louisiana | 15.1 | 10.2 |
| Mississippi | 5.12 | 3.5 |
| Alabama | 1.38 | 0.9 |
Who already pays more for fuel
The households in the storm’s path were not starting from a cheap gallon. In 2025, Americans spent $390 billion on motor-vehicle fuels, lubricants and fluids. Alabama, Mississippi, Louisiana and Florida together spent $40 billion of that, about 10 percent of the national bill — more than their share of extraction, less than Texas’s share of refining. Florida, with the people, spent $23.5 billion. Alabama spent $6.8 billion, Louisiana $6.1 billion, Mississippi $3.8 billion.
Per person, the inland Gulf looks more exposed than the tourist coast. BEA’s per-capita series for gasoline and other energy goods — a slightly broader basket that also includes fuel oils — was $1,225 in the United States in 2025. Mississippi was $1,408, about 15 percent above the national average. Alabama was $1,371; Louisiana $1,340. Florida was $1,045, about 15 percent below. A few extra cents on diesel is a smaller share of a Miami Beach budget than of a Pascagoula one, even before anyone counts the truck that hauls the groceries.
Those gaps are old. Mississippi, Alabama and Louisiana have sat above the U.S. per-person fuel bill in every year of this series since 2010. The 2022 spike, when the national figure hit $1,541, lifted everyone; the 2020 collapse to $779 pulled everyone down. 2025 was not the peak. It was also not cheap. The White House’s Russian diesel bargain is an attempt to lean on that bill before November. A Gulf refining outage would lean the other way. The official books cannot say which force wins. They can say who was already paying more.
Gulf households already spend more at the pump

View exact chart values
| place | per_capita_usd | vs_us_pct |
|---|---|---|
| Mississippi | 1408 | 14.9 |
| Louisiana | 1340 | 9.4 |
| Alabama | 1371 | 11.9 |
| Florida | 1045 | -14.7 |
| United States | 1225 | 0 |
The fuel bill was already high before this storm

View exact chart values
| year | united_states | mississippi | louisiana | alabama | florida |
|---|---|---|---|---|---|
| 2010 | 1088 | 1356 | 1305 | 1185 | 858 |
| 2011 | 1327 | 1641 | 1592 | 1443 | 1041 |
| 2012 | 1342 | 1657 | 1620 | 1456 | 1084 |
| 2013 | 1331 | 1638 | 1598 | 1452 | 1080 |
| 2014 | 1287 | 1538 | 1506 | 1377 | 1051 |
| 2015 | 991 | 1175 | 1138 | 1053 | 809 |
| 2016 | 885 | 1021 | 1028 | 932 | 717 |
| 2017 | 992 | 1130 | 1134 | 1034 | 813 |
| 2018 | 1116 | 1234 | 1253 | 1143 | 892 |
| 2019 | 1067 | 1151 | 1194 | 1095 | 852 |
| 2020 | 779 | 881 | 845 | 805 | 611 |
| 2021 | 1162 | 1307 | 1262 | 1242 | 928 |
| 2022 | 1541 | 1721 | 1647 | 1661 | 1288 |
| 2023 | 1381 | 1551 | 1505 | 1503 | 1151 |
| 2024 | 1299 | 1442 | 1434 | 1452 | 1085 |
| 2025 | 1225 | 1408 | 1340 | 1371 | 1045 |
What the storm can and cannot do
Put the pieces together and the midterm fuel panic has a geography. America’s oil GDP is a Texas number. America’s refining GDP is a Texas-plus-Louisiana number, with Mississippi punching above its extraction weight. The four states on Isaias’s track held about 3 percent of 2025 oil-extraction GDP and about 15 percent of petroleum manufacturing. Their households spent $40 billion on motor fuels and, except in Florida, more per person than the country as a whole. Mining payrolls in Texas and Louisiana are smaller than they were in 2019. Florida’s leisure payroll is larger.
None of that is a forecast of landfall damage, and none of it is a claim that 300,000 tons of Russian diesel will or will not show up at a U.S. rack. 2025 GDP does not observe a 2026 hurricane. Mining-and-logging jobs are not the same as oil-extraction jobs. Per-capita “gasoline and other energy goods” is not a pump price. Current-dollar oil GDP inflates when crude is expensive. Those are the usual footnotes, and they matter.
What the books do support is a simpler correction to the cable-news map. If Isaias is a national energy story, it is because of a handful of refineries and a federal offshore patch, not because Alabama became Texas. If $6 diesel is a household story in the Gulf, it is because Mississippi and Alabama were already spending more per person on fuel than the rest of the country — a pattern that predates this storm, this war, and this diesel deal. The wellhead can stay open in Midland. The gallon still has to come from a plant that sits in the surge.
Sources and methods
Annual GDP figures are Bureau of Economic Analysis state GDP by industry, current dollars, calendar years 2010–2025, from the September 30, 2026 regional release. Oil-and-gas extraction is NAICS 211. Petroleum and coal products manufacturing is NAICS 324, which is dominated by petroleum refining but also includes some further processing of refined products. Nominal GDP moves with prices as well as volumes; 2022 in particular is a price year.
Household spending is BEA state personal consumption expenditures through 2025. “Motor vehicle fuels, lubricants, and fluids” is the fuels total used for dollar bills. “Gasoline and other energy goods” per capita is a broader basket that also includes fuel oils and other fuels; it is not a pump price and is not a household average derived from the aggregate fuels total.
Jobs are BLS State and Area Employment, seasonally adjusted, through August 2026 (snapshot dated August 24, 2026). Mining and logging is a supersector, not oil extraction alone. Florida does not publish a seasonally adjusted statewide mining-and-logging series in this extract. August comparisons use the same month to limit seasonal mismatch.
2025 is the last complete BEA year in the snapshot. It does not observe Hurricane Isaias or the October 2026 diesel announcement. Shares are descriptive. Missing values were not treated as zero. State GDP figures were not summed to replace the published U.S. total.
Research completed 2026-10-10, for the October 9, 2026 news edition. The available source data may cover earlier periods; see the observation periods and source vintages above.