Research
Iowa’s farm boom is over. The official books have not crashed.
The complaint at the State Fair
At the Iowa State Fair this week, farmers talked about delayed machinery repairs, diesel at $5.37 a gallon, a new plan that paused tariffs on imported ground beef, and a farm bill they say is three years overdue. Aaron Lehman of the Iowa Farmers’ Union called the path “chaos.” Democratic Senate nominee Josh Turek said the word he hears in rural communities is “betrayal.” The Cook Political Report moved Iowa’s open Senate race to a toss-up (MS NOW). Those are political facts about a mood. They are not, by themselves, a measurement of farm income.
The measurement that exists is older, slower, and less cinematic. The U.S. Bureau of Economic Analysis tracks farm proprietors’ income — the net income of sole proprietorships and partnerships that operate farms, not corporate farms — and farm GDP in both current dollars and chained 2017 dollars. If the squeeze is already in the books, it should show up there. If the squeeze is a hangover from a boom, that should show up too. The latest pinned snapshots run through 2024 for farm proprietors’ income, 2025 for farm personal income, and 2026 Q1 for the quarterly series. They do not measure diesel, tariffs, or votes.
A $10 billion year, then half of it gone
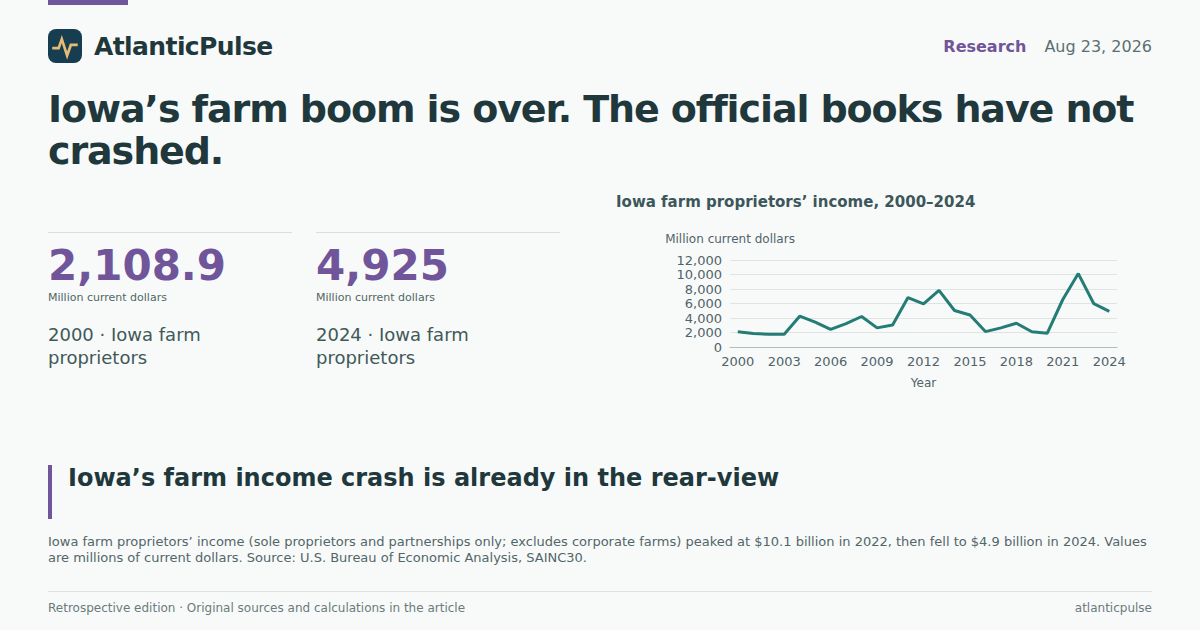
Iowa farm proprietors’ income hit $10.13 billion in 2022, the highest reading in the 2000–2024 annual series. By 2024 it was $4.93 billion, a 51.4 percent drop from that peak. The 2021 figure, $6.55 billion, already looked like a boom. 2022 was something else: Iowa accounted for 9.8 percent of all U.S. farm proprietors’ income that year. In 2024 the share was 7.3 percent.
That is not a gentle mean-reversion. It is also not a collapse to the floor. Iowa’s 2024 total was still above every year from 2016 through 2020, including the ugly 2019–20 stretch when the annual series sat near $2 billion. Farm income is noisy. A single good price year can look like a new normal until it isn’t.
Iowa farm proprietors’ income, 2000–2024

View exact chart values
| year | iowa_farm_prop_mil | us_farm_prop_mil | iowa_share_of_us_pct |
|---|---|---|---|
| 2000 | 2108.9 | 32996 | 6.39 |
| 2001 | 1881 | 34334 | 5.48 |
| 2002 | 1753.6 | 22462 | 7.81 |
| 2003 | 1767.3 | 38523 | 4.59 |
| 2004 | 4246.3 | 53778 | 7.9 |
| 2005 | 3421 | 49894 | 6.86 |
| 2006 | 2439.3 | 33500 | 7.28 |
| 2007 | 3211.6 | 42452 | 7.57 |
| 2008 | 4207.9 | 44676 | 9.42 |
| 2009 | 2638.7 | 32713 | 8.07 |
| 2010 | 3038.2 | 44296 | 6.86 |
| 2011 | 6807.1 | 71280 | 9.55 |
| 2012 | 5953.3 | 65474 | 9.09 |
| 2013 | 7818.1 | 97285 | 8.04 |
| 2014 | 5040.1 | 77570 | 6.5 |
| 2015 | 4416.5 | 62442 | 7.07 |
| 2016 | 2123 | 42435 | 5 |
| 2017 | 2631.8 | 46786 | 5.63 |
| 2018 | 3276 | 37820 | 8.66 |
| 2019 | 2107.9 | 40328 | 5.23 |
| 2020 | 1902.9 | 56804 | 3.35 |
| 2021 | 6547 | 79725 | 8.21 |
| 2022 | 10128 | 103326 | 9.8 |
| 2023 | 5974.1 | 80117 | 7.46 |
| 2024 | 4925 | 67076 | 7.34 |
Iowa fell harder than the country. The Corn Belt did not invent a private recession.
The national series peaked in the same year, 2022, at $103.3 billion, and fell 35.1 percent to $67.1 billion in 2024. Index both series to 2018 and Iowa’s 2022 spike is taller and the 2024 giveback is steeper. The BEA Plains region — Iowa’s neighborhood in the accounts — went from $34.3 billion in 2022 to $17.1 billion in 2024, a 50.1 percent drop, almost the same as Iowa’s.
Among nearby farm states, Minnesota’s farm proprietors’ income fell 69.9 percent from its own 2018–24 peak. Illinois fell 54.2 percent. Nebraska fell 47.8 percent from a 2023 peak. South Dakota fell 41.7 percent. Wisconsin and Kansas were down about 36 percent. California, a different crop mix, posted its highest reading of that window in 2024. Iowa was not uniquely cursed. It was in the middle of a Corn Belt hangover, with a bigger 2022 numerator than most of its neighbors.
Farm proprietors’ income indexed to 2018: Iowa vs. the U.S.

View exact chart values
| year | iowa_index_2018 | us_index_2018 |
|---|---|---|
| 2018 | 100 | 100 |
| 2019 | 64.3 | 106.6 |
| 2020 | 58.1 | 150.2 |
| 2021 | 199.8 | 210.8 |
| 2022 | 309.2 | 273.2 |
| 2023 | 182.4 | 211.8 |
| 2024 | 150.3 | 177.4 |
How far farm proprietors’ income fell from each state’s own recent peak

View exact chart values
| state | pct_change_from_own_peak |
|---|---|
| Minnesota | -69.9 |
| Illinois | -54.2 |
| Iowa | -51.4 |
| Nebraska | -47.8 |
| South Dakota | -41.7 |
| Wisconsin | -36.2 |
| Kansas | -36 |
| California | 0 |
The acres kept producing. The dollars did not.
Farm GDP splits the story. Iowa’s nominal farm GDP — the current-dollar value of crop and animal production — peaked at $18.78 billion in 2022 and was $14.02 billion in 2024, down 25.4 percent. Real farm GDP, in chained 2017 dollars, peaked at $11.19 billion and was $10.29 billion in 2024, down 8.0 percent. Real farm output’s share of Iowa’s real GDP was 5.52 percent in 2022 and 4.99 percent in 2024. The physical farm did not shrink by half. The check did.
A related series, farm personal income, includes hired-labor earnings as well as proprietors and still excludes corporate farms. It peaked at $10.99 billion in 2022, 5.6 percent of Iowa personal income, fell to $6.07 billion in 2024 (2.9 percent), then recovered to $7.88 billion in 2025 (3.6 percent of $221.3 billion in statewide personal income). The 2025 annual bounce is already in that table. It is still 28.3 percent below the 2022 peak. A hangover that heals a little is still a hangover.
Iowa farm GDP: real output held up better than the dollar value

View exact chart values
| year | real_farm_gdp_mil_2017 | nominal_farm_gdp_mil | real_total_gdp_mil_2017 | real_farm_share_pct |
|---|---|---|---|---|
| 2000 | 3634.9 | 2735.6 | 129323.4 | 2.81 |
| 2001 | 3329.8 | 2740.2 | 128077.5 | 2.6 |
| 2002 | 4781.7 | 3591.9 | 131035.2 | 3.65 |
| 2003 | 4385.4 | 3736.6 | 137476.9 | 3.19 |
| 2004 | 6588 | 6634.1 | 149063.2 | 4.42 |
| 2005 | 5632.7 | 4735.8 | 153626.8 | 3.67 |
| 2006 | 5833.5 | 4637.4 | 155704.5 | 3.75 |
| 2007 | 5915.4 | 6319.8 | 162838.1 | 3.63 |
| 2008 | 6871 | 7413.3 | 160469.1 | 4.28 |
| 2009 | 6988.2 | 5646.2 | 156737.2 | 4.46 |
| 2010 | 6317.1 | 5995.8 | 161593.1 | 3.91 |
| 2011 | 7993.7 | 10241.9 | 164559.3 | 4.86 |
| 2012 | 7580.5 | 10033.8 | 170923.7 | 4.44 |
| 2013 | 8510.6 | 12412.2 | 171069.1 | 4.97 |
| 2014 | 7917.4 | 10624.5 | 180309.9 | 4.39 |
| 2015 | 7990.2 | 8667.7 | 185989.2 | 4.3 |
| 2016 | 7852.8 | 7110 | 186729.9 | 4.21 |
| 2017 | 7923.1 | 7923.1 | 187125 | 4.23 |
| 2018 | 8785.9 | 8339.9 | 189245.1 | 4.64 |
| 2019 | 6450.5 | 6020.3 | 188471.4 | 3.42 |
| 2020 | 5291.7 | 4743.9 | 187261.7 | 2.83 |
| 2021 | 10099.7 | 12830.3 | 202470.6 | 4.99 |
| 2022 | 11190.6 | 18782.3 | 202672.5 | 5.52 |
| 2023 | 9437.5 | 13744.8 | 201359.8 | 4.69 |
| 2024 | 10292.5 | 14015.9 | 206438.9 | 4.99 |
The latest quarter is not 2024
The quarterly farm proprietors’ series, expressed as a seasonally adjusted annual rate, is the closest official look at 2026. Iowa peaked at $10.83 billion in 2022 Q3. The series then slid through 2023 and most of 2024. By 2026 Q1 it was $8.13 billion, 24.9 percent below that quarterly peak — and far above the 2024 annual total of $4.93 billion. The worst quarter in the 2015–2026 window was not last year. It was 2020 Q2, at $315 million, a COVID-era hole the boom later papered over.
Real agricultural GDP on the same quarterly calendar tells a calmer story. Iowa’s seasonally adjusted annual rate was $12.35 billion in chained 2017 dollars in 2022 Q3 and $11.47 billion in 2026 Q1. Output wiggled. It did not crater. Anyone treating Fair-week diesel prices as a new income collapse is arguing with a 2022–24 event that the quarterly accounts have already started to reverse, not with a 2026 cliff.
None of this measures what it costs to fill an 8,000-gallon harvest barrel, whether a farm bill arrives, or how a family votes. Proprietors’ income is not a household budget. Corporate farms are missing. The annual proprietor series stops in 2024. Quarterly rates bounce. The political claim on the table is that farm distress could move Iowa. The economic claim the books support is narrower: Iowa’s non-corporate farm income had a once-in-a-generation year in 2022, gave back about half of it by 2024, and by early 2026 was running well above that trough — still short of the boom, and still a thin slice of a $221 billion state income pie.
Iowa farm proprietors’ income, quarterly SAAR

View exact chart values
| period | iowa_saar_mil | us_saar_mil | iowa_index_2018q1 | us_index_2018q1 |
|---|---|---|---|---|
| 2015:Q1 | 4001.4 | 56928.8 | 126.9 | 163.5 |
| 2015:Q2 | 4421.6 | 61462.9 | 140.2 | 176.5 |
| 2015:Q3 | 4765.4 | 66298.2 | 151.2 | 190.4 |
| 2015:Q4 | 4477.7 | 65078.1 | 142 | 186.9 |
| 2016:Q1 | 2433.4 | 45307.9 | 77.2 | 130.1 |
| 2016:Q2 | 2508.1 | 47496.3 | 79.6 | 136.4 |
| 2016:Q3 | 2159.2 | 43167 | 68.5 | 124 |
| 2016:Q4 | 1391.2 | 33768.8 | 44.1 | 97 |
| 2017:Q1 | 3052.8 | 52953.6 | 96.8 | 152.1 |
| 2017:Q2 | 2953 | 50172.8 | 93.7 | 144.1 |
| 2017:Q3 | 2223.1 | 41009.8 | 70.5 | 117.8 |
| 2017:Q4 | 2298.2 | 43007.7 | 72.9 | 123.5 |
| 2018:Q1 | 3152.7 | 34823.8 | 100 | 100 |
| 2018:Q2 | 2795.2 | 38012.2 | 88.7 | 109.2 |
| 2018:Q3 | 2453.9 | 30255.6 | 77.8 | 86.9 |
| 2018:Q4 | 4702.3 | 48188.4 | 149.2 | 138.4 |
| 2019:Q1 | 1795.8 | 36646.9 | 57 | 105.2 |
| 2019:Q2 | 771.2 | 26977 | 24.5 | 77.5 |
| 2019:Q3 | 2902.8 | 47874.6 | 92.1 | 137.5 |
| 2019:Q4 | 2962 | 49813.5 | 94 | 143 |
| 2020:Q1 | 1016.6 | 48987.7 | 32.2 | 140.7 |
| 2020:Q2 | 314.6 | 32641.3 | 10 | 93.7 |
| 2020:Q3 | 1398.6 | 54690.9 | 44.4 | 157.1 |
| 2020:Q4 | 4881.7 | 90896.1 | 154.8 | 261 |
| 2021:Q1 | 3923.2 | 55101.8 | 124.4 | 158.2 |
| 2021:Q2 | 9154.3 | 100263.5 | 290.4 | 287.9 |
| 2021:Q3 | 8465.1 | 93126.9 | 268.5 | 267.4 |
| 2021:Q4 | 4645.3 | 70407.9 | 147.3 | 202.2 |
| 2022:Q1 | 9297.5 | 94783.2 | 294.9 | 272.2 |
| 2022:Q2 | 10779 | 107488.3 | 341.9 | 308.7 |
| 2022:Q3 | 10832.9 | 105217.3 | 343.6 | 302.1 |
| 2022:Q4 | 9602.6 | 105815.2 | 304.6 | 303.9 |
| 2023:Q1 | 7732.1 | 109111.2 | 245.3 | 313.3 |
| 2023:Q2 | 6363.9 | 86288.1 | 201.9 | 247.8 |
| 2023:Q3 | 5811.7 | 71414.6 | 184.3 | 205.1 |
| 2023:Q4 | 3988.7 | 53654.1 | 126.5 | 154.1 |
| 2024:Q1 | 5271.3 | 57875 | 167.2 | 166.2 |
| 2024:Q2 | 4941.4 | 60224.4 | 156.7 | 172.9 |
| 2024:Q3 | 4384.2 | 66315.9 | 139.1 | 190.4 |
| 2024:Q4 | 5103 | 83888.7 | 161.9 | 240.9 |
| 2025:Q1 | 6603.4 | 97047.2 | 209.5 | 278.7 |
| 2025:Q2 | 6433.3 | 91033.8 | 204.1 | 261.4 |
| 2025:Q3 | 7879.4 | 94017.1 | 249.9 | 270 |
| 2025:Q4 | 5823.3 | 72443.7 | 184.7 | 208 |
| 2026:Q1 | 8132.7 | 86217.6 | 258 | 247.6 |
Sources and methods
This is retrospective enrichment using pinned catalogue snapshots, not a reconstruction of what was knowable on the edition date of 2026-08-23. Research retrieval ran on 2026-09-11.
Annual BEA state income and GDP snapshot: product bea_regional_state_annual, release_id bea-regional-state-annual-2026-04-09, snapshot created 2026-08-31T17:17:08Z. Quarterly snapshot: product bea_regional_state_quarterly, release_id bea-regional-state-quarterly-2026-06-25, snapshot created 2026-08-31T17:18:16Z.
Observation windows: farm proprietors’ income (SAINC30) annually 2000–2024 for Iowa and the United States, and 2018–2024 for comparison states; farm personal income and total personal income (SAINC4) annually 2000–2025; real and nominal farm GDP (SAGDP9/SAGDP2, NAICS 111–112) annually 2000–2024 (2025 farm-GDP observations were not present as usable values in the extract); quarterly farm proprietors’ income (SQINC4, seasonally adjusted annual rate) and real agriculture GDP (SQGDP9, NAICS 11, SAAR) 2015 Q1–2026 Q1.
Farm proprietors’ income is the net income of sole proprietorships and partnerships that operate farms and excludes corporate farms. Farm personal income adds hired-labor earnings in crop and animal production and still excludes corporate farm income. Aggregate dollars are not household averages or per-farm averages. Quarterly values are seasonally adjusted annual rates and are not directly the same object as a calendar-year total.
Null observations were skipped, not treated as zero. No duplicate rows required a special rule. Real and nominal GDP were not mixed. Iowa’s share of U.S. farm proprietors’ income uses the same SAINC30 series at state and national geography. Peak-to-latest percent changes use each series’ own maximum in the stated window. Comparison-state peaks are each state’s maximum annual value from 2018 through 2024, not a common year.
The article does not estimate causal effects of tariffs, diesel prices, the farm bill, or election outcomes. Later BEA revisions may alter these vintages.
Research completed 2026-09-11, for the August 23, 2026 news edition. This is retrospective analysis, not a reconstruction of information available that day.