Research
Iowa is arguing about cancer. The official books show a water bill, not a health-care outlier.
The campaign found the tap
Iowa’s midterms have turned the kitchen faucet into a talking point. Democrat Josh Turek, running for Senate, tells cancer patients that “the real issue is the water.” Republican Ashley Hinson says treated tap water meets federal rules. Governor candidates Zach Lahn and Rob Sand both talk nitrates without mandating farm conservation. The Associated Press reported that Iowa has the country’s second-highest rate of newly diagnosed cancers, that Des Moines banned lawn watering last year to spare nitrate-removal plants, and that those plants later ran 193 days straight (AP).
That is a public-health argument. It is not, on its own, a measurement of how large the farm, water or hospital economies already are. The U.S. Bureau of Economic Analysis publishes what households in each state spend on water and sanitation and on health care, and what farms and hospitals produce. Those books cannot say whether nitrates cause cancer — the EPA still does not classify nitrates as a cancer risk, and this catalogue has no incidence or well-test series. They can say whether Iowans already pay an unusual water bill, whether the health-care bill is the outlier the campaign rhetoric implies, and whether the farm economy that is being asked to change is still the giant on the state’s ledger.
The farm year got smaller. The health year did not.
In 2025, Iowa farms produced $13.1 billion of current-dollar GDP, according to BEA’s annual state accounts. That is 4.8 percent of the state’s $272 billion economy — almost the same farm share as in 2015. It is also 30 percent below the 2022 peak of $18.7 billion. Adjusted for prices, farm output in chained 2017 dollars fell 21 percent from that same peak. The bounce after 2020 was real. The hangover is too.
Household health spending did not hang over. Iowans’ personal consumption expenditures on health — the BEA function that covers hospitals, outpatient care and medical products — reached $36.5 billion in 2025. That is 2.8 times farm GDP. The health-care and social-assistance industry itself produced $17.0 billion of GDP, larger than farms even before counting the household bill. Hospital output was $4.4 billion; households spent $15.7 billion on hospital services. Those two hospital numbers are not a contradiction. One is what Iowa hospitals produce. The other is what Iowa residents consume, including care bought across state lines.
Put the three series on one chart and the campaign’s farm-versus-city story looks lopsided in a different way than the stump speech. Farm GDP bounced. Health spending rose in a near-straight line.
Iowa’s health bill kept climbing after the farm peak

View exact chart values
| year | farm_gdp_billions | health_pce_billions | health_gdp_billions | water_pce_billions |
|---|---|---|---|---|
| 2010 | 6 | 19.67 | 9.7 | 0.813 |
| 2011 | 10.24 | 20.4 | 9.95 | 0.837 |
| 2012 | 10.03 | 20.89 | 10.36 | 0.871 |
| 2013 | 12.41 | 21.39 | 10.55 | 0.914 |
| 2014 | 10.62 | 22.4 | 10.9 | 0.969 |
| 2015 | 8.67 | 23.61 | 11.48 | 0.984 |
| 2016 | 7.11 | 24.56 | 12.02 | 1.007 |
| 2017 | 7.92 | 25.02 | 12.32 | 1.074 |
| 2018 | 8.34 | 25.72 | 12.7 | 1.114 |
| 2019 | 6.03 | 27.08 | 13.09 | 1.163 |
| 2020 | 4.75 | 26.43 | 13.02 | 1.247 |
| 2021 | 12.83 | 28.83 | 13.64 | 1.257 |
| 2022 | 18.71 | 30.32 | 14.45 | 1.326 |
| 2023 | 13.69 | 32.17 | 15.31 | 1.369 |
| 2024 | 12.47 | 34.16 | 16.12 | 1.393 |
| 2025 | 13.07 | 36.47 | 16.97 | 1.429 |
Since 2015, the water bill outran real farm output
Index the same books to 2015 and the split is sharper. Household water-and-sanitation spending in Iowa was 45 percent higher in 2025 than in 2015. Household health PCE was 54 percent higher. Per-capita personal income rose 48 percent, to $67,321. Nominal farm GDP was up 51 percent over that decade — but only because 2015 was already a down year. Real farm GDP, the volume measure, was up 19 percent from 2015 and down 21 percent from 2022. The water and health lines did not give the 2022 crop boom a sequel.
None of this is a household average in the survey sense. BEA personal consumption is an aggregate divided, where we show per-person figures, by midyear resident population. It is also current dollars unless labeled real. A fatter water bill can mean more gallons, higher rates, more treatment, or some mix. The official series does not split those pieces. What it does show is that the bill kept growing after the farm peak.
Since 2015, Iowa’s water and health bills outran real farm output

View exact chart values
| year | water_index | health_pce_index | farm_nom_index | farm_real_index | health_gdp_index | pcpi_index | pc_health_index |
|---|---|---|---|---|---|---|---|
| 2015 | 100 | 100 | 100 | 100 | 100 | 100 | 100 |
| 2016 | 102.3 | 104 | 82 | 98.3 | 104.7 | 100.5 | 104 |
| 2017 | 109.1 | 106 | 91.4 | 99.2 | 107.3 | 102.9 | 105.9 |
| 2018 | 113.2 | 108.9 | 96.2 | 108.5 | 110.6 | 107.4 | 108.8 |
| 2019 | 118.2 | 114.7 | 69.5 | 79.2 | 114 | 109.4 | 114.2 |
| 2020 | 126.7 | 111.9 | 54.8 | 64.3 | 113.4 | 116.1 | 108.9 |
| 2021 | 127.7 | 122.1 | 148 | 131.5 | 118.8 | 128.5 | 121.1 |
| 2022 | 134.7 | 128.4 | 215.8 | 151.1 | 125.9 | 135.1 | 127.6 |
| 2023 | 139.1 | 136.3 | 157.9 | 123.6 | 133.3 | 138.1 | 133.7 |
| 2024 | 141.5 | 144.7 | 143.9 | 118.3 | 140.4 | 143 | 141.3 |
| 2025 | 145.2 | 154.4 | 150.8 | 118.8 | 147.8 | 148.3 | 150.4 |
The water bill is the high one
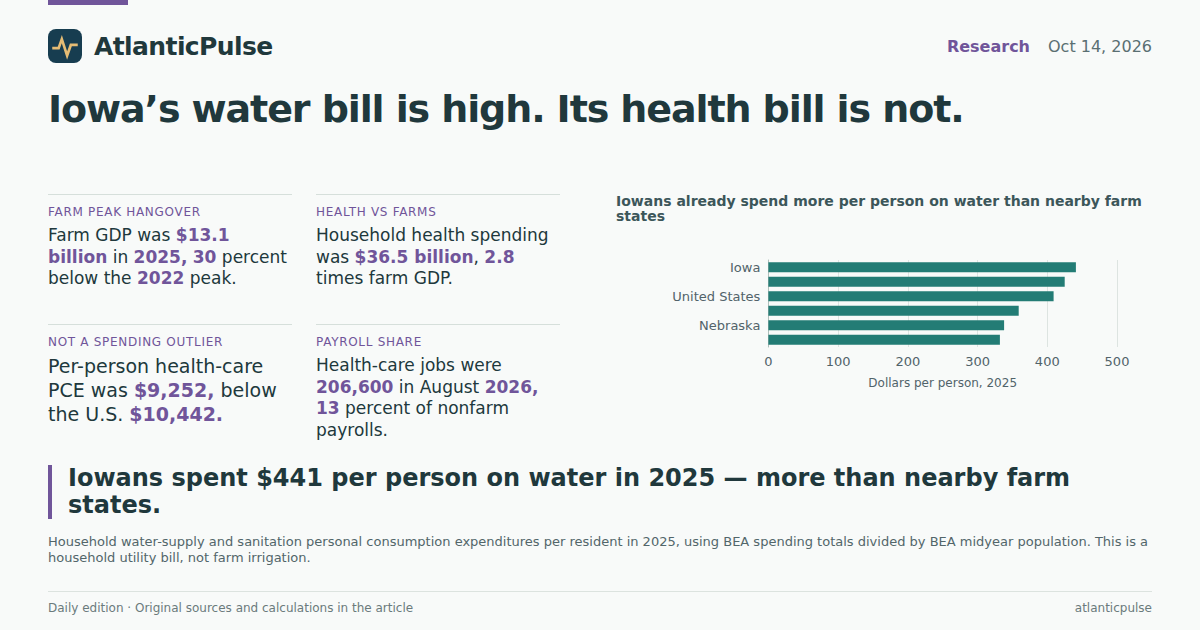
Per resident, Iowa’s household water-and-sanitation spending was $441 in 2025, up from $314 in 2015. That is not a farm irrigation account. It is what BEA books as household utilities: water supply and sanitation. Among Iowa and four nearby farm states — Illinois, Minnesota, Nebraska and Wisconsin — plus the United States, Iowa is the high reading. Illinois is $425. The national figure is $409. Wisconsin, Nebraska and Minnesota sit between $332 and $359.
That ranking will not tell a Des Moines ratepayer why the nitrate plant ran 193 days. It does tell the rest of the country that Iowa’s water argument is not happening in a cheap-utility state. The $1.43 billion statewide water bill is small next to $36.5 billion of health spending. Per person, it is the line that already sticks out.
Iowans already spend more per person on water than nearby farm states

View exact chart values
| state | water_pc_2025 | water_millions_2025 | pop_2025 |
|---|---|---|---|
| Iowa | 441 | 1429.1 | 3238387 |
| Illinois | 425 | 5406.1 | 12719141 |
| United States | 409 | 139773.8 | 341784857 |
| Wisconsin | 359 | 2141.9 | 5972787 |
| Nebraska | 338 | 683 | 2018006 |
| Minnesota | 332 | 1938 | 5830405 |
The health bill is not the outlier the rhetoric needs
If the campaign story were simply “Iowa spends like a cancer state,” the per-person health-care line would be the exhibit. It is the opposite exhibit. BEA’s per-capita health-care series — outpatient services plus hospital and nursing-home services, a narrower category than the function total above — was $9,252 in Iowa in 2025. The United States was $10,442. Minnesota was $11,400. Wisconsin, Nebraska and Illinois were all above $10,600. Iowa is the low reading in that group, not the high one.
Health care was still 18 percent of Iowa’s $51,254 in per-person consumption. The bill has grown: $6,152 in 2015, up 50 percent in a decade, a bit faster than per-capita income. Real per-capita personal income, available through 2024 in chained 2017 dollars, was 22 percent above 2008. Iowans are not skipping the doctor’s office in these books. They are also not, on this measure, the nation’s health-care spendthrifts. A high cancer incidence rate and a low per-person spending figure can sit on the same table. They are not the same fact.
Iowa’s per-person health-care bill is the low one among neighbors

View exact chart values
| state | pc_health_care_2025 |
|---|---|
| Minnesota | 11400 |
| Wisconsin | 10920 |
| Nebraska | 10912 |
| Illinois | 10681 |
| United States | 10442 |
| Iowa | 9252 |
The jobs followed the bill, not the field
The payroll is the same story in a different unit. Iowa health-care and social-assistance employment, seasonally adjusted, was 206,600 in August 2026, 13 percent of the state’s 1.59 million nonfarm jobs, according to the Bureau of Labor Statistics. That is up 10 percent from 187,900 in January 2015. The share has drifted up as total nonfarm employment has stalled near 1.59 million. Farms are mostly not in that nonfarm total. The people who treat Iowans are.
Scatter farm GDP against household health spending, year by year since 2000, and the farm axis is the noisy one. Health spending barely paused in 2020. Farm output collapsed in 2019–20, spiked in 2022, and gave a third of that spike back. Candidates can still argue about mandates, conservation payments and who pays for the nitrate plant. The official books say the household health year is already the large year, the water bill is already the regional outlier, and the farm year is the volatile one — not the one that swallowed the rest of the state.
The farm year got bigger. The health year stayed larger.

View exact chart values
| year | farm_gdp_billions | health_pce_billions |
|---|---|---|
| 2000 | 2.74 | 11.39 |
| 2001 | 2.74 | 12.23 |
| 2002 | 3.59 | 13.14 |
| 2003 | 3.74 | 13.9 |
| 2004 | 6.63 | 14.83 |
| 2005 | 4.74 | 15.68 |
| 2006 | 4.64 | 16.59 |
| 2007 | 6.32 | 17.51 |
| 2008 | 7.41 | 18.29 |
| 2009 | 5.65 | 19.01 |
| 2010 | 6 | 19.67 |
| 2011 | 10.24 | 20.4 |
| 2012 | 10.03 | 20.89 |
| 2013 | 12.41 | 21.39 |
| 2014 | 10.62 | 22.4 |
| 2015 | 8.67 | 23.61 |
| 2016 | 7.11 | 24.56 |
| 2017 | 7.92 | 25.02 |
| 2018 | 8.34 | 25.72 |
| 2019 | 6.03 | 27.08 |
| 2020 | 4.75 | 26.43 |
| 2021 | 12.83 | 28.83 |
| 2022 | 18.71 | 30.32 |
| 2023 | 13.69 | 32.17 |
| 2024 | 12.47 | 34.16 |
| 2025 | 13.07 | 36.47 |
Sources and methods
BEA state personal consumption expenditures are annual current-dollar calendar-year totals from the SAPCE 1997–2025 release dated 30 September 2026. The water series is household water supply and sanitation, not farm irrigation or industrial withdrawals. The health function series includes medical products; the per-capita health-care series is outpatient services plus hospital and nursing-home services only. Those two health concepts are not interchangeable.
BEA annual GDP and income are from the SAGDP/SAINC 30 September 2026 regional release. Farm GDP is NAICS farms (crop and animal production), not forestry or food manufacturing. Health-care GDP is NAICS health care and social assistance. Real farm GDP is millions of chained 2017 dollars and is not additive with other industries. Population is BEA midyear resident population. Per-capita water figures are calculated as water PCE in dollars divided by that population; they are not a survey of household bills.
Real per-capita personal income is from BEA regional price parities, constant 2017 dollars, through 2024 only (SARPI release 19 February 2026). It is not mixed with 2025 current-dollar income in the same sentence without a year label.
Payrolls are BLS CES state and area employment, seasonally adjusted, thousands of jobs, snapshot 24 August 2026, through August 2026. Health care and social assistance is a nonfarm industry; most farm employment is outside that total. Shares use the same month’s statewide nonfarm employment.
No series in this catalogue measures nitrate concentrations, cancer incidence, or drinking-water violations. Comparisons to Illinois, Minnesota, Nebraska and Wisconsin are neighboring farm states named because the Iowa reporting is about agricultural runoff and urban drinking water, not a substitute for missing Iowa data. Descriptive ratios are not causal estimates.
Research completed 2026-10-15, for the October 14, 2026 news edition. The available source data may cover earlier periods; see the observation periods and source vintages above.