Research
Heating oil was already a New England problem. $6 diesel makes it a winter one.
The $6 gallon is new. The heating-oil map is not.
Diesel just did something it had never done in the official pump series: the national average crossed $6 a gallon. AAA put it at $6.06 Friday, up from $5.85 a week earlier and about $3.71 a year ago. Brent crude had spiked to $109 a barrel. California averaged $7.98. The people who do not drive a pickup still live on that fuel. Diesel moves groceries, parcels and farm equipment. It is also, as energy analysts keep repeating this week, practically the same molecule as home heating oil. About five million households still burn heating oil, most of them in the Northeast. Andy Lipow of Lipow Oil Associates told CNN those customers are heading into “quite a sticker shock when they get the first delivery for the season.”
That is a 2026 price story. The last complete official picture of how Americans actually spent money on fuels is older, and it is the picture that matters for understanding who is exposed. The Bureau of Economic Analysis’s state consumer-spending accounts run through calendar 2024, the last full year before the United States and Israel opened the Iran war on February 28, 2026. Those books cannot tell you what a Maine tank fill-up will cost in October. They can tell you, without guesswork, how large fuel oil already was next to gasoline, electricity and natural gas — and how uneven that burden was across states.
Nationally, fuel oil was a rounding error. Motor fuels were not.
In 2024, U.S. households spent $414.3 billion on motor vehicle fuels, lubricants and fluids. That was 2.08 percent of total personal consumption expenditures, which came to $19.9 trillion. Electricity was the next-largest household energy outlay, at $253.4 billion, or 1.27 percent of spending. Natural gas was $63.6 billion (0.32 percent). Fuel oil and other fuels — the heating-oil line — were $26.3 billion, just 0.13 percent of all consumer spending. Add those four lines and household energy was $758 billion, 3.81 percent of PCE.
Those are aggregate dollars, not a typical household’s bill, and they mix two BEA tables: motor fuels and fuel oil are goods purchases; electricity and natural gas are household-utility lines. They still answer a useful question. The thing that just set a pump record is the thing Americans already spent the most on. Fuel oil is a small national total because most of the country does not heat with it. A $6 diesel average can still rearrange a winter in the places that do.
The mix has also been shrinking as a share of the whole economy, even as the dollar totals grew. In 1997, the same four energy lines were 4.95 percent of PCE. They peaked at 6.12 percent in 2008, when motor fuels alone were 3.59 percent of spending. By 2024 motor fuels were back near 2 percent. Electricity’s share drifted down from 1.64 percent in 1997 to 1.27 percent. Fuel oil’s national share has been a thin ribbon throughout: 0.24 percent in 1997, 0.30 percent in 2008, 0.13 percent in 2024. The ribbon is what New England lives on.
U.S. household energy spending as a share of total PCE, 1997–2024

View exact chart values
| year | motor_fuels_bil | fuel_oil_bil | electricity_bil | natural_gas_bil | energy_sum_bil | total_pce_tril | motor_share_pct | fuel_oil_share_pct | electricity_share_pct | gas_share_pct | energy_share_pct | pc_energy_goods_usd | pc_total_pce_usd | ne_fuel_oil_share_pct | us_fuel_oil_share_pct | ne_motor_share_pct | us_motor_share_pct | ne_pc_energy_usd |
|---|---|---|---|---|---|---|---|---|---|---|---|---|---|---|---|---|---|---|
| 1997 | 134.4 | 13.2 | 90.7 | 35.9 | 274.2 | 5.537 | 2.43 | 0.239 | 1.64 | 0.65 | 4.95 | 542 | 20308 | 0.244 | 0.239 | 1.97 | 2.43 | 523 |
| 1998 | 120.8 | 11.6 | 93.4 | 31.7 | 257.4 | 5.877 | 2.06 | 0.197 | 1.59 | 0.54 | 4.38 | 480 | 21306 | 0.2 | 0.197 | 1.64 | 2.06 | 461 |
| 1999 | 134.2 | 12.4 | 93.6 | 32.2 | 272.4 | 6.284 | 2.14 | 0.197 | 1.49 | 0.51 | 4.33 | 525 | 22519 | 0.185 | 0.197 | 1.67 | 2.14 | 492 |
| 2000 | 168.6 | 15.9 | 98.4 | 39.3 | 322.1 | 6.767 | 2.49 | 0.235 | 1.45 | 0.58 | 4.76 | 654 | 23983 | 0.223 | 0.235 | 1.94 | 2.49 | 613 |
| 2001 | 162.5 | 15.5 | 103.4 | 46.2 | 327.6 | 7.074 | 2.3 | 0.219 | 1.46 | 0.65 | 4.63 | 625 | 24823 | 0.213 | 0.219 | 1.82 | 2.3 | 601 |
| 2002 | 153.6 | 14.3 | 107.1 | 38.5 | 313.5 | 7.349 | 2.09 | 0.194 | 1.46 | 0.52 | 4.27 | 584 | 25550 | 0.188 | 0.194 | 1.66 | 2.09 | 566 |
| 2003 | 179 | 17.4 | 111.5 | 48.9 | 356.8 | 7.741 | 2.31 | 0.225 | 1.44 | 0.63 | 4.61 | 677 | 26682 | 0.232 | 0.225 | 1.86 | 2.31 | 674 |
| 2004 | 213.4 | 19.4 | 115.8 | 52.3 | 400.8 | 8.232 | 2.59 | 0.235 | 1.41 | 0.64 | 4.87 | 795 | 28114 | 0.251 | 0.235 | 2.07 | 2.59 | 792 |
| 2005 | 261.4 | 22.3 | 128.5 | 61.3 | 473.6 | 8.769 | 2.98 | 0.255 | 1.47 | 0.7 | 5.4 | 960 | 29674 | 0.29 | 0.255 | 2.34 | 2.98 | 948 |
| 2006 | 295.9 | 23.7 | 140.7 | 60.1 | 520.4 | 9.277 | 3.19 | 0.256 | 1.52 | 0.65 | 5.61 | 1071 | 31092 | 0.288 | 0.256 | 2.5 | 3.19 | 1053 |
| 2007 | 319.9 | 25.6 | 148.3 | 61.9 | 555.7 | 9.747 | 3.28 | 0.263 | 1.52 | 0.63 | 5.7 | 1147 | 32356 | 0.303 | 0.263 | 2.53 | 3.28 | 1105 |
| 2008 | 361 | 30.1 | 155.5 | 68.1 | 614.7 | 10.05 | 3.59 | 0.3 | 1.55 | 0.68 | 6.12 | 1286 | 33049 | 0.352 | 0.3 | 2.76 | 3.59 | 1243 |
| 2009 | 263.8 | 23.2 | 157 | 58.2 | 502.2 | 9.891 | 2.67 | 0.235 | 1.59 | 0.59 | 5.08 | 936 | 32243 | 0.287 | 0.235 | 2.03 | 2.67 | 912 |
| 2010 | 312.1 | 24.6 | 166.8 | 54.6 | 558.1 | 10.26 | 3.04 | 0.24 | 1.63 | 0.53 | 5.44 | 1088 | 33164 | 0.29 | 0.24 | 2.29 | 3.04 | 1044 |
| 2011 | 386.8 | 27 | 166.7 | 52.2 | 632.7 | 10.699 | 3.62 | 0.252 | 1.56 | 0.49 | 5.91 | 1327 | 34309 | 0.308 | 0.252 | 2.67 | 3.62 | 1238 |
| 2012 | 397.8 | 24.1 | 163.2 | 44.4 | 629.6 | 11.047 | 3.6 | 0.218 | 1.48 | 0.4 | 5.7 | 1342 | 35145 | 0.264 | 0.218 | 2.6 | 3.6 | 1211 |
| 2013 | 395.7 | 26 | 169.1 | 50.7 | 641.5 | 11.388 | 3.47 | 0.228 | 1.48 | 0.45 | 5.63 | 1331 | 35956 | 0.272 | 0.228 | 2.54 | 3.47 | 1214 |
| 2014 | 383.1 | 27.8 | 176.1 | 56 | 643 | 11.874 | 3.23 | 0.234 | 1.48 | 0.47 | 5.42 | 1287 | 37194 | 0.284 | 0.234 | 2.39 | 3.23 | 1188 |
| 2015 | 297.4 | 21.4 | 177.6 | 48 | 544.4 | 12.297 | 2.42 | 0.174 | 1.44 | 0.39 | 4.43 | 991 | 38213 | 0.213 | 0.174 | 1.82 | 2.42 | 928 |
| 2016 | 268.6 | 18.4 | 177 | 43.8 | 507.8 | 12.727 | 2.11 | 0.144 | 1.39 | 0.34 | 3.99 | 885 | 39238 | 0.172 | 0.144 | 1.59 | 2.11 | 828 |
| 2017 | 302.5 | 21.5 | 177.7 | 48.2 | 549.9 | 13.291 | 2.28 | 0.162 | 1.34 | 0.36 | 4.14 | 992 | 40693 | 0.191 | 0.162 | 1.74 | 2.28 | 937 |
| 2018 | 341.7 | 25 | 190.7 | 54.7 | 612 | 13.934 | 2.45 | 0.179 | 1.37 | 0.39 | 4.39 | 1116 | 42415 | 0.212 | 0.179 | 1.85 | 2.45 | 1042 |
| 2019 | 328.7 | 23.8 | 187.3 | 54.1 | 593.9 | 14.438 | 2.28 | 0.165 | 1.3 | 0.37 | 4.11 | 1067 | 43720 | 0.197 | 0.165 | 1.71 | 2.28 | 989 |
| 2020 | 238.4 | 20 | 191.6 | 50.5 | 500.6 | 14.231 | 1.68 | 0.141 | 1.35 | 0.35 | 3.52 | 779 | 42920 | 0.171 | 0.141 | 1.25 | 1.68 | 724 |
| 2021 | 361.1 | 24.6 | 200.7 | 59.5 | 645.9 | 16.12 | 2.24 | 0.153 | 1.25 | 0.37 | 4.01 | 1162 | 48539 | 0.177 | 0.153 | 1.64 | 2.24 | 1033 |
| 2022 | 481.7 | 32.9 | 232.9 | 78.8 | 826.3 | 17.69 | 2.72 | 0.186 | 1.32 | 0.45 | 4.67 | 1541 | 52961 | 0.26 | 0.186 | 1.95 | 2.72 | 1360 |
| 2023 | 436.9 | 28 | 236.7 | 66.6 | 768.2 | 18.833 | 2.32 | 0.149 | 1.26 | 0.35 | 4.08 | 1380 | 55917 | 0.201 | 0.149 | 1.65 | 2.32 | 1207 |
| 2024 | 414.3 | 26.3 | 253.4 | 63.6 | 757.6 | 19.896 | 2.08 | 0.132 | 1.27 | 0.32 | 3.81 | 1295 | 58499 | 0.175 | 0.132 | 1.48 | 2.08 | 1126 |
How U.S. household energy spending stacked in 2024

View exact chart values
| category | billion_current_dollars | share_of_pce_pct |
|---|---|---|
| Motor vehicle fuels, lubricants, and fluids | 414.3 | 2.08 |
| Electricity | 253.4 | 1.27 |
| Natural gas | 63.6 | 0.32 |
| Fuel oil and other fuels | 26.3 | 0.132 |
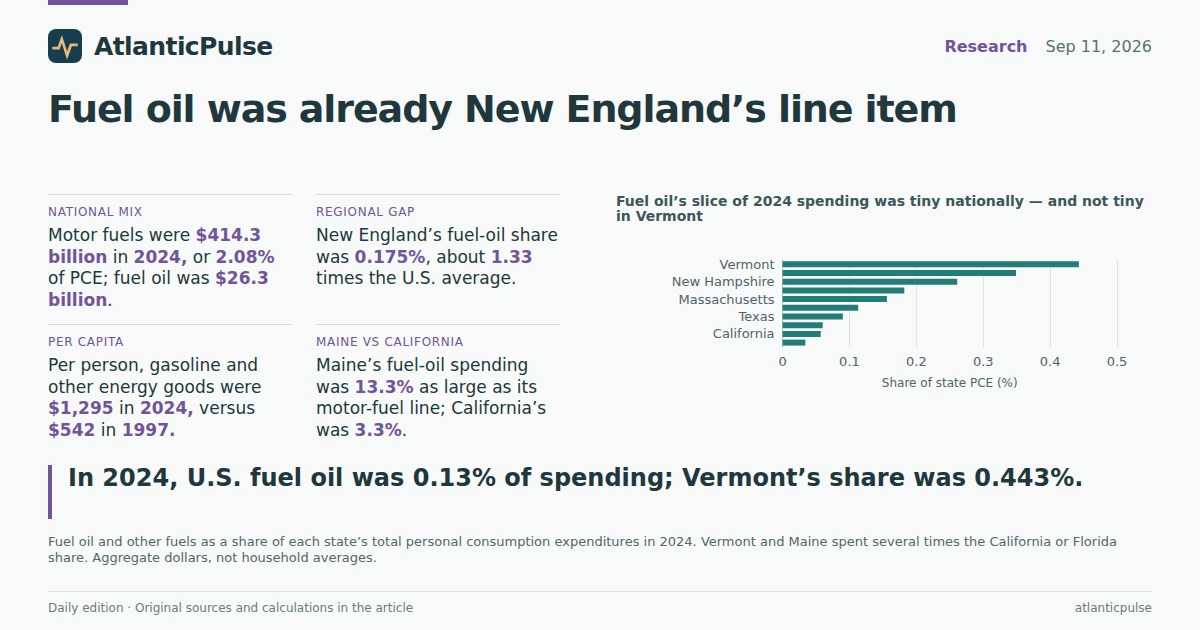
Vermont’s fuel-oil share was about eight times California’s
Look at states and the national rounding error stops being a rounding error. In 2024, fuel oil and other fuels were 0.443 percent of Vermont’s total consumer spending and 0.349 percent of Maine’s. New Hampshire was 0.261 percent. New York, which spent the most in raw dollars — $2.40 billion — was 0.182 percent of a much larger pie. Massachusetts was 0.156 percent. Then the map falls off. Connecticut was 0.113 percent. Texas, $1.51 billion of fuel oil in a $1.69 trillion spending total, was 0.090 percent. Florida was 0.060 percent. California, with almost the same fuel-oil dollars as Texas, was 0.057 percent of a $2.66 trillion spending base. Rhode Island, inside New England, was only 0.034 percent, a reminder that “the Northeast” is not one furnace.
New England as a region spent 0.175 percent of PCE on fuel oil in 2024, about a third more than the U.S. average of 0.132 percent and more than twice the Far West’s 0.073 percent. The regional gap is not new. It widened in expensive years. In 2008, New England’s fuel-oil share was 0.352 percent against 0.300 percent nationally. In 2022, another oil spike, it was 0.260 percent against 0.186 percent. The places TIME’s sources are warning about already devoted a larger slice of spending to the diesel cousin before anyone had heard of a $6 gallon.
Motor fuels still dominate even in Maine. In 2024 Maine spent $2.33 billion on motor vehicle fuels and $309 million on fuel oil — fuel oil was 13.3 percent as large as the gasoline line, versus 6.3 percent nationally and 3.3 percent in California. Maine also spent a larger share of its whole budget at the pump: motor fuels were 2.63 percent of Maine PCE against 1.74 percent in California and 2.08 percent in the United States. A diesel shock hits the truck that brought the groceries and, in a smaller set of states, the tank in the basement.
Fuel oil’s slice of 2024 spending was tiny nationally — and not tiny in Vermont

View exact chart values
| state | fuel_oil_mil | total_pce_bil | fuel_oil_share_pct |
|---|---|---|---|
| Vermont | 179.8 | 40.6 | 0.443 |
| Maine | 309.4 | 88.6 | 0.349 |
| New Hampshire | 253.2 | 97.1 | 0.261 |
| New York | 2403 | 1319.7 | 0.182 |
| Massachusetts | 798.7 | 513.4 | 0.156 |
| Connecticut | 277.7 | 244.9 | 0.113 |
| Texas | 1514 | 1691.6 | 0.09 |
| Florida | 882.7 | 1463.5 | 0.06 |
| California | 1514.2 | 2664.2 | 0.057 |
| Rhode Island | 21.7 | 64.6 | 0.034 |
New England has long spent more of its budget on fuel oil than the U.S. average

View exact chart values
| year | new_england | united_states |
|---|---|---|
| 1997 | 0.244 | 0.239 |
| 1998 | 0.2 | 0.197 |
| 1999 | 0.185 | 0.197 |
| 2000 | 0.223 | 0.235 |
| 2001 | 0.213 | 0.219 |
| 2002 | 0.188 | 0.194 |
| 2003 | 0.232 | 0.225 |
| 2004 | 0.251 | 0.235 |
| 2005 | 0.29 | 0.255 |
| 2006 | 0.288 | 0.256 |
| 2007 | 0.303 | 0.263 |
| 2008 | 0.352 | 0.3 |
| 2009 | 0.287 | 0.235 |
| 2010 | 0.29 | 0.24 |
| 2011 | 0.308 | 0.252 |
| 2012 | 0.264 | 0.218 |
| 2013 | 0.272 | 0.228 |
| 2014 | 0.284 | 0.234 |
| 2015 | 0.213 | 0.174 |
| 2016 | 0.172 | 0.144 |
| 2017 | 0.191 | 0.162 |
| 2018 | 0.212 | 0.179 |
| 2019 | 0.197 | 0.165 |
| 2020 | 0.171 | 0.141 |
| 2021 | 0.177 | 0.153 |
| 2022 | 0.26 | 0.186 |
| 2023 | 0.201 | 0.149 |
| 2024 | 0.175 | 0.132 |
Per person, the energy-goods bill had already doubled since the 1990s
BEA also publishes a per-person series for “gasoline and other energy goods,” which combines motor fuels and fuel oils. In 2024 that was $1,295 per U.S. resident, 2.21 percent of per capita PCE ($58,499). That is not a household average — it is total spending divided by resident population — but it is the cleanest official yardstick for how the pump and the oil truck have moved together. In 1997 the same line was $542. It hit $1,286 in 2008, $1,541 in 2022, then eased to $1,380 in 2023 and $1,295 in 2024. New England’s per-person figure in 2024 was $1,126, a bit below the national number, because the region burns more heating oil but drives fewer gallons.
Motor-fuel spending in current dollars was 26 percent higher in 2024 than in 2019. Fuel oil was up 10.4 percent. Electricity was up 35.3 percent. Those are nominal changes, so they mix prices and quantities; they are not inflation rates. They do show that the pre-war baseline was not a cheap-energy lull. August’s consumer-price report put gasoline 27.4 percent above a year earlier and the energy index 16.3 percent higher, with headline inflation stuck at 3.4 percent while core cooled to 2.4 percent. That is the composition a $6 diesel average is about to feed into — through trucking, through heating oil, and through whatever grocers pass on after a lag.
The honest limit is the calendar. These accounts end in 2024. They do not include the Strait of Hormuz fight, the Houthi advance on Bab al-Mandab, or this week’s pump readings. They also do not say a Vermont household’s bill is 0.44 percent of income; they say fuel oil is 0.44 percent of all consumption in Vermont. Missing is not zero, and a state total is not a furnace. What the books do say, clearly, is that America entered this war with gasoline as the big household fuel line and heating oil as a concentrated Northeast exposure. A record diesel price does not create that map. It lights it up.
Per-person spending on gasoline and other energy goods, 1997–2024

View exact chart values
| year | us_pc_energy_goods_usd | ne_pc_energy_goods_usd |
|---|---|---|
| 1997 | 542 | 523 |
| 1998 | 480 | 461 |
| 1999 | 525 | 492 |
| 2000 | 654 | 613 |
| 2001 | 625 | 601 |
| 2002 | 584 | 566 |
| 2003 | 677 | 674 |
| 2004 | 795 | 792 |
| 2005 | 960 | 948 |
| 2006 | 1071 | 1053 |
| 2007 | 1147 | 1105 |
| 2008 | 1286 | 1243 |
| 2009 | 936 | 912 |
| 2010 | 1088 | 1044 |
| 2011 | 1327 | 1238 |
| 2012 | 1342 | 1211 |
| 2013 | 1331 | 1214 |
| 2014 | 1287 | 1188 |
| 2015 | 991 | 928 |
| 2016 | 885 | 828 |
| 2017 | 992 | 937 |
| 2018 | 1116 | 1042 |
| 2019 | 1067 | 989 |
| 2020 | 779 | 724 |
| 2021 | 1162 | 1033 |
| 2022 | 1541 | 1360 |
| 2023 | 1380 | 1207 |
| 2024 | 1295 | 1126 |
Sources and methods
BEA state personal consumption expenditures, annual calendar years 1997–2024, current dollars, from the SAPCE 2025-09-26 release in a pinned snapshot dated 2026-08-31. Observation years are spending years, not release dates, and are not 2026 pump prices.
Motor vehicle fuels, lubricants, and fluids and fuel oil and other fuels are SAPCE3 goods lines. Electricity and natural gas are SAPCE4 household-utility lines. They were not double-counted. Total PCE is the SAPCE4 all-consumption total. Shares are category dollars divided by the same geography’s total PCE in the same year.
Values are aggregates in millions of current dollars, then scaled to billions or percent. They are not household averages, not quantities of gallons, and not inflation-adjusted. Per capita “gasoline and other energy goods” is BEA’s resident-population denominator for motor fuels plus fuel oils.
State comparisons use 2024 only for Maine, New Hampshire, Vermont, Massachusetts, Connecticut, Rhode Island, New York, California, Texas and Florida, plus the New England and Far West BEA regions. Dictionary presence of other states was not treated as a 2024 observation. Rhode Island’s low fuel-oil share is reported as observed, not averaged away.
Nulls were not treated as zero. No causal claim is made that the Iran war, diesel prices or Houthi advances changed 2024 spending. The 2024 accounts are a pre-war baseline for who was already exposed to fuel oil.
Research completed 2026-09-12, for the September 11, 2026 news edition. The available source data may cover earlier periods; see the observation periods and source vintages above.