Research
Google bought nuclear megawatts. The household bill was already climbing.
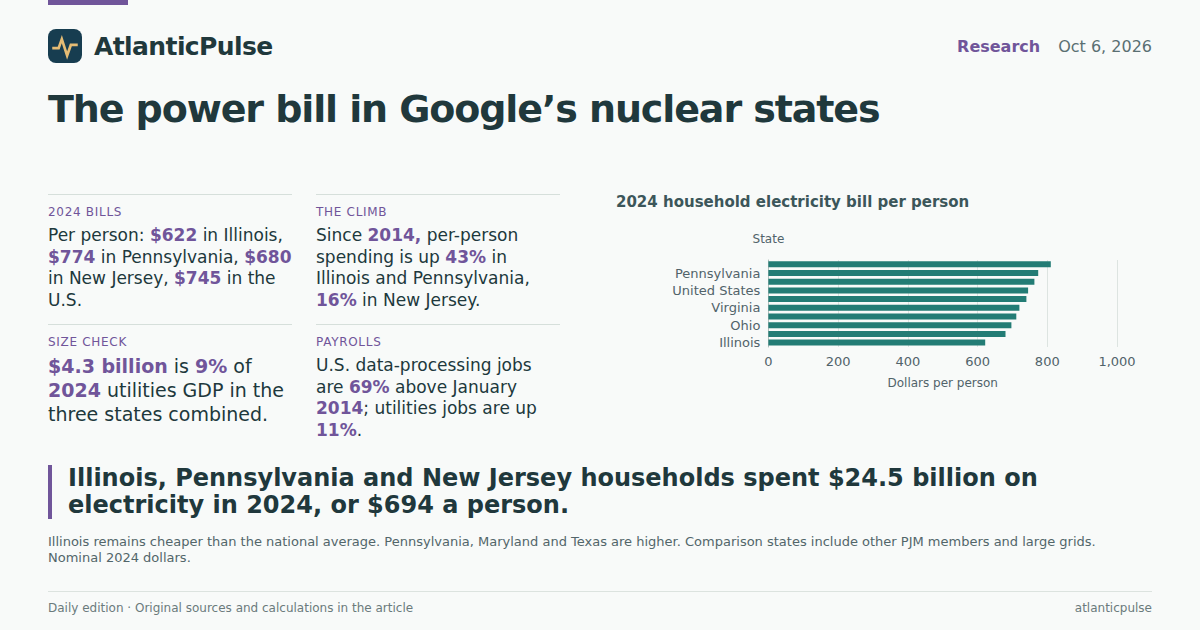
The pledge is about households. The books already have a household number.
Google and Constellation Energy announced a 20-year deal to squeeze 890 megawatts of extra electricity from 11 existing nuclear units in Illinois, Pennsylvania and New Jersey — the output of a large reactor, without pouring a new one. Constellation put more than $4.3 billion of investment against the uprates, plus a 15-year supply contract for another 2,700 megawatts so the plants stay on the PJM grid. The companies framed it as a civic courtesy: new capacity, union jobs, and a model for how a big customer can “bring its own power” so residential rates do not eat the AI boom. The Energy Information Administration, the same day, said U.S. electricity use will set records in 2026 and 2027 as data centres chew through the system, with wholesale prices in PJM forecast to jump 41 percent next year.
That is a promise about households. The official household books are not a forecast. They are a bill. In 2024, the last year of complete Bureau of Economic Analysis state spending data, Americans spent $253.4 billion on household electricity — $745 per person. Illinois, Pennsylvania and New Jersey together spent $24.5 billion, or $694 per person across 35.3 million residents. Illinois was cheaper than the national average, at $622. Pennsylvania was dearer, at $774. New Jersey sat in between, at $680. Those are current dollars of household consumption, not industrial load and not a rate per kilowatt-hour. They are still the closest official answer to the question the companies volunteered to answer: what do households in those three states already pay?
Household electricity spending per person, 2000–2024

View exact chart values
| year | us | illinois | pennsylvania | new_jersey |
|---|---|---|---|---|
| 2000 | 349 | 307 | 329 | 352 |
| 2001 | 363 | 320 | 342 | 366 |
| 2002 | 372 | 324 | 373 | 379 |
| 2003 | 384 | 328 | 372 | 404 |
| 2004 | 395 | 327 | 375 | 427 |
| 2005 | 435 | 359 | 407 | 459 |
| 2006 | 471 | 362 | 417 | 487 |
| 2007 | 492 | 423 | 444 | 540 |
| 2008 | 511 | 425 | 472 | 581 |
| 2009 | 512 | 419 | 471 | 583 |
| 2010 | 539 | 455 | 517 | 629 |
| 2011 | 535 | 452 | 536 | 605 |
| 2012 | 519 | 439 | 515 | 576 |
| 2013 | 534 | 424 | 529 | 602 |
| 2014 | 552 | 435 | 542 | 584 |
| 2015 | 552 | 450 | 560 | 574 |
| 2016 | 546 | 463 | 548 | 560 |
| 2017 | 544 | 456 | 547 | 548 |
| 2018 | 580 | 495 | 589 | 569 |
| 2019 | 567 | 479 | 563 | 559 |
| 2020 | 578 | 492 | 563 | 577 |
| 2021 | 604 | 509 | 567 | 616 |
| 2022 | 697 | 597 | 691 | 683 |
| 2023 | 703 | 593 | 717 | 658 |
| 2024 | 745 | 622 | 774 | 680 |
2024 household electricity bill per person

View exact chart values
| state | dollars_per_person | total_millions | population | change_vs_2014_pct |
|---|---|---|---|---|
| Illinois | 622 | 7904.6 | 12703033 | 43 |
| New Jersey | 680 | 6460.9 | 9506354 | 16.3 |
| Ohio | 697 | 8266.2 | 11860621 | 31 |
| California | 711 | 27998.2 | 39364774 | 83.3 |
| Virginia | 720 | 6349.8 | 8819642 | 19.5 |
| New York | 740 | 14800.6 | 20001419 | 34 |
| United States | 745 | 253432.5 | 340003797 | 35.1 |
| Maryland | 763 | 4763.1 | 6245314 | 17.7 |
| Pennsylvania | 774 | 10094.6 | 13045848 | 42.6 |
| Texas | 810 | 25377 | 31318578 | 31.2 |
The climb is not evenly shared
Per-person household electricity spending in the United States rose from $349 in 2000 to $552 in 2014 and $745 in 2024. Illinois started cheaper and stayed cheaper, but it did not stay still: $307, then $435, then $622. Pennsylvania tracked the country more closely and then overtook it. New Jersey was the expensive one in the early 2010s — $629 per person in 2010 — and then the bill actually eased for several years before the 2022 spike.
Index the same series at 2014 and the split is clearer. By 2024, Illinois was 43 percent above its 2014 per-person level and Pennsylvania 43 percent above. The United States was 35 percent above. New Jersey was only 16 percent above. Every series jumps in 2022, which is what a nominal series does when fuel and wholesale power reprice. The useful point is not that Google caused the 2022 spike. It did not. The useful point is that two of the three states hosting the uprates have already seen household electricity outlays rise faster than the national average over the decade in which data-centre load became a political argument.
Electricity is still a thin slice of the household budget. It was 1.45 percent of U.S. personal consumption in 2000 and 1.27 percent in 2024. Illinois and New Jersey were 1.03 percent; Pennsylvania 1.30 percent. The share fell because other spending grew faster, not because the electricity line item shrank. U.S. household electricity outlays rose 158 percent from 2000 to 2024; total consumption rose 194 percent. In Illinois the electricity line grew 107 percent against 147 percent for all spending. That is cold comfort at the kitchen table. It is a reminder that a “small share” can still be a large cheque.
Electricity bills since 2014, indexed

View exact chart values
| year | us | illinois | pennsylvania | new_jersey |
|---|---|---|---|---|
| 2014 | 100 | 100 | 100 | 100 |
| 2015 | 100 | 103.3 | 103.3 | 98.3 |
| 2016 | 98.9 | 106.4 | 101.1 | 95.9 |
| 2017 | 98.6 | 104.8 | 100.8 | 93.7 |
| 2018 | 105.2 | 113.7 | 108.5 | 97.5 |
| 2019 | 102.8 | 110 | 103.8 | 95.7 |
| 2020 | 104.7 | 113.1 | 103.8 | 98.7 |
| 2021 | 109.5 | 116.9 | 104.6 | 105.5 |
| 2022 | 126.4 | 137.3 | 127.4 | 116.9 |
| 2023 | 127.4 | 136.2 | 132.1 | 112.6 |
| 2024 | 135.1 | 143 | 142.6 | 116.3 |
Four billion dollars is not a rounding error on these utilities books
Constellation’s $4.3 billion is private capital going into plants that already exist. Measured against the utilities industry already on the state GDP books for 2024, it is not a rounding error. Illinois utilities produced $20.8 billion of output; Pennsylvania $15.2 billion; New Jersey $11.9 billion. The three together: $47.9 billion. The announced investment is 9 percent of that combined utilities GDP, 21 percent of Illinois’s, 28 percent of Pennsylvania’s and 36 percent of New Jersey’s. Those ratios do not mean the money is a tax, a rate increase, or a year of revenue. They mean the cheque is large relative to the industry that will book the work.
The other side of the deal has grown much faster. Data processing, hosting and related information services — a BEA grouping that includes internet access and search as well as hosting — produced $14.3 billion of GDP in Illinois in 2024, $8.6 billion in Pennsylvania and $15.0 billion in New Jersey. New Jersey’s data-processing sector is already larger than its utilities industry. Since 2000, that sector’s output is up more than fourteenfold in Illinois and New Jersey and more than sevenfold in Pennsylvania, against roughly a doubling of utilities output. The companies that need round-the-clock power have been a bigger growth story, on these books, than the companies that make it.
Utilities versus data-processing output, 2024

View exact chart values
| state | utilities_gdp_millions | data_processing_gdp_millions | deal_vs_utilities_pct | utilities_growth_2000_pct | dataproc_growth_2000_pct |
|---|---|---|---|---|---|
| Illinois | 20789.8 | 14294.5 | 20.7 | 109.7 | 1475.7 |
| Pennsylvania | 15204.6 | 8568.5 | 28.3 | 84 | 666 |
| New Jersey | 11944 | 15047.7 | 36 | 96.5 | 1539.7 |
The payrolls tell the same lopsided story
National job counts cannot locate a turbine in Morris, Illinois. They can show whether the country has been staffing the grid or the cloud. In July 2026, U.S. utilities employment was 608,100, seasonally adjusted — almost exactly where it stood in January 2000 (606,000) and 11 percent above January 2014. Data-processing and hosting employment was 463,500, up 69 percent from 275,000 in January 2014, though off the 2023 peak. Electric power generation employment was 162,100 in June 2026, barely changed from 161,400 in January 2014. The industry that would actually run the extra megawatts has not been on a hiring spree. The industry that would buy them has.
None of that proves the Google contract will hold household rates down, or that it will fail. Household electricity spending is not the same as a residential tariff, and commercial AI load does not appear in these PCE totals. The 890 megawatts cannot be translated, from these series, into a number of homes or a number of cents per kilowatt-hour. What the books do show is more modest and more useful. The three states being asked to host the uprates already send $24.5 billion a year through the household electricity line. Two of them have seen that per-person bill rise faster than the country’s since 2014. The utilities industry on their GDP books is tens of billions of dollars, not hundreds. The data-processing industry on the same books has grown much faster. A deal that “protects ratepayers” is arriving after the household bill has already climbed, and into a labour market that has added cloud jobs much faster than power-plant jobs. That is the official backdrop. The first extra megawatts are not due until 2028.
U.S. utilities jobs versus data-processing jobs

View exact chart values
| year | utilities_thousands | data_processing_thousands | electric_generation_thousands |
|---|---|---|---|
| 2000 | 606 | 313.1 | 197.5 |
| 2001 | 599.9 | 318.9 | 196 |
| 2002 | 599.2 | 311.3 | 194.2 |
| 2003 | 586.2 | 290 | 183.1 |
| 2004 | 569.8 | 269.7 | 176 |
| 2005 | 557.5 | 265.4 | 171.4 |
| 2006 | 549.9 | 262.6 | 167.1 |
| 2007 | 548.5 | 264 | 165.1 |
| 2008 | 556.8 | 265.9 | 165.8 |
| 2009 | 563.4 | 252.1 | 168.5 |
| 2010 | 556.1 | 244.5 | 169.9 |
| 2011 | 551.5 | 242.8 | 168.5 |
| 2012 | 553.2 | 247.9 | 165.7 |
| 2013 | 551.7 | 264.1 | 165.1 |
| 2014 | 549.1 | 275 | 161.4 |
| 2015 | 554.5 | 291.2 | 158.7 |
| 2016 | 555.9 | 295.8 | 159.8 |
| 2017 | 556.7 | 314.6 | 158.1 |
| 2018 | 553.7 | 325 | 154.6 |
| 2019 | 551.3 | 330.9 | 149.3 |
| 2020 | 547 | 364.1 | 143.5 |
| 2021 | 542.5 | 366.5 | 141 |
| 2022 | 550.4 | 441 | 141.7 |
| 2023 | 567.9 | 484.8 | 148.4 |
| 2024 | 586.4 | 483.5 | 155.9 |
| 2025 | 597 | 481.3 | 157.1 |
| 2026 | 604.7 | 467.5 | 161.4 |
Sources and methods
Household electricity is BEA state personal consumption expenditures, SAPCE table 3, “Electricity” under household utilities, millions of current dollars, calendar years 2000–2024, release bea-sapce-2025-09-26. Per-person figures divide that total by BEA SAINC1 population (persons) for the same year. These are household outlays, not industrial or data-centre consumption, not tariffs, and not inflation-adjusted.
Total PCE for spending shares is SAPCE table 4, personal consumption expenditures, millions of current dollars. Shares are electricity divided by total PCE, not a household average bill.
State GDP for utilities (NAICS 22) and data processing, hosting, and other information services (NAICS 518–519) is BEA SAGDP2, millions of current dollars. The 2024 values are used; the 2026-04-09 regional release also contains 2025. NAICS 518–519 includes internet access and search as well as hosting; it is broader than data centres alone. The $4.3 billion Constellation figure is from the companies’ 6 October 2026 announcement and is compared with 2024 GDP only as a size ratio, not as a cost pass-through.
Employment is BLS Current Employment Statistics, seasonally adjusted, national: utilities (CES4422000001), computing infrastructure providers, data processing, web hosting, and related services (CES5051800001), and electric power generation (CES4422111001). The history chart uses January of each year through 2026. Latest levels cited in prose are July 2026 for utilities and data processing and June 2026 for electric power generation, from the 24 August 2026 CES snapshot. State utilities payrolls were requested from SAE but the monthly extract returned no observations.
No series in the pinned catalogue measures nuclear generation, PJM wholesale prices, or residential cents per kWh. 890 megawatts is not converted into households or rate impacts. Descriptive comparisons are not causal effects. Provider lag is normal: PCE ends in 2024, GDP in 2024 for the figures used here, jobs in mid-2026.
Research completed 2026-10-07, for the October 6, 2026 news edition. The available source data may cover earlier periods; see the observation periods and source vintages above.