Research
Forty trillion is a round number. The ratio is the story.
A round number, two different ledgers
On 20 August 2026 the Treasury's debt clock tripped over another psychologically satisfying zero: U.S. federal debt surpassed $40 trillion. The figure had been $39 trillion in March and $38 trillion the previous October. In January 2017, at the start of Donald Trump's first term, it was $19.95 trillion. Round numbers make for alarming headlines. They are a poor way to judge whether a government is living beyond its means.
The more useful question is how large the public sector's debts are relative to the economy that has to service them, and whether the annual gap between spending and revenue is still feeding the pile. Those are questions the IMF World Economic Outlook is built to answer. In the WEO snapshot used here, U.S. general-government gross debt — federal, state and local, on the Fund's accounting — was 123.9 percent of GDP in 2025, or about $38.1 trillion against $30.8 trillion of GDP. The 2026 WEO projection is $40.7 trillion, or 125.8 percent of GDP. The federal $40 trillion headline and the IMF stock are in the same neighbourhood. They are not the same series, and treating them as identical would be a category error.
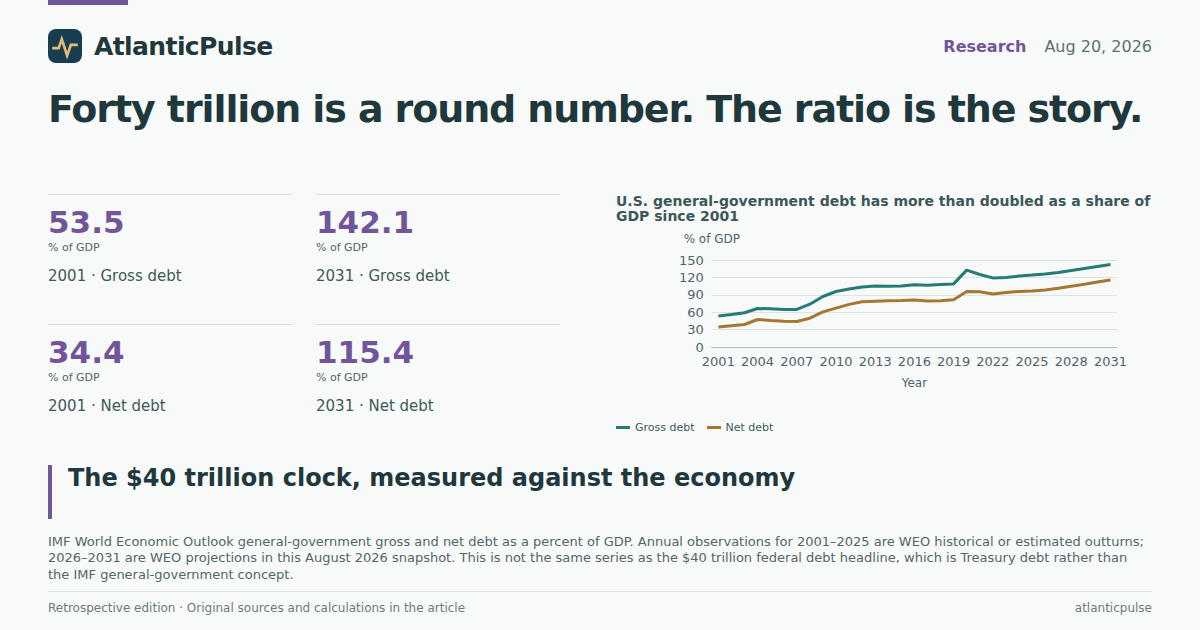
Net debt, which subtracts financial assets, was 96.7 percent of GDP in 2025. That is still nearly triple the 34.4 percent recorded in 2001. The ratio, not the ticker, is what tells you whether $40 trillion is a curiosity of inflation and a bigger economy or a genuine fiscal thickening.
U.S. general-government debt has more than doubled as a share of GDP since 2001

View exact chart values
| year | gross_debt_pct_gdp | net_debt_pct_gdp |
|---|---|---|
| 2001 | 53.5 | 34.4 |
| 2002 | 55.9 | 36.7 |
| 2003 | 59 | 38.8 |
| 2004 | 66.4 | 47.4 |
| 2005 | 65.8 | 45.9 |
| 2006 | 64.5 | 44.4 |
| 2007 | 64.9 | 44 |
| 2008 | 73.8 | 49.7 |
| 2009 | 87.1 | 60.6 |
| 2010 | 95.7 | 67 |
| 2011 | 100 | 73.5 |
| 2012 | 103.7 | 77.9 |
| 2013 | 105 | 78.8 |
| 2014 | 104.9 | 79.7 |
| 2015 | 105.4 | 80 |
| 2016 | 107.4 | 81 |
| 2017 | 106.4 | 79.2 |
| 2018 | 107.7 | 79.9 |
| 2019 | 108.8 | 81.6 |
| 2020 | 132.6 | 95.9 |
| 2021 | 125 | 95.2 |
| 2022 | 119.1 | 91.3 |
| 2023 | 120 | 94 |
| 2024 | 122.3 | 95.7 |
| 2025 | 123.9 | 96.7 |
| 2026 | 125.8 | 98.5 |
| 2027 | 128.6 | 101.3 |
| 2028 | 132.1 | 104.8 |
| 2029 | 135.5 | 108.3 |
| 2030 | 138.9 | 111.9 |
| 2031 | 142.1 | 115.4 |
How the ratio got here
In 2001, U.S. general-government gross debt was 53.5 percent of GDP. It stepped up through the 2000s, jumped in the financial crisis, and crossed 100 percent of GDP in 2011. By 2017 it was 106.4 percent, with a general-government stock of about $20.9 trillion. Then came Covid. The ratio spiked to 132.6 percent of GDP in 2020 as the overall deficit hit 14.1 percent of GDP. A burst of inflation and nominal growth pulled the ratio back to 119.1 percent in 2022. It has been climbing again: 122.3 percent in 2024 and 123.9 percent in 2025.
That last stretch matters for the political argument now being made in Washington. Treasury Secretary Scott Bessent has said there is nothing magic about $40 trillion and that the United States can grow its way out. Real GDP growth in the 2025 WEO outturn was 2.1 percent. The debt ratio still rose. The Fund's projections in this snapshot do not show a descent: 125.8 percent in 2026 and 142.1 percent by 2031, with the general-government stock reaching about $55.5 trillion against $39 trillion of GDP. Growing the denominator helps. It has not, in this vintage, been enough to shrink the ratio.
From 2001 to 2025 the United States added 70.4 percentage points of GDP to its gross-debt ratio. Among the twelve economies compared here, only Japan (+79.7 points) and China (+75.0 points) added more. The United Kingdom added 67.5 points. Germany added 4.9. The American increase is not unique. It is among the largest.
The gap that keeps feeding the pile
Debt stocks are the memory of old deficits. The flow is still red. In 2025 the WEO overall balance — general-government net lending/borrowing — was minus 6.8 percent of GDP. That is narrower than the 14.1 percent Covid hole and the 13.2 percent of 2009, and a little narrower than 2023–24 (both minus 7.9 percent). It is wider than 2019 (minus 5.8 percent). The United States did not return to a pre-pandemic deficit. It settled at a larger one.
The primary balance, which excludes interest (IMF series GGXONLB_NGDP), was still minus 3.2 percent of GDP in 2025. Subtracting the overall balance from the primary balance leaves an implied interest residual of 3.7 percent of GDP, up from about 2 percent through 2021 and 2.3 percent in 2019. That residual is not a published interest bill, and it should not be quoted as one. It is the gap between the two IMF balances, and it has been widening as the debt stock and market yields have both risen — the same pressure that sent the Treasury into larger long-bond buybacks this week.
The composition is stubborn. General-government revenue was 30.9 percent of GDP in 2025; expenditure was 37.7 percent. Revenue is roughly where it was in the mid-2000s. Spending stepped up in the financial crisis, stepped up again in 2020, and has not come all the way back. The WEO projections in this snapshot keep expenditure near 38 percent of GDP through 2031, with revenue stuck around 30 to 31 percent. If those paths hold, the deficit does not close. It becomes furniture.
The deficit never really closed — and the interest residual is climbing

View exact chart values
| year | overall_balance_pct_gdp | status | primary_balance_pct_gdp | implied_interest_pct_gdp |
|---|---|---|---|---|
| 2001 | -0.5 | historical_or_estimate | 1.8 | 2.3 |
| 2002 | -3.8 | historical_or_estimate | -1.7 | 2.1 |
| 2003 | -4.8 | historical_or_estimate | -2.8 | 2 |
| 2004 | -4.2 | historical_or_estimate | -2.4 | 1.9 |
| 2005 | -3.1 | historical_or_estimate | -1.1 | 2 |
| 2006 | -2 | historical_or_estimate | -0.1 | 2 |
| 2007 | -2.9 | historical_or_estimate | -0.8 | 2.1 |
| 2008 | -6.6 | historical_or_estimate | -4.6 | 2 |
| 2009 | -13.2 | historical_or_estimate | -11.3 | 1.9 |
| 2010 | -11 | historical_or_estimate | -9 | 2 |
| 2011 | -9.7 | historical_or_estimate | -7.4 | 2.3 |
| 2012 | -8.1 | historical_or_estimate | -5.9 | 2.2 |
| 2013 | -4.6 | historical_or_estimate | -2.6 | 2 |
| 2014 | -4 | historical_or_estimate | -2.1 | 2 |
| 2015 | -3.5 | historical_or_estimate | -1.7 | 1.8 |
| 2016 | -4.4 | historical_or_estimate | -2.4 | 2 |
| 2017 | -4.8 | historical_or_estimate | -2.8 | 2 |
| 2018 | -5.3 | historical_or_estimate | -3.1 | 2.2 |
| 2019 | -5.8 | historical_or_estimate | -3.5 | 2.3 |
| 2020 | -14.1 | historical_or_estimate | -12.1 | 2 |
| 2021 | -11.5 | historical_or_estimate | -9.2 | 2.3 |
| 2022 | -3.7 | historical_or_estimate | -1 | 2.7 |
| 2023 | -7.9 | historical_or_estimate | -4.8 | 3.1 |
| 2024 | -7.9 | historical_or_estimate | -4.4 | 3.5 |
| 2025 | -6.8 | historical_or_estimate | -3.2 | 3.7 |
| 2026 | -7.5 | projection | -3.7 | 3.8 |
| 2027 | -7.4 | projection | -3.5 | 3.9 |
| 2028 | -7.6 | projection | -3.7 | 3.9 |
| 2029 | -7.5 | projection | -3.4 | 4.1 |
| 2030 | -7.5 | projection | -3.3 | 4.2 |
| 2031 | -7.4 | projection | -3.1 | 4.3 |
Spending settled higher after Covid; revenue did not catch up

View exact chart values
| year | revenue_pct_gdp | expenditure_pct_gdp | gap_pct_gdp | status |
|---|---|---|---|---|
| 2001 | 32.3 | 32.8 | 0.5 | historical_or_estimate |
| 2002 | 29.9 | 33.7 | 3.8 | historical_or_estimate |
| 2003 | 29.3 | 34 | 4.8 | historical_or_estimate |
| 2004 | 29.5 | 33.7 | 4.2 | historical_or_estimate |
| 2005 | 30.9 | 33.9 | 3.1 | historical_or_estimate |
| 2006 | 31.7 | 33.7 | 2 | historical_or_estimate |
| 2007 | 31.6 | 34.6 | 2.9 | historical_or_estimate |
| 2008 | 30.5 | 37.1 | 6.6 | historical_or_estimate |
| 2009 | 28.2 | 41.4 | 13.2 | historical_or_estimate |
| 2010 | 28.8 | 39.8 | 11 | historical_or_estimate |
| 2011 | 29.1 | 38.8 | 9.7 | historical_or_estimate |
| 2012 | 29.1 | 37.2 | 8.1 | historical_or_estimate |
| 2013 | 31.2 | 35.8 | 4.6 | historical_or_estimate |
| 2014 | 31.3 | 35.3 | 4 | historical_or_estimate |
| 2015 | 31.5 | 35 | 3.5 | historical_or_estimate |
| 2016 | 31 | 35.3 | 4.4 | historical_or_estimate |
| 2017 | 30.4 | 35.2 | 4.8 | historical_or_estimate |
| 2018 | 30 | 35.3 | 5.3 | historical_or_estimate |
| 2019 | 30 | 35.8 | 5.8 | historical_or_estimate |
| 2020 | 30.6 | 44.7 | 14.1 | historical_or_estimate |
| 2021 | 31.8 | 43.2 | 11.5 | historical_or_estimate |
| 2022 | 33.1 | 36.8 | 3.7 | historical_or_estimate |
| 2023 | 29.6 | 37.5 | 7.9 | historical_or_estimate |
| 2024 | 29.9 | 37.7 | 7.9 | historical_or_estimate |
| 2025 | 30.9 | 37.7 | 6.8 | historical_or_estimate |
| 2026 | 30.4 | 37.9 | 7.5 | projection |
| 2027 | 30.5 | 37.9 | 7.4 | projection |
| 2028 | 30.4 | 38 | 7.6 | projection |
| 2029 | 30.4 | 37.8 | 7.5 | projection |
| 2030 | 30.6 | 38.1 | 7.5 | projection |
| 2031 | 30.8 | 38.1 | 7.4 | projection |
Indebted, but not uniquely so — and looser than Japan
Place the 2025 ratio next to other large economies and the American scare story changes shape. Japan remains in a league of its own at 206.5 percent of GDP. Greece is at 145.7 percent, Italy at 137.1 percent. The United States, at 123.9 percent, ranks fourth in this twelve-country set, ahead of France (116.0), Canada (113.5) and the United Kingdom (102.3), and far above Germany (62.9), South Korea (52.3) and Australia (51.0). China, on the WEO general-government measure, is 99.2 percent. The United States is highly indebted. It is not the most indebted.
The flow comparison is less flattering. In 2025 Japan's overall balance was minus 1.1 percent of GDP — a small deficit against a huge stock. Germany was minus 2.7 percent, France minus 5.1 percent, the United Kingdom minus 5.4 percent. The United States, at minus 6.8 percent, was running the widest deficit in that five-country group. High Japanese debt is, in the WEO accounts, a legacy. High American debt is still being topped up.
That is the distinction the $40 trillion headline buries. A country can carry a large stock if the annual gap is small and creditors believe the politics will keep it small. It can also run a moderate stock into trouble by refusing to close the gap. On the 2025 WEO numbers, the United States looks more like the second case than the first. Bessent's bond-market interventions can change the price of a year's borrowing. They cannot, by themselves, change this arithmetic.
America is highly indebted — but not the most indebted large economy

View exact chart values
| country | gross_debt_pct_gdp |
|---|---|
| Japan | 206.5 |
| Greece | 145.7 |
| Italy | 137.1 |
| United States | 123.9 |
| France | 116 |
| Canada | 113.5 |
| United Kingdom | 102.3 |
| Spain | 100.4 |
| China | 99.2 |
| Germany | 62.9 |
| South Korea | 52.3 |
| Australia | 51 |
Japan is more indebted; America is running a wider deficit

View exact chart values
| country | gross_debt_pct_gdp | overall_balance_pct_gdp |
|---|---|---|
| United States | 123.9 | -6.8 |
| Japan | 206.5 | -1.1 |
| United Kingdom | 102.3 | -5.4 |
| Germany | 62.9 | -2.7 |
| France | 116 | -5.1 |
What $40 trillion should mean to a reader
Three cautions belong next to these findings. First, the federal debt that crossed $40 trillion includes securities held by government trust funds; the IMF general-government figures use a different perimeter and can sit several trillion dollars away from the Treasury ticker in any given year. Second, 2025 in this WEO vintage is an estimated outturn, and 2026–2031 are projections that will move when growth, inflation, war spending and tax law move. Third, a debt-to-GDP ratio is not a household credit score. The United States issues the world's reserve currency, and Japan shows that very high ratios can persist for a long time.
What the accounts do show is simpler than a solvency panic and more uncomfortable than a shrug. Relative to GDP, U.S. public debt is more than twice as large as in 2001 and higher than in 2017. The deficit is still about 7 percent of GDP. The implied interest residual has risen. Peers with even larger stocks are running smaller gaps. Growing out of $40 trillion would require the economy to outrun the deficit for years. In this vintage, it is not doing so.
The round number is a news event. The ratio, the gap, and the comparison are the briefing. If Washington wants the ticker to stop making news, it has to change one of those three — not the number of zeros on the clock.
Sources and methods
This is retrospective enrichment using a pinned IMF World Economic Outlook snapshot, not a reconstruction of what was knowable on the 20 August 2026 edition date. Later releases and revisions may be present.
Research date: 11 September 2026 (extract retrieval). Historical edition date: 20 August 2026. Data snapshot created 24 August 2026 (IMF WEO normalized run 20260824T140954Z; raw run 20260810T114900Z).
Observation periods: annual WEO values stored as 1 January dates for calendar years 2001–2031. Years 2001–2025 are treated as historical or estimated outturns; 2026–2031 are treated as WEO projections. The vintage does not attach a realized/forecast flag to each row, so that split is a dating rule, not a field in the file.
Series used (IMF codes): GGXWDG_NGDP (gross debt % of GDP), GGXWDN_NGDP (net debt % of GDP), GGXCNL_NGDP (net lending/borrowing % of GDP), GGXONLB_NGDP (primary net lending/borrowing % of GDP), GGR_NGDP (revenue % of GDP), GGX_NGDP (expenditure % of GDP), GGXWDG (gross debt, national currency), NGDPD (GDP, current U.S. dollars), NGDP_RPCH (real GDP % change). The catalogue display name for GGXONLB_NGDP said “structural balance”; the IMF series code was treated as authoritative and the series is described as the primary balance.
Geographies: USA plus Japan, Italy, the United Kingdom, France, Germany, Canada, Spain, Greece, China, Australia and South Korea, where the same series returned observations. Dictionary presence was not treated as coverage; each extract was bounded and counted.
Duplicate handling: one observation per calendar year from the YYYY prefix of the stored date. No duplicate years and no nulls were present in the extracted U.S. series; nulls would have been skipped, not treated as zero. Values were rounded to one decimal place in tables after arithmetic on full extracts.
The implied interest residual is primary balance minus overall balance. It is a derived gap, not a published interest-expenditure series, and is not a household or per-person figure.
Material limitation: U.S. federal debt of $40 trillion (Treasury, 20 August 2026 reporting) is not identical to IMF general-government debt. The federal total includes intragovernmental holdings and excludes or treats state and local debt differently. Do not read the two stocks as a reconciliation. Cross-country ranks apply only to the selected WEO series and countries, not to a complete advanced-economy league table. No causal claim is made about buybacks, tax law, or the Iran war.
Research completed 2026-09-11, for the August 20, 2026 news edition. This is retrospective analysis, not a reconstruction of information available that day.
- IMF World Economic Outlook: Source 1