Research
Ford's $1 billion paint shop, measured against the auto industry Kentucky already has
A century-old factory bet, priced against the books
Ford's announcement on Thursday sounded like a founding myth: a $1 billion paint shop at Kentucky Truck Plant in Louisville, Super Duty trucks rolling off the line every 45 seconds, and a reminder that the first Model T left Louisville in 1913. Add the electric-pickup retooling at Louisville Assembly and the battery-storage conversion in Glendale and the company is talking about $5 billion of Kentucky work. That is real money. It is also a rounding error next to the industry already on the official books.
In 2024, the latest year in the Bureau of Economic Analysis state GDP accounts, Kentucky's motor vehicles, bodies, trailers and parts industry produced $10.7 billion of output. That was 3.6 percent of a $295 billion state economy and 22 percent of Kentucky manufacturing. Employee compensation in the same industry was $6.07 billion. A $1 billion paint shop is a large plant project. It is not, by itself, a new industrial base.
The useful question is not whether Ford still likes Kentucky. It is whether the factories that already exist are growing, shrinking, or merely being painted.
The payroll is large. It is not getting larger.
Statewide, vehicle assembly is a much bigger payroll than one plant. In July 2026, Kentucky had 22,900 not-seasonally-adjusted jobs in motor vehicle manufacturing, according to the Bureau of Labor Statistics. Auto-parts plants employed another 30,700. Together that is about 54,000 jobs — against a seasonally adjusted manufacturing payroll of 249,000 and a total nonfarm payroll of 2.03 million.
Ford said Kentucky Truck Plant alone had about 8,900 employees as of June, including more than 8,300 hourly workers. That is more than a third of the state's entire vehicle-assembly count. The rest is other assembly and, especially, the parts corridor that does not show up in a ribbon-cutting for a paint shop.
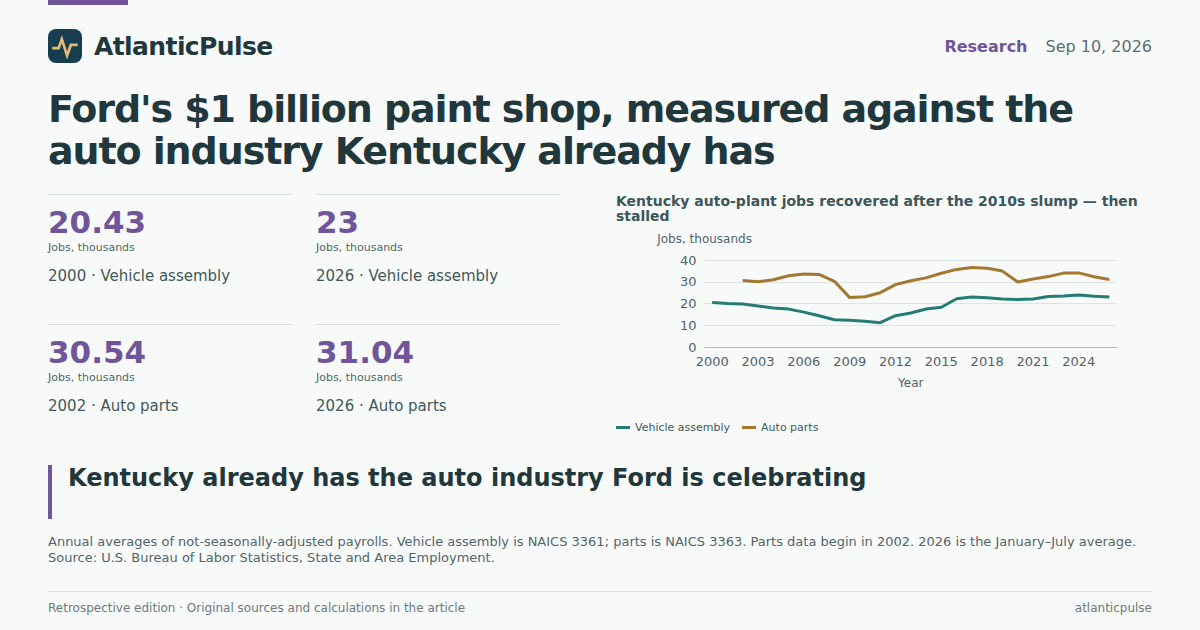
The jobs story over a generation is a recovery that has stopped accelerating. Annual average assembly employment fell from about 20,400 in 2000 to 11,200 in 2011, then climbed back above 23,000 by 2022. The 2025 average was 23,300. The first seven months of 2026 averaged 23,000. July 2026 was 1.7 percent below July 2025. Parts plants, which the BLS series picks up only from 2002, peaked near 36,600 in 2017 and have drifted down to about 31,000.
Kentucky auto-plant jobs recovered after the 2010s slump — then stalled

View exact chart values
| year | mv_mfg_thousands | mv_mfg_months | parts_thousands | parts_months | auto_plus_parts_thousands | mfg_sa_thousands | nfp_sa_thousands |
|---|---|---|---|---|---|---|---|
| 2000 | 20.43 | 12 | — | — | — | 310.5 | 1816.7 |
| 2001 | 20.01 | 12 | — | — | — | 291.9 | 1795.2 |
| 2002 | 19.75 | 12 | 30.54 | 12 | 50.29 | 275.2 | 1778.3 |
| 2003 | 18.89 | 12 | 29.96 | 12 | 48.85 | 265.5 | 1773.1 |
| 2004 | 17.87 | 12 | 30.92 | 12 | 48.78 | 263.7 | 1788.5 |
| 2005 | 17.41 | 12 | 32.77 | 12 | 50.17 | 262.2 | 1814.6 |
| 2006 | 16.05 | 12 | 33.6 | 12 | 49.65 | 260.8 | 1836.7 |
| 2007 | 14.41 | 12 | 33.38 | 12 | 47.78 | 255.9 | 1856.5 |
| 2008 | 12.53 | 12 | 30.2 | 12 | 42.73 | 245.3 | 1842 |
| 2009 | 12.33 | 12 | 22.69 | 12 | 35.02 | 213.1 | 1759.7 |
| 2010 | 11.81 | 12 | 23.09 | 12 | 34.9 | 209.1 | 1759.9 |
| 2011 | 11.18 | 12 | 24.95 | 12 | 36.13 | 212.8 | 1783.6 |
| 2012 | 14.41 | 12 | 28.67 | 12 | 43.08 | 223.4 | 1811.1 |
| 2013 | 15.62 | 12 | 30.42 | 12 | 46.03 | 229 | 1830.1 |
| 2014 | 17.46 | 12 | 31.75 | 12 | 49.21 | 235.1 | 1857.7 |
| 2015 | 18.31 | 12 | 33.92 | 12 | 52.22 | 241.4 | 1885.7 |
| 2016 | 22.21 | 12 | 35.69 | 12 | 57.9 | 248.4 | 1908.5 |
| 2017 | 22.93 | 12 | 36.57 | 12 | 59.5 | 250.5 | 1920.1 |
| 2018 | 22.6 | 12 | 36.18 | 12 | 58.78 | 251.7 | 1930.5 |
| 2019 | 22.12 | 12 | 34.89 | 12 | 57.02 | 252.3 | 1945.1 |
| 2020 | 21.9 | 12 | 29.88 | 12 | 51.78 | 235.5 | 1837.9 |
| 2021 | 22.05 | 12 | 31.28 | 12 | 53.33 | 243.1 | 1902.8 |
| 2022 | 23.19 | 12 | 32.35 | 12 | 55.54 | 252 | 1967.1 |
| 2023 | 23.45 | 12 | 33.96 | 12 | 57.41 | 256.6 | 2016.6 |
| 2024 | 23.93 | 12 | 34.07 | 12 | 58.01 | 257.7 | 2036.6 |
| 2025 | 23.33 | 12 | 32.32 | 12 | 55.65 | 252.5 | 2033.7 |
| 2026 | 23 | 7 | 31.04 | 7 | 54.04 | 249.2 | 2032.5 |
Output grew even while headcount flattened
Jobs and output are not the same thing. Real GDP in Kentucky motor vehicles, bodies, trailers and parts — chained 2017 dollars — collapsed in the 2009 crash, to an index of 31 against a 2017 base of 100. It then more than recovered. By 2024 the index was 142. From 2019 to 2024, real auto output rose 27 percent. Real GDP for the whole state rose 9 percent over the same stretch.
That is the quiet fact underneath the paint-shop applause. Kentucky is getting more vehicle-and-parts output out of a payroll that is no longer expanding. It is also a reminder not to treat a single July employment print as the whole industry: not-seasonally-adjusted assembly jobs often sag in midsummer plant shutdowns, which is why the annual averages and the GDP accounts are the cleaner long-run read.
Compensation followed the rebound. Auto-industry employee compensation in Kentucky was $2.45 billion in 2009 and $6.07 billion in 2024. Those are industry totals, not household averages, and they mix assembly, parts, and related plants. They still describe a sector that pays a large wage bill relative to its headcount.
After the 2009 collapse, Kentucky auto output is far above its 2017 level

View exact chart values
| year | ky_mv_real_million_chained2017 | ky_mv_real_index_2017 | ky_state_real_million_chained2017 |
|---|---|---|---|
| 1997 | 5877.7 | 71.1 | 155770.4 |
| 1998 | 6655.4 | 80.5 | 160810.1 |
| 1999 | 7458.9 | 90.3 | 165761.9 |
| 2000 | 4486.3 | 54.3 | 161101 |
| 2001 | 4525.7 | 54.8 | 161316.4 |
| 2002 | 4223.5 | 51.1 | 165435.3 |
| 2003 | 5234.2 | 63.3 | 170481.9 |
| 2004 | 6086.8 | 73.6 | 175344.6 |
| 2005 | 6741.8 | 81.6 | 182017.9 |
| 2006 | 7675.4 | 92.9 | 186332.6 |
| 2007 | 6837.8 | 82.7 | 185790 |
| 2008 | 5298.5 | 64.1 | 186515.9 |
| 2009 | 2531.9 | 30.6 | 178112.8 |
| 2010 | 5507 | 66.6 | 186720.6 |
| 2011 | 6006.6 | 72.7 | 188389.8 |
| 2012 | 6805.7 | 82.3 | 192060.1 |
| 2013 | 6729.3 | 81.4 | 196698 |
| 2014 | 7573.4 | 91.6 | 196795.8 |
| 2015 | 7692.7 | 93.1 | 199487.1 |
| 2016 | 8081.5 | 97.8 | 201007.2 |
| 2017 | 8264.5 | 100 | 203564 |
| 2018 | 8243 | 99.7 | 205940.1 |
| 2019 | 9217.7 | 111.5 | 211783.1 |
| 2020 | 7723.9 | 93.5 | 206601.9 |
| 2021 | 8550.1 | 103.5 | 215535 |
| 2022 | 11178.6 | 135.3 | 220641.8 |
| 2023 | 11229.6 | 135.9 | 226942.4 |
| 2024 | 11736.1 | 142 | 230966.4 |
Sixth in a tough neighborhood
Kentucky is an auto state. It is not the auto state. In 2024, among eight large producers, Kentucky ranked sixth in motor-vehicle manufacturing GDP: behind Michigan ($43.9 billion), Indiana ($20.7 billion), Texas ($19.3 billion), Ohio ($11.9 billion) and Tennessee ($11.2 billion), and ahead of Alabama and South Carolina. Kentucky's $10.7 billion was 5.8 percent of the U.S. industry total of $186 billion.
The jobs snapshot tells a similar story in miniature. In July 2026, Michigan still had 45,300 assembly jobs — about twice Kentucky's 22,900. Texas had 28,700. Alabama, at 22,400, was essentially tied with Kentucky. Michigan's GDP lead is much larger than its assembly-job lead, which is what one would expect in a state that still concentrates engineering, parts, and headquarters work. The comparison is not a claim that Kentucky plants are less productive. It is a claim that Ford's Kentucky bet sits inside a Midwest-and-South industry that is already crowded.
None of this makes a $1 billion paint shop trivial to Louisville. It does mean the state's auto identity does not depend on the groundbreaking. The identity is already in the 2024 accounts.
Kentucky is a top-tier auto state — just not Michigan

View exact chart values
| state | year | mv_gdp_million_current | share_of_us_mv_gdp_pct | rank |
|---|---|---|---|---|
| Michigan | 2024 | 43920.2 | 23.63 | 1 |
| Indiana | 2024 | 20728.3 | 11.15 | 2 |
| Texas | 2024 | 19327.1 | 10.4 | 3 |
| Ohio | 2024 | 11947.7 | 6.43 | 4 |
| Tennessee | 2024 | 11214.3 | 6.03 | 5 |
| Kentucky | 2024 | 10693.4 | 5.75 | 6 |
| Alabama | 2024 | 8050.9 | 4.33 | 7 |
| South Carolina | 2024 | 5800.4 | 3.12 | 8 |
Assembly-line headcount: Kentucky versus other truck-and-car states

View exact chart values
| state | period | mv_mfg_thousands_nsa |
|---|---|---|
| Michigan | 2026-07 | 45.3 |
| Texas | 2026-07 | 28.7 |
| Kentucky | 2026-07 | 22.9 |
| Alabama | 2026-07 | 22.4 |
The battery chapter is still a footnote
Ford's Kentucky package is not only trucks. About $2 billion is slated to turn Louisville Assembly toward the Fathom electric pickup, and another $2 billion would convert the former battery site in Glendale into grid storage, with production aimed at late 2027. If those projects land, they will show up later in electrical-equipment accounts as well as motor vehicles.
They have not landed yet. Electrical equipment, appliance, and component manufacturing — the BEA industry that includes batteries and power equipment — produced $2.83 billion in Kentucky in 2024. That is a real industry. It is about one-quarter the size of motor vehicles and parts. Autos, other durables, and nondurables together were $49 billion. The rest of Kentucky's economy was $246 billion. A paint shop does not rearrange that pie.
The honest reading of Thursday's announcement is therefore slightly deflating, which is also the useful one. Kentucky already has the auto factories. They already pay a $6 billion compensation bill. They already account for more than a fifth of factory output. What Ford is buying is a newer paint line, a different truck mix, and a storage-plant option — on top of a century-old payroll that is large, recovered from 2009, and no longer growing.
Autos are a fifth of Kentucky factory output — and a sliver of the whole economy

View exact chart values
| category | gdp_billion |
|---|---|
| Motor vehicles and parts | 10.69 |
| Other durable manufacturing | 16.53 |
| Nondurable manufacturing | 21.74 |
| Rest of Kentucky economy | 246.41 |
Sources and methods
This is retrospective enrichment using pinned catalogue snapshots, not a reconstruction of what was knowable on the 2026-09-10 edition date. Later revisions may be present in the snapshots.
Research compiled against the 2026-09-10 State-News edition. Employment figures come from the BLS State and Area Employment snapshot dated 2026-08-24 (observations through July 2026). GDP and compensation figures come from the BEA annual state GDP/income snapshot created 2026-08-31, sourced from BEA release bea-regional-state-annual-2026-04-09, with annual observations through 2024.
Motor vehicle manufacturing jobs are BLS SAE NAICS 3361 (not seasonally adjusted). Parts jobs are NAICS 3363 (NSA; series begins 2002). Manufacturing and total nonfarm payrolls used for context are seasonally adjusted statewide series and are not mixed into a single exact share without that qualification. July NSA assembly counts can fall during summer shutdowns; annual averages are the preferred trend measure.
BEA motor-vehicle GDP is NAICS 3361–3363 (motor vehicles, bodies, trailers, and parts) in current dollars unless labeled real (chained 2017 dollars). Manufacturing GDP is the sum of durable and nondurable manufacturing. Aggregate industry dollars are not household averages or plant-level profits. Missing observations were not treated as zero. Ohio and Missouri monthly assembly series returned no matching observations in the requested window and were omitted from the jobs comparison.
The eight-state GDP ranking is a comparison set of large auto producers, not a complete 50-state ranking. No causal effect is inferred from Ford's announcement to subsequent GDP or payrolls; 2024 accounts predate the September 2026 investment news.
Research completed 2026-09-11, for the September 10, 2026 news edition. This is retrospective analysis, not a reconstruction of information available that day.