Research
Florida’s $15 wage is arriving after the average already left
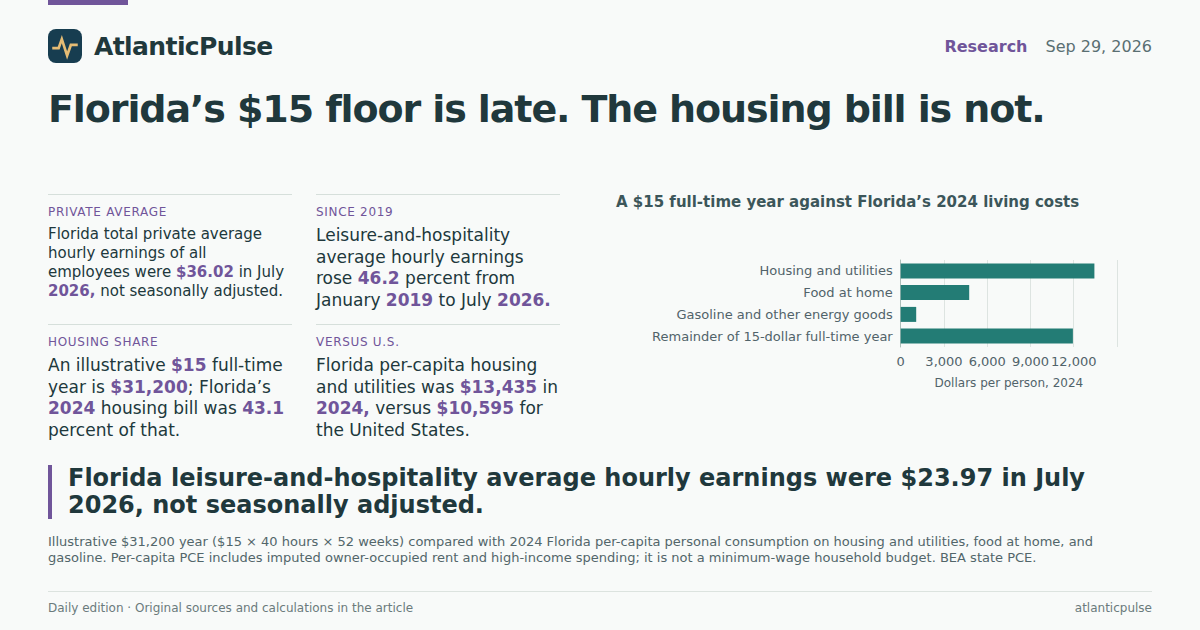
A floor that the average already cleared
On Wednesday, Florida’s statewide minimum wage reaches $15 an hour — the last scheduled step of a 2020 constitutional amendment, after a year at $14. Tipped workers are due a $11.98 direct wage. Jacksonville residents, asked whether that dollar still stretches, were not sentimental. One called $15 “cool like five years ago.” The official payroll books, which run through July 2026, explain the shrug without needing a focus group.
Average hourly earnings of all Florida private employees were $36.02 in July, not seasonally adjusted, according to the Bureau of Labor Statistics state employment files. In leisure and hospitality — hotels, restaurants, theme parks, the industry the floor was written for — the average was $23.97. That is $8.97 above the new statutory line. Even in January 2019, before the amendment passed, the leisure average was already $16.39. The mean never needed a $15 law. The people at the bottom of the distribution did. The catch is that these averages cannot show them.
That is not a quibble. Average hourly earnings mix dishwashers with general managers. They are means, not medians, and they are not seasonally adjusted, so a busy winter month can look richer than a slow August. They still answer a useful question: has the typical recorded hour in Florida’s tourist economy already left $15 behind? Yes, and it left years ago. From January 2019 to July 2026, the leisure average rose 46.2 percent. Total private pay rose from $25.42 to $36.02 over the same span. The $15 floor is arriving as a backstop under a distribution that has already moved.
Florida’s average hourly pay already sits well above $15

View exact chart values
| month | leisure_ahe | private_ahe | trade_ahe | floor_15 |
|---|---|---|---|---|
| 2019-01 | 16.39 | 25.42 | 22.87 | 15 |
| 2019-02 | 16.95 | 25.48 | 22.92 | 15 |
| 2019-03 | 16.94 | 25.37 | 22.67 | 15 |
| 2019-04 | 16.84 | 25.53 | 22.79 | 15 |
| 2019-05 | 16.7 | 25.45 | 22.68 | 15 |
| 2019-06 | 16.51 | 25.58 | 22.79 | 15 |
| 2019-07 | 16.25 | 25.57 | 22.75 | 15 |
| 2019-08 | 16.33 | 25.81 | 22.91 | 15 |
| 2019-09 | 16.37 | 25.96 | 22.95 | 15 |
| 2019-10 | 16.57 | 25.77 | 22.94 | 15 |
| 2019-11 | 16.73 | 25.83 | 22.96 | 15 |
| 2019-12 | 16.81 | 26.12 | 22.82 | 15 |
| 2020-01 | 16.71 | 25.99 | 23.21 | 15 |
| 2020-02 | 16.87 | 26.39 | 23.27 | 15 |
| 2020-03 | 16.74 | 26.24 | 23.52 | 15 |
| 2020-04 | 17.34 | 27.07 | 24.45 | 15 |
| 2020-05 | 16.97 | 27.27 | 23.98 | 15 |
| 2020-06 | 16.5 | 26.84 | 23.98 | 15 |
| 2020-07 | 16.18 | 27.05 | 24.09 | 15 |
| 2020-08 | 16.11 | 27.61 | 24.04 | 15 |
| 2020-09 | 16.34 | 27.21 | 24.62 | 15 |
| 2020-10 | 16.47 | 27.21 | 23.79 | 15 |
| 2020-11 | 16.57 | 27.3 | 23.73 | 15 |
| 2020-12 | 16.71 | 27.06 | 23.41 | 15 |
| 2021-01 | 16.6 | 27.31 | 24.31 | 15 |
| 2021-02 | 16.69 | 27.34 | 23.94 | 15 |
| 2021-03 | 17 | 27.26 | 24.27 | 15 |
| 2021-04 | 17.45 | 27.57 | 24.08 | 15 |
| 2021-05 | 17.64 | 28.14 | 24.13 | 15 |
| 2021-06 | 17.85 | 27.76 | 24.28 | 15 |
| 2021-07 | 17.81 | 27.98 | 23.87 | 15 |
| 2021-08 | 18.01 | 28.54 | 24.24 | 15 |
| 2021-09 | 18 | 28.7 | 24.79 | 15 |
| 2021-10 | 18.79 | 28.91 | 22.96 | 15 |
| 2021-11 | 18.58 | 28.7 | 23.09 | 15 |
| 2021-12 | 19.07 | 28.79 | 23.64 | 15 |
| 2022-01 | 19.25 | 29.03 | 23.73 | 15 |
| 2022-02 | 19.37 | 28.92 | 24.34 | 15 |
| 2022-03 | 19.83 | 29.04 | 24.6 | 15 |
| 2022-04 | 19.74 | 28.94 | 24.84 | 15 |
| 2022-05 | 19.93 | 29.19 | 25.05 | 15 |
| 2022-06 | 19.68 | 29.14 | 25.04 | 15 |
| 2022-07 | 19.69 | 29.42 | 24.75 | 15 |
| 2022-08 | 19.62 | 29.7 | 24.88 | 15 |
| 2022-09 | 20.01 | 29.8 | 25.25 | 15 |
| 2022-10 | 20.22 | 30.07 | 25.16 | 15 |
| 2022-11 | 20.62 | 30.47 | 25.35 | 15 |
| 2022-12 | 20.93 | 30.24 | 24.96 | 15 |
| 2023-01 | 20.8 | 30.15 | 25.49 | 15 |
| 2023-02 | 21.31 | 30.51 | 25.86 | 15 |
| 2023-03 | 21.11 | 30.9 | 25.72 | 15 |
| 2023-04 | 21.24 | 31.14 | 25.99 | 15 |
| 2023-05 | 21.19 | 30.75 | 25.66 | 15 |
| 2023-06 | 21.14 | 30.79 | 25.81 | 15 |
| 2023-07 | 21.14 | 31.4 | 26.06 | 15 |
| 2023-08 | 21.06 | 31.48 | 25.89 | 15 |
| 2023-09 | 21.07 | 31.71 | 26.36 | 15 |
| 2023-10 | 21.58 | 32.11 | 26.66 | 15 |
| 2023-11 | 22.04 | 31.78 | 26.3 | 15 |
| 2023-12 | 22.24 | 31.92 | 26.34 | 15 |
| 2024-01 | 22.09 | 32.08 | 26.94 | 15 |
| 2024-02 | 22.24 | 32.16 | 27.47 | 15 |
| 2024-03 | 22.27 | 32.07 | 26.92 | 15 |
| 2024-04 | 22.04 | 31.95 | 26.21 | 15 |
| 2024-05 | 21.81 | 31.94 | 26.36 | 15 |
| 2024-06 | 21.39 | 32.08 | 26.79 | 15 |
| 2024-07 | 21.31 | 31.66 | 25.96 | 15 |
| 2024-08 | 21.08 | 32.33 | 26.5 | 15 |
| 2024-09 | 21.07 | 32.96 | 26.52 | 15 |
| 2024-10 | 21.32 | 33.49 | 27.92 | 15 |
| 2024-11 | 21.58 | 33.11 | 27.39 | 15 |
| 2024-12 | 21.98 | 34.1 | 27.89 | 15 |
| 2025-01 | 21.75 | 33.72 | 28.07 | 15 |
| 2025-02 | 22.42 | 34.34 | 28.92 | 15 |
| 2025-03 | 22.41 | 34.32 | 29.56 | 15 |
| 2025-04 | 22.21 | 33.75 | 28.71 | 15 |
| 2025-05 | 22.13 | 34.07 | 28.72 | 15 |
| 2025-06 | 22.06 | 34.33 | 29.12 | 15 |
| 2025-07 | 22.11 | 34.16 | 28.68 | 15 |
| 2025-08 | 22.15 | 34.54 | 28.72 | 15 |
| 2025-09 | 22.3 | 34.81 | 28.87 | 15 |
| 2025-10 | 22.82 | 34.87 | 28.9 | 15 |
| 2025-11 | 23.19 | 35.45 | 28.88 | 15 |
| 2025-12 | 23.36 | 35.09 | 28.84 | 15 |
| 2026-01 | 23.6 | 35.54 | 29.38 | 15 |
| 2026-02 | 24.11 | 35.89 | 30.11 | 15 |
| 2026-03 | 23.81 | 36.08 | 30 | 15 |
| 2026-04 | 24.01 | 35.73 | 30.01 | 15 |
| 2026-05 | 23.81 | 35.77 | 29.73 | 15 |
| 2026-06 | 23.81 | 35.75 | 29.71 | 15 |
| 2026-07 | 23.97 | 36.02 | 30.39 | 15 |
The jobs that were supposed to feel it
Leisure and hospitality is still a large slice of Florida’s labor market. In July 2026 it employed 1,344,100 people, seasonally adjusted, or 13.4 percent of the state’s 10,037,300 nonfarm jobs. That is a little below the 14.1 percent share of early 2019, because the rest of the payroll grew faster, but it is more bodies than before the pandemic: 1,250,800 leisure jobs in January 2019.
The 2020 collapse is still the scar on the chart. Leisure employment fell to 712,700 in April 2020, then climbed back through 2021 and 2022. By early 2023 it had surpassed the old peak. The wage floor that voters approved in November 2020 therefore landed on an industry that was rebuilding headcount and raising the average recorded wage at the same time. The books do not say the amendment caused that. They say the industry was not frozen at $8.56, waiting for Tallahassee.
Trade, transportation and utilities — the other large low-and-middle wage block — averaged $30.39 an hour in July 2026. That supersector includes grocery clerks and warehouse workers as well as utility linemen, so the mean is even less of a portrait of the bottom. It is still another reminder that $15 is not the going rate for a typical recorded hour in Florida. It is a legal minimum under a market that, on average, has already gone elsewhere.
Florida’s leisure payroll recovered — and then some

View exact chart values
| month | leisure_thousands | nonfarm_thousands | leisure_share_pct |
|---|---|---|---|
| 2019-01 | 1250.8 | 8896.2 | 14.1 |
| 2019-02 | 1258.4 | 8916.2 | 14.1 |
| 2019-03 | 1259.7 | 8929.3 | 14.1 |
| 2019-04 | 1258.4 | 8937.4 | 14.1 |
| 2019-05 | 1256.2 | 8943.1 | 14 |
| 2019-06 | 1251.6 | 8956 | 14 |
| 2019-07 | 1255.2 | 8969.2 | 14 |
| 2019-08 | 1258.6 | 8996.2 | 14 |
| 2019-09 | 1253.3 | 8990.9 | 13.9 |
| 2019-10 | 1266.5 | 9025.1 | 14 |
| 2019-11 | 1272.1 | 9049.2 | 14.1 |
| 2019-12 | 1275.4 | 9067 | 14.1 |
| 2020-01 | 1279.7 | 9074.6 | 14.1 |
| 2020-02 | 1284.1 | 9083.6 | 14.1 |
| 2020-03 | 1250.4 | 9023.7 | 13.9 |
| 2020-04 | 712.7 | 7804.3 | 9.1 |
| 2020-05 | 784.8 | 8044.5 | 9.8 |
| 2020-06 | 906.3 | 8331.6 | 10.9 |
| 2020-07 | 931.5 | 8373.1 | 11.1 |
| 2020-08 | 938.5 | 8414.4 | 11.2 |
| 2020-09 | 970 | 8478.8 | 11.4 |
| 2020-10 | 1009 | 8554.1 | 11.8 |
| 2020-11 | 1029.3 | 8589.3 | 12 |
| 2020-12 | 1041.1 | 8630.2 | 12.1 |
| 2021-01 | 1036.8 | 8673.2 | 12 |
| 2021-02 | 1046.2 | 8710.1 | 12 |
| 2021-03 | 1055 | 8760.6 | 12 |
| 2021-04 | 1066.3 | 8766.7 | 12.2 |
| 2021-05 | 1094.4 | 8831.1 | 12.4 |
| 2021-06 | 1125.1 | 8884.4 | 12.7 |
| 2021-07 | 1150.1 | 8972.1 | 12.8 |
| 2021-08 | 1153.5 | 8992.2 | 12.8 |
| 2021-09 | 1171.8 | 9040.2 | 13 |
| 2021-10 | 1189.4 | 9134.4 | 13 |
| 2021-11 | 1196 | 9171.9 | 13 |
| 2021-12 | 1203.6 | 9203.4 | 13.1 |
| 2022-01 | 1202 | 9219.5 | 13 |
| 2022-02 | 1211.2 | 9278.9 | 13.1 |
| 2022-03 | 1215 | 9298.2 | 13.1 |
| 2022-04 | 1227.5 | 9363.6 | 13.1 |
| 2022-05 | 1233.9 | 9398.1 | 13.1 |
| 2022-06 | 1239.8 | 9414.6 | 13.2 |
| 2022-07 | 1252.6 | 9488.8 | 13.2 |
| 2022-08 | 1257.3 | 9520.8 | 13.2 |
| 2022-09 | 1269 | 9564.2 | 13.3 |
| 2022-10 | 1261.7 | 9559.7 | 13.2 |
| 2022-11 | 1265.4 | 9567.1 | 13.2 |
| 2022-12 | 1269.1 | 9601.5 | 13.2 |
| 2023-01 | 1285.8 | 9646.2 | 13.3 |
| 2023-02 | 1289.6 | 9665.2 | 13.3 |
| 2023-03 | 1291.1 | 9688.7 | 13.3 |
| 2023-04 | 1289.4 | 9714.8 | 13.3 |
| 2023-05 | 1295.8 | 9741.5 | 13.3 |
| 2023-06 | 1300.9 | 9780.6 | 13.3 |
| 2023-07 | 1301.2 | 9779 | 13.3 |
| 2023-08 | 1303 | 9793.9 | 13.3 |
| 2023-09 | 1308.5 | 9823.6 | 13.3 |
| 2023-10 | 1312.6 | 9847.1 | 13.3 |
| 2023-11 | 1318 | 9853.6 | 13.4 |
| 2023-12 | 1318.1 | 9869.7 | 13.4 |
| 2024-01 | 1326.3 | 9884.6 | 13.4 |
| 2024-02 | 1326.4 | 9895.7 | 13.4 |
| 2024-03 | 1327.5 | 9913.4 | 13.4 |
| 2024-04 | 1325.3 | 9923.9 | 13.4 |
| 2024-05 | 1326.2 | 9932.1 | 13.4 |
| 2024-06 | 1321.2 | 9936.5 | 13.3 |
| 2024-07 | 1320.3 | 9945.1 | 13.3 |
| 2024-08 | 1320.3 | 9960.2 | 13.3 |
| 2024-09 | 1327.5 | 9986.5 | 13.3 |
| 2024-10 | 1293.4 | 9876.9 | 13.1 |
| 2024-11 | 1328.3 | 9974.4 | 13.3 |
| 2024-12 | 1332.7 | 9979.3 | 13.4 |
| 2025-01 | 1333.6 | 9995.9 | 13.3 |
| 2025-02 | 1333.9 | 10005.9 | 13.3 |
| 2025-03 | 1333.7 | 10015.6 | 13.3 |
| 2025-04 | 1334.9 | 10017.1 | 13.3 |
| 2025-05 | 1333 | 10013.3 | 13.3 |
| 2025-06 | 1331.7 | 10002.6 | 13.3 |
| 2025-07 | 1330.9 | 9996.3 | 13.3 |
| 2025-08 | 1330.1 | 9992.6 | 13.3 |
| 2025-09 | 1328.5 | 9985.6 | 13.3 |
| 2025-10 | 1325.5 | 9943 | 13.3 |
| 2025-11 | 1326.5 | 9947.2 | 13.3 |
| 2025-12 | 1327.7 | 9953.9 | 13.3 |
| 2026-01 | 1327.6 | 9967.4 | 13.3 |
| 2026-02 | 1324.8 | 9965.1 | 13.3 |
| 2026-03 | 1330.1 | 9992.4 | 13.3 |
| 2026-04 | 1335.7 | 10026.3 | 13.3 |
| 2026-05 | 1336.6 | 10022.2 | 13.3 |
| 2026-06 | 1344 | 10032.8 | 13.4 |
| 2026-07 | 1344.1 | 10037.3 | 13.4 |
What a $15 year actually meets
A full-time year at $15 — 40 hours a week, 52 weeks, no unpaid time off — is $31,200. That is an illustration, not a household. Florida’s latest per-capita consumption figures, for 2024, are not a minimum-wage budget either: they include imputed rent for homeowners and the spending of people who earn far more than $15. They are still the official picture of what it costs to live in the state, and they are why the Jacksonville shrug is not just vibes.
Housing and utilities ran $13,435 per person in Florida in 2024. That is 43.1 percent of a $15 full-time year, and it is well above the U.S. per-capita figure of $10,595. Add food and beverages bought for home ($4,751) and gasoline and other energy goods ($1,072) and those three lines consume 61.7 percent of $31,200 — before health care, before a car payment, before a child. Food services and accommodations, the other side of the tourist economy, added $4,938 per person. Total per-capita consumption in Florida was $62,618, against $58,499 nationally.
None of that means a minimum-wage worker spends $13,435 on housing. Per-capita housing includes the imputed rental value of owner-occupied homes. A renter on $15 an hour lives in a thinner slice of that average. The direction is still unkind. Florida’s housing-and-utilities bill was $8,938 per person in 2019, the year before the wage amendment passed. By 2024 it was $13,435. The statutory wage climbed on a schedule. The housing line did not wait for the schedule.
A $15 full-time year against Florida’s 2024 living costs

View exact chart values
| category | dollars |
|---|---|
| Housing and utilities | 13435 |
| Food at home | 4751 |
| Gasoline and other energy goods | 1072 |
| Remainder of 15-dollar full-time year | 11942 |
Florida’s housing bill pulled away from the U.S. average

View exact chart values
| year | florida | united_states |
|---|---|---|
| 2010 | 7407 | 6296 |
| 2011 | 7462 | 6360 |
| 2012 | 7477 | 6409 |
| 2013 | 7538 | 6585 |
| 2014 | 7676 | 6722 |
| 2015 | 7861 | 6824 |
| 2016 | 8025 | 6996 |
| 2017 | 8255 | 7196 |
| 2018 | 8566 | 7486 |
| 2019 | 8938 | 7758 |
| 2020 | 9533 | 8106 |
| 2021 | 9913 | 8560 |
| 2022 | 11121 | 9324 |
| 2023 | 12421 | 10022 |
| 2024 | 13435 | 10595 |
Florida is not the cheapest tourist state, and not the richest
Put Florida next to other big hospitality states and the $15 floor looks less like a leap and more like a late handshake with the coast. In July 2026, leisure-and-hospitality average hourly earnings were $18.44 in Texas and $20.47 in Georgia — both still above $15 as means, both below Florida. New Jersey was $24.26. New York was $26.85. California was $28.04 and Washington $28.05. Those last two have had high state floors for years. Florida is joining a club whose averages had already moved.
Indexed to January 2019, Florida’s leisure average is up about 46 percent. California’s is up a similar amount. Texas is up about 31 percent. The comparison is not a controlled experiment: each state has a different mix of hotels, restaurants and theme parks, and none of these series is a minimum-wage tracker. It is enough to say Florida’s tourist-industry mean did not stall while the amendment crawled from $8.56 toward $15.
On income, Florida is no longer cheap in the way campaign mailers remember. Per-capita personal income was $76,440 in 2025, essentially tied with the U.S. figure of $76,393. Regional price parities for 2024 put overall Florida prices at 103.4 against a U.S. index of 100 — a modest premium. Housing services were 122.1. The state is not California. It is also not the bargain Sun Belt of the 2010s. A $15 wage is being asked to cover a housing market that official prices already treat as more than a fifth above the national housing average.
Tourism-state leisure pay, July 2026

View exact chart values
| state | month | leisure_ahe | gap_vs_15 |
|---|---|---|---|
| Texas | 2026-07 | 18.44 | 3.44 |
| Georgia | 2026-07 | 20.47 | 5.47 |
| Florida | 2026-07 | 23.97 | 8.97 |
| New Jersey | 2026-07 | 24.26 | 9.26 |
| New York | 2026-07 | 26.85 | 11.85 |
| California | 2026-07 | 28.04 | 13.04 |
| Washington | 2026-07 | 28.05 | 13.05 |
What Wednesday does and does not change
Starting in 2027, Florida’s minimum wage is supposed to rise with inflation rather than on a fixed ladder. That is the part of the amendment that will matter if grocery and rent lines keep outrunning the average. The July 2026 books cannot preview that. They can only show that the last scheduled step, the one that made Florida the 18th state at $15, is landing under an industry whose recorded average hour is already closer to $24 than to $15.
Two honest limits sit on that sentence. First, a mean of $23.97 is compatible with a large group of workers still near the floor — especially tipped employees, whose cash wage can be $11.98 if tips make up the rest. The BLS state series used here does not split those workers out. Second, per-capita consumption is not a paycheck. It is the state’s average spending, homeowners included. The people who will actually get a raise on Wednesday are not the people who pull that average up.
The useful conclusion is narrower, and it matches what Floridians told local reporters without a spreadsheet. $15 an hour is not nothing. It is also not 2020 money. The official average in the jobs most exposed to the floor cleared that number years ago. The official housing bill did not. Wednesday writes a new legal minimum. The cost of living has been writing a different one, in larger print, for some time.
Sources and methods
Payroll figures are from BLS State and Area Employment, snapshot bls-sm-snapshot-2026-08-24, with monthly observations through July 2026. That is a lagged official vintage, not a current-day reading. Average hourly earnings are not seasonally adjusted means for all employees; they are not medians and they mix high earners with low-wage staff. Employment counts used here are seasonally adjusted. Null observations were skipped, not treated as zero.
The $31,200 figure is $15 times 40 hours times 52 weeks. It is an illustrative full-time year, not an estimate of what any Florida household earns or spends. Tipped-wage rules and part-time schedules are outside the BLS averages used here.
Spending figures are BEA state personal consumption expenditures per capita, current dollars, annual through 2024 (release bea-sapce-2025-09-26). Housing and utilities include imputed rental of owner-occupied dwellings, so they are not a renter’s bill and not a minimum-wage budget. Food at home is food and beverages purchased for off-premises consumption. Per-capita personal income is BEA SAINC through 2025. Regional price parities are BEA SARPP through 2024, United States = 100; the housing component is estimated from tenant-occupied housing.
State leisure-pay comparisons use the same BLS all-employee, not-seasonally-adjusted concept in July 2026. They are descriptive. They do not isolate the effect of Florida’s 2020 wage amendment, and they are not a complete roster of $15-floor states.
No causal effect is inferred from the coincidence of a rising leisure average and a rising statutory floor. The series cannot identify workers at or near the minimum.
Research completed 2026-09-30, for the September 29, 2026 news edition. The available source data may cover earlier periods; see the observation periods and source vintages above.