Research
Fifteen billion dollars, next to a farm-subsidy book that already jumped
A campaign cheque, measured against last year’s books
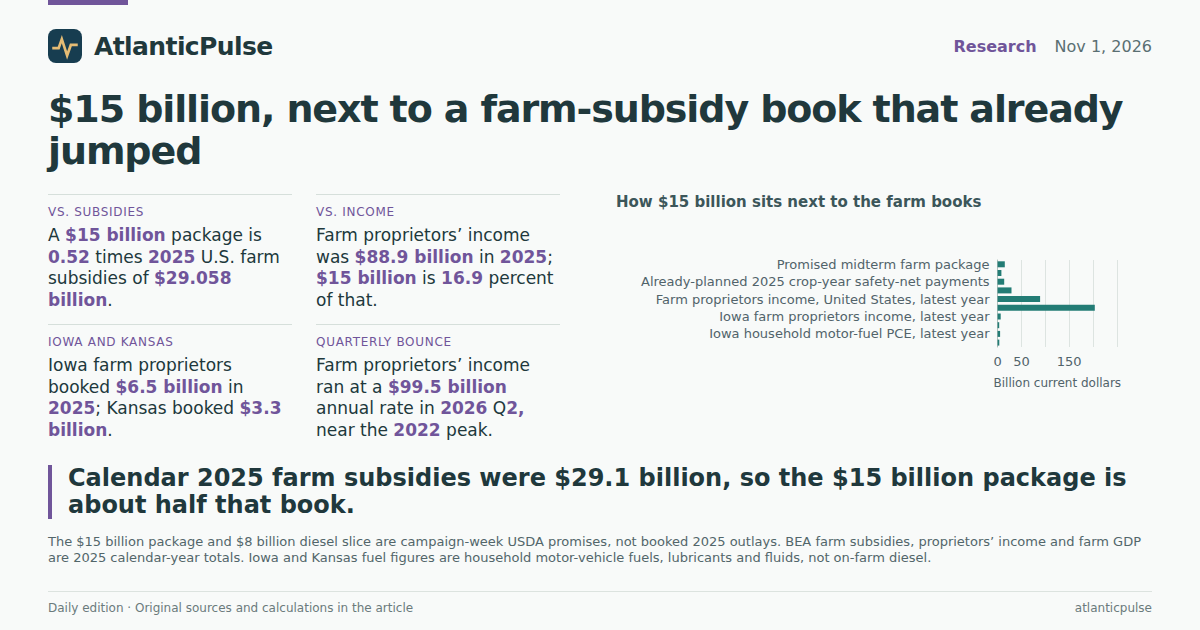
President Donald Trump’s Sunday stops in Iowa and Kansas came wrapped in a very specific number. In the last few weeks before Tuesday’s midterms, his Agriculture Department has promised about $15 billion in payments and related initiatives meant to offset diesel and fertiliser costs that farmers have blamed on tariffs and the Iran war. More than half of that pile — $8 billion — is a one-time diesel payment whose details, the department said, would arrive later in November. Separately, USDA still plans $13.8 billion in already-scheduled 2025 crop-year safety-net payments for corn, soybeans, wheat and rice. Those are promises, not cheques already cleared. The question for anyone who has to finance a crop, or vote in a farm county, is simpler: how large is $15 billion next to the farm economy the government already records?
The Bureau of Economic Analysis keeps two useful ledgers. One is farm-industry subsidies in the GDP accounts. The other is farm proprietors’ income — the money that actually reaches sole proprietors and partnerships, not corporate farms. Neither series is a USDA programme scorecard, and neither can say whether a one-time diesel payment will cover a 100-gallon tank at $6.32 a gallon. They can say whether $15 billion is a rounding error, a typical year, or a second cheque on top of a book that just got fatter.
How $15 billion sits next to the farm books

View exact chart values
| item | billion_usd | note |
|---|---|---|
| Promised midterm farm package | 15 | USDA announcements, weeks before 2026 midterms |
| Of which one-time diesel payment | 8 | More than half of the $15B; details later in November |
| Already-planned 2025 crop-year safety-net payments | 13.8 | USDA, separate from the $15B |
| BEA farm subsidies, United States, latest year | 29.058 | SAGDP5 Farms; BEA records subsidies as negatives; shown as positive dollars |
| Farm proprietors income, United States, latest year | 88.899 | Excludes corporate farms |
| Farm GDP, United States, latest year | 203.549 | Current-dollar farm industry GDP |
| Iowa farm proprietors income, latest year | 6.528 | Campaign-stop state |
| Kansas farm proprietors income, latest year | 3.253 | Campaign-stop state |
| Iowa household motor-fuel PCE, latest year | 5.331 | Household fuels, not farm diesel |
| Kansas household motor-fuel PCE, latest year | 3.516 | Household fuels, not farm diesel |
The subsidy line already moved
In calendar 2025, BEA recorded $29.1 billion in U.S. farm subsidies. That is not a small number looking for company. It is more than three times the $8.3 billion booked in 2024, and it sits between the COVID-year spike of $45.0 billion in 2020 and the more ordinary $9–12 billion years of the late 2010s. The $15 billion package is about half of 2025’s subsidy total — 0.52 times that book — not a doubling of it. BEA writes subsidies as negatives in the GDP accounts because they reduce value added; the figures here are the absolute dollar amounts.
Farm proprietors’ income tells a different story from the subsidy line. It peaked at $103.3 billion in 2022, slipped to $62.8 billion in 2024, then recovered to $88.9 billion in 2025. Against that 2025 income total, $15 billion is 16.9 percent. Against 2025 farm GDP of $203.5 billion, it is 7.4 percent. The package is large if you live in a county where cash flow is the whole year. It is not large if the comparison is last year’s national subsidy spike.
The scatter of subsidies against income makes the mismatch visible. 2020 was a subsidy year. 2022 was an income year. 2025 is another high-subsidy year with income still below the 2022 peak. A diesel cheque can land in either kind of year. It does not, by itself, rewrite the income line.
U.S. farm subsidies, farm proprietors’ income and a $15 billion package

View exact chart values
| year | farm_subsidies_billion_usd | farm_proprietors_income_billion_usd | farm_gdp_billion_usd | package_15b |
|---|---|---|---|---|
| 2010 | 10.516 | 44.296 | 117.043 | 15 |
| 2011 | 8.825 | 71.28 | 151.135 | 15 |
| 2012 | 8.759 | 65.474 | 148.752 | 15 |
| 2013 | 8.915 | 97.285 | 184.472 | 15 |
| 2014 | 8.102 | 77.57 | 167.051 | 15 |
| 2015 | 9.195 | 62.442 | 146.259 | 15 |
| 2016 | 11.42 | 42.435 | 130.27 | 15 |
| 2017 | 10.115 | 46.786 | 138.733 | 15 |
| 2018 | 12.446 | 37.82 | 136.825 | 15 |
| 2019 | 21.109 | 40.328 | 122.63 | 15 |
| 2020 | 45.017 | 56.804 | 120.506 | 15 |
| 2021 | 26.781 | 79.726 | 185.665 | 15 |
| 2022 | 13.845 | 103.331 | 246.303 | 15 |
| 2023 | 9.985 | 80.254 | 217.051 | 15 |
| 2024 | 8.349 | 62.806 | 196.211 | 15 |
| 2025 | 29.058 | 88.899 | 203.549 | 15 |
When subsidies jumped, farm income did not always follow

View exact chart values
| year | farm_subsidies_billion_usd | farm_proprietors_income_billion_usd | farm_gdp_billion_usd | package_15b |
|---|---|---|---|---|
| 2010 | 10.516 | 44.296 | 117.043 | 15 |
| 2011 | 8.825 | 71.28 | 151.135 | 15 |
| 2012 | 8.759 | 65.474 | 148.752 | 15 |
| 2013 | 8.915 | 97.285 | 184.472 | 15 |
| 2014 | 8.102 | 77.57 | 167.051 | 15 |
| 2015 | 9.195 | 62.442 | 146.259 | 15 |
| 2016 | 11.42 | 42.435 | 130.27 | 15 |
| 2017 | 10.115 | 46.786 | 138.733 | 15 |
| 2018 | 12.446 | 37.82 | 136.825 | 15 |
| 2019 | 21.109 | 40.328 | 122.63 | 15 |
| 2020 | 45.017 | 56.804 | 120.506 | 15 |
| 2021 | 26.781 | 79.726 | 185.665 | 15 |
| 2022 | 13.845 | 103.331 | 246.303 | 15 |
| 2023 | 9.985 | 80.254 | 217.051 | 15 |
| 2024 | 8.349 | 62.806 | 196.211 | 15 |
| 2025 | 29.058 | 88.899 | 203.549 | 15 |
Iowa and Kansas are not the national average
The president did not spend Sunday in a national accounts table. He spent it in two states whose farm proprietors’ income, even in a better 2025, is a few billion dollars. Iowa’s farm proprietors booked $6.5 billion in 2025, down from $10.5 billion in 2022. Kansas booked $3.3 billion, after a 2023 reading of $3.3 billion and a 2022 dip to $1.9 billion. Add the two states together and you still do not reach $15 billion. That is why a national package can look modest in Washington and enormous in Sioux County.
The subsidy books in those states moved with the national spike. In 2025 Iowa’s farm subsidies were $2.3 billion and Kansas’s were $1.7 billion, among the larger state totals in this extract, alongside Texas ($2.3 billion) and Minnesota ($2.3 billion). Those are not shares of the new $15 billion. They are what BEA already counted for calendar 2025. If the diesel money is extra, it arrives on top of a year that was already a fat subsidy year in the Corn Belt. If some of it merely restates money already in the 2025 accounts, the stump speech is counting a cheque the books have seen.
Iowa and Kansas farm proprietors’ income, 2010–2025

View exact chart values
| year | iowa_farm_proprietors_billion_usd | kansas_farm_proprietors_billion_usd | iowa_farm_gdp_billion_usd | kansas_farm_gdp_billion_usd |
|---|---|---|---|---|
| 2010 | 3.038 | 2.15 | 5.996 | 4.222 |
| 2011 | 6.807 | 3.188 | 10.242 | 5.84 |
| 2012 | 5.953 | 2.52 | 10.034 | 5.074 |
| 2013 | 7.818 | 4.466 | 12.412 | 6.968 |
| 2014 | 5.04 | 2.198 | 10.624 | 4.564 |
| 2015 | 4.417 | 1.212 | 8.668 | 3.765 |
| 2016 | 2.123 | 1.584 | 7.11 | 4.293 |
| 2017 | 2.632 | 0.839 | 7.923 | 3.588 |
| 2018 | 3.295 | 1.165 | 8.34 | 3.859 |
| 2019 | 2.123 | 1.098 | 6.027 | 3.208 |
| 2020 | 1.921 | 3.004 | 4.749 | 4.4 |
| 2021 | 6.697 | 2.787 | 12.826 | 6.394 |
| 2022 | 10.482 | 1.948 | 18.707 | 6.247 |
| 2023 | 6.146 | 3.33 | 13.689 | 7.724 |
| 2024 | 4.47 | 2.455 | 12.472 | 6.465 |
| 2025 | 6.528 | 3.253 | 13.069 | 6.445 |
2025 farm subsidies in seven farm states

View exact chart values
| state | farm_subsidies_billion_usd |
|---|---|
| Texas | 2.29 |
| Iowa | 2.268 |
| Minnesota | 2.26 |
| Kansas | 1.744 |
| Nebraska | 1.475 |
| Illinois | 1.471 |
| North Dakota | 1.456 |
The quarterly print is not a crash
Annual 2025 is not the last word. Farm proprietors’ income, measured at a seasonally adjusted annual rate, ran at $103.0 billion in 2026 Q1 and $99.5 billion in 2026 Q2. That is an annualized flow, not a quarterly cash total, and it excludes corporate farms. It is also close to the 2022–23 peaks — 2022 Q2 was $107.9 billion SAAR — after a trough near $55–62 billion through much of 2024. The official income line, in other words, had already bounced before the campaign-week promises.
That bounce does not settle the diesel argument. Households in Iowa spent $5.3 billion on motor-vehicle fuels, lubricants and fluids in 2025; Kansas households spent $3.5 billion, according to BEA’s state consumption accounts. Those are family fill-ups, not tractor tanks. They still give a sense of scale: an $8 billion diesel facility is larger than Iowa’s entire household fuel bill. Farm diesel is a producer cost. The household series is a reminder that fuel is already a fat line in these states, and that a one-time payment is not the same thing as a lower price next spring.
U.S. farm proprietors’ income, quarterly annual rate

View exact chart values
| period | farm_proprietors_saar_billion_usd |
|---|---|
| 2018:Q1 | 34.824 |
| 2018:Q2 | 38.012 |
| 2018:Q3 | 30.256 |
| 2018:Q4 | 48.188 |
| 2019:Q1 | 36.647 |
| 2019:Q2 | 26.977 |
| 2019:Q3 | 47.875 |
| 2019:Q4 | 49.813 |
| 2020:Q1 | 48.988 |
| 2020:Q2 | 32.641 |
| 2020:Q3 | 54.691 |
| 2020:Q4 | 90.896 |
| 2021:Q1 | 54.997 |
| 2021:Q2 | 100.193 |
| 2021:Q3 | 93.307 |
| 2021:Q4 | 70.407 |
| 2022:Q1 | 95.62 |
| 2022:Q2 | 107.852 |
| 2022:Q3 | 105.256 |
| 2022:Q4 | 104.596 |
| 2023:Q1 | 108.109 |
| 2023:Q2 | 85.504 |
| 2023:Q3 | 72.028 |
| 2023:Q4 | 55.376 |
| 2024:Q1 | 58.034 |
| 2024:Q2 | 59.319 |
| 2024:Q3 | 61.937 |
| 2024:Q4 | 71.934 |
| 2025:Q1 | 94.908 |
| 2025:Q2 | 89.655 |
| 2025:Q3 | 96.139 |
| 2025:Q4 | 74.894 |
| 2026:Q1 | 102.982 |
| 2026:Q2 | 99.522 |
What the $15 billion can and cannot do
Put the pieces on one shelf. The midterm package is real money. It is smaller than 2025’s farm-subsidy total, a modest slice of national farm income and farm GDP, and larger than Iowa’s or Kansas’s entire farm-proprietors’ book. Farmers who told the Associated Press they were glad to survive the year but still saw a bailout rather than a fix were describing that gap. Gregg Ibendahl at Kansas State asked the lender’s question: how do you finance next year’s crop on a one-time cheque?
The official books cannot answer that. They can say the cheque is arriving after a year when recorded farm subsidies had already jumped, and after two quarters when proprietors’ income, at an annual rate, had already climbed back toward the 2022 peak. They cannot say how much of the $15 billion is new, how much is diesel versus conservation loans versus commodity purchases, or when it hits a farm account. Until USDA publishes the diesel rules, $8 billion is a headline looking for a formula. The BEA ledgers are the part that is already written.
Sources and methods
BEA annual state GDP and income snapshot pinned from the 30 September 2026 regional release (research snapshot dated 8 October 2026). Calendar 2025 annual figures are first-release estimates in that file, not 1 November 2026 observations.
Farm subsidies are SAGDP5, NAICS farms (111-112), thousands of current dollars. BEA records subsidies as negative GDP entries; calculations use absolute values and label them as subsidy dollars. They are industry subsidies in the GDP accounts, not a USDA programme-by-programme scorecard.
Farm proprietors’ income is SAINC30 (annual) and SQINC4 (quarterly). It excludes income of corporate farms. Quarterly values are seasonally adjusted annual rates, not realized quarterly totals.
Farm GDP is SAGDP2 current-dollar farm industry GDP. Motor-vehicle fuels, lubricants and fluids are SAPCE4 household consumption, millions of current dollars — not on-farm diesel purchases.
The $15 billion package, $8 billion diesel slice and $13.8 billion safety-net figure are taken from 1 November 2026 reporting of USDA announcements. They are not BEA observations and are not treated as 2025 outlays. No causal effect is inferred from the comparisons.
State subsidy bars cover seven extracted states with large farm books, not a complete 50-state ranking. Nulls were not recoded as zero. Units and scales were converted from thousands or millions of dollars into billions of current dollars in the saved calculation.
Research completed 2026-11-02, for the November 1, 2026 news edition. The available source data may cover earlier periods; see the observation periods and source vintages above.