Research
Chicago’s 7,000 hotel strikers are a fifth of a payroll that never fully came back
Seven thousand people, in a payroll that is still smaller than it looks
Downtown Chicago’s hotel union says about 7,000 workers at 46 properties have voted 85 percent to authorize a strike after contracts expired on August 31. That is a large walkout threat in any city. It is a very large one once you put it next to the official lodging payroll. In July 2026, the Chicago-Naperville-Schaumburg metropolitan division — the BLS area that covers downtown and a wide ring of suburbs — employed 33,500 people in accommodation, the industry that includes hotels, motels and other lodging. Those 7,000 authorized strikers are about 21 percent of that entire division hotel payroll, and about 14 percent of Illinois’s 49,800 accommodation jobs the same month.
Two caveats, because the union and the statistical agency are not counting the same rooms. The BLS series is not limited to the 46 downtown hotels, and it is not limited to housekeepers, cooks and front-desk agents on a UNITE HERE contract. It also includes motels, inns and other lodging across the division. The comparison still does useful work: even against that broader payroll, a 7,000-person strike is not a rounding error. The same July snapshot shows the Chicago division accounts for about 67 percent of all Illinois hotel jobs. If the walkout comes, it will hit the state’s lodging industry where that industry actually lives.
Chicago’s hotel payroll never fully came back

View exact chart values
| month | illinois_hotels | chicago_division_hotels |
|---|---|---|
| 2015-01 | 47.3 | 32.2 |
| 2015-04 | 50 | 34.3 |
| 2015-07 | 53.8 | 36.3 |
| 2015-10 | 52.6 | 35.7 |
| 2016-01 | 49.8 | 33.9 |
| 2016-04 | 51.8 | 35.2 |
| 2016-07 | 54.6 | 36.8 |
| 2016-10 | 53.6 | 37 |
| 2017-01 | 49.9 | 34.8 |
| 2017-04 | 51.9 | 35.9 |
| 2017-07 | 54.8 | 37.6 |
| 2017-10 | 54.2 | 37.4 |
| 2018-01 | 50.6 | 35.1 |
| 2018-04 | 52.8 | 36.7 |
| 2018-07 | 56.6 | 38.9 |
| 2018-10 | 55.8 | 39.1 |
| 2019-01 | 51.9 | 36.5 |
| 2019-04 | 54.1 | 37.4 |
| 2019-07 | 56.1 | 38.4 |
| 2019-10 | 54.9 | 37.9 |
| 2020-01 | 51.6 | 35.6 |
| 2020-04 | 26.4 | 17.8 |
| 2020-07 | 26.2 | 14.9 |
| 2020-10 | 26.8 | 14.9 |
| 2021-01 | 22.1 | 12.2 |
| 2021-04 | 27.2 | 15.3 |
| 2021-07 | 36.2 | 21.7 |
| 2021-10 | 38.3 | 24.1 |
| 2022-01 | 36.3 | 23.1 |
| 2022-04 | 40.3 | 25.9 |
| 2022-07 | 44.6 | 28.5 |
| 2022-10 | 44.1 | 29.1 |
| 2023-01 | 41.9 | 27.9 |
| 2023-04 | 44.2 | 29.3 |
| 2023-07 | 47.8 | 31.4 |
| 2023-10 | 47.4 | 31.8 |
| 2024-01 | 44.1 | 29.7 |
| 2024-04 | 46.2 | 31.2 |
| 2024-07 | 48.9 | 32.5 |
| 2024-10 | 47.6 | 32.4 |
| 2025-01 | 44.1 | 29.9 |
| 2025-04 | 46.3 | 31.5 |
| 2025-07 | 49.1 | 33 |
| 2025-10 | 47.5 | 32.4 |
| 2026-01 | 44.4 | 30.8 |
| 2026-04 | 45.6 | 31.9 |
| 2026-07 | 49.8 | 33.5 |
The rooms filled back up. The jobs did not
July is peak season for hotel staffing, which is why it is the honest month for a not-seasonally-adjusted comparison. In July 2019, the Chicago division had 38,400 accommodation jobs and Illinois had 56,100. By July 2026 those counts were 33,500 and 49,800 — still 12.8 percent and 11.2 percent short of the last pre-pandemic July. In headcount, Chicago is missing about 4,900 hotel jobs and the state about 6,300. The 7,000 workers who just voted to strike are, in other words, more numerous than the entire remaining hole in the Chicago-division hotel payroll.
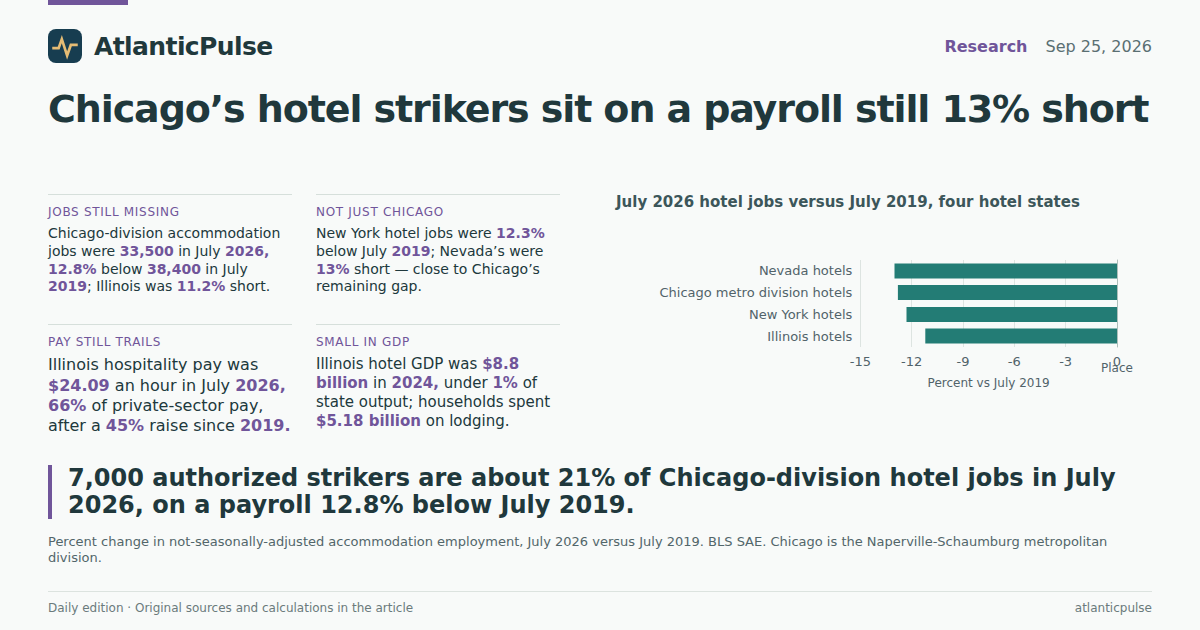
That shortfall is not an Illinois eccentricity. New York’s statewide hotel payroll was 12.3 percent below July 2019 in July 2026 (101,700 versus 116,000). Nevada, the country’s densest hotel economy, was 13 percent short (166,800 versus 191,700). Indexed to July 2019, all four series — Illinois, Chicago, New York, Nevada — are still clustered around 87 to 89. The rooms came back. The staffing charts did not.
The collapse underneath those indexes was violent. Illinois leisure and hospitality employment, seasonally adjusted, fell from 630,500 in February 2020 to 331,000 in April 2020, a 47.5 percent drop in two months. By July 2026 it had climbed back to 604,900 — still 4.1 percent below the pre-pandemic peak, and about 9.8 percent of the state’s 6.18 million nonfarm jobs. Accommodation and food services, the hotels-plus-restaurants slice, stood at 506,200. Nationally, traveler-accommodation jobs were 1.85 million in June 2026, 9.6 percent below February 2020, according to the Current Employment Statistics files. The U.S. series ends a month earlier than the state files in this snapshot; the direction is not in doubt.
Hotel jobs in Illinois, New York and Nevada are still about 12 percent short of 2019

View exact chart values
| year | illinois_index | chicago_index |
|---|---|---|
| 2015 | 95.9 | 94.5 |
| 2016 | 97.3 | 95.8 |
| 2017 | 97.7 | 97.9 |
| 2018 | 100.9 | 101.3 |
| 2019 | 100 | 100 |
| 2020 | 46.7 | 38.8 |
| 2021 | 64.5 | 56.5 |
| 2022 | 79.5 | 74.2 |
| 2023 | 85.2 | 81.8 |
| 2024 | 87.2 | 84.6 |
| 2025 | 87.5 | 85.9 |
| 2026 | 88.8 | 87.2 |
July 2026 hotel jobs versus July 2019, four hotel states

View exact chart values
| place | pct_vs_july_2019 |
|---|---|
| Nevada hotels | -13 |
| Chicago metro division hotels | -12.8 |
| New York hotels | -12.3 |
| Illinois hotels | -11.2 |
Illinois leisure-and-hospitality jobs still sit below the February 2020 peak

View exact chart values
| month | jobs_thousands |
|---|---|
| 2015-01 | 565.2 |
| 2015-02 | 568.6 |
| 2015-03 | 568.9 |
| 2015-04 | 572.8 |
| 2015-05 | 577.8 |
| 2015-06 | 579 |
| 2015-07 | 579.8 |
| 2015-08 | 581.1 |
| 2015-09 | 584 |
| 2015-10 | 586.6 |
| 2015-11 | 589.4 |
| 2015-12 | 594.2 |
| 2016-01 | 593.3 |
| 2016-02 | 592.6 |
| 2016-03 | 592.8 |
| 2016-04 | 595.9 |
| 2016-05 | 594.8 |
| 2016-06 | 595.3 |
| 2016-07 | 597.5 |
| 2016-08 | 597.7 |
| 2016-09 | 600.9 |
| 2016-10 | 601.7 |
| 2016-11 | 606.4 |
| 2016-12 | 601.2 |
| 2017-01 | 604.3 |
| 2017-02 | 607.5 |
| 2017-03 | 609.4 |
| 2017-04 | 609.6 |
| 2017-05 | 610.5 |
| 2017-06 | 612.3 |
| 2017-07 | 611.3 |
| 2017-08 | 614.7 |
| 2017-09 | 613.3 |
| 2017-10 | 613.7 |
| 2017-11 | 613.2 |
| 2017-12 | 611.5 |
| 2018-01 | 613.3 |
| 2018-02 | 613.7 |
| 2018-03 | 617.2 |
| 2018-04 | 614.3 |
| 2018-05 | 616.8 |
| 2018-06 | 619.8 |
| 2018-07 | 619.5 |
| 2018-08 | 620.9 |
| 2018-09 | 618.9 |
| 2018-10 | 619.7 |
| 2018-11 | 619.3 |
| 2018-12 | 620.2 |
| 2019-01 | 621.5 |
| 2019-02 | 621.3 |
| 2019-03 | 621.2 |
| 2019-04 | 621.9 |
| 2019-05 | 622.2 |
| 2019-06 | 624.6 |
| 2019-07 | 624 |
| 2019-08 | 622.7 |
| 2019-09 | 622.2 |
| 2019-10 | 624.1 |
| 2019-11 | 625.7 |
| 2019-12 | 628.7 |
| 2020-01 | 630.2 |
| 2020-02 | 630.5 |
| 2020-03 | 603.1 |
| 2020-04 | 331 |
| 2020-05 | 335.5 |
| 2020-06 | 368.8 |
| 2020-07 | 431.7 |
| 2020-08 | 447.1 |
| 2020-09 | 459 |
| 2020-10 | 466.1 |
| 2020-11 | 433.5 |
| 2020-12 | 410.5 |
| 2021-01 | 424.9 |
| 2021-02 | 456.7 |
| 2021-03 | 469.6 |
| 2021-04 | 481.3 |
| 2021-05 | 488.1 |
| 2021-06 | 501.9 |
| 2021-07 | 522.5 |
| 2021-08 | 526.1 |
| 2021-09 | 532 |
| 2021-10 | 541 |
| 2021-11 | 544 |
| 2021-12 | 550.6 |
| 2022-01 | 548.6 |
| 2022-02 | 551.2 |
| 2022-03 | 555.6 |
| 2022-04 | 558 |
| 2022-05 | 560.1 |
| 2022-06 | 562.9 |
| 2022-07 | 570.6 |
| 2022-08 | 572.5 |
| 2022-09 | 573 |
| 2022-10 | 575.5 |
| 2022-11 | 578.8 |
| 2022-12 | 578 |
| 2023-01 | 589.2 |
| 2023-02 | 589.9 |
| 2023-03 | 591.7 |
| 2023-04 | 589.7 |
| 2023-05 | 589 |
| 2023-06 | 595.2 |
| 2023-07 | 595.7 |
| 2023-08 | 597.2 |
| 2023-09 | 597.9 |
| 2023-10 | 596.3 |
| 2023-11 | 598 |
| 2023-12 | 598.2 |
| 2024-01 | 598.1 |
| 2024-02 | 599.8 |
| 2024-03 | 601.3 |
| 2024-04 | 600.1 |
| 2024-05 | 601.7 |
| 2024-06 | 602.7 |
| 2024-07 | 601.7 |
| 2024-08 | 601.9 |
| 2024-09 | 604.9 |
| 2024-10 | 604.2 |
| 2024-11 | 603.7 |
| 2024-12 | 605.1 |
| 2025-01 | 606.7 |
| 2025-02 | 604.3 |
| 2025-03 | 602.8 |
| 2025-04 | 604.5 |
| 2025-05 | 606.4 |
| 2025-06 | 604 |
| 2025-07 | 605.5 |
| 2025-08 | 605.9 |
| 2025-09 | 603.7 |
| 2025-10 | 605.1 |
| 2025-11 | 602.5 |
| 2025-12 | 603.4 |
| 2026-01 | 602.7 |
| 2026-02 | 601.7 |
| 2026-03 | 602.1 |
| 2026-04 | 605.2 |
| 2026-05 | 607.9 |
| 2026-06 | 608.7 |
| 2026-07 | 604.9 |
The pay went up. It is still two-thirds of everyone else’s
If the jobs are the shortage, the wages are the argument. Illinois leisure-and-hospitality workers averaged $24.09 an hour in July 2026, not seasonally adjusted. All private employees in the state averaged $36.60. Hospitality pay is 66 percent of private-sector pay. That gap is not new, but the catch-up has been real: leisure-and-hospitality hourly earnings are up 44.8 percent from July 2019, against 27.1 percent for the private sector as a whole. Nationally, accommodation workers averaged $25.33 an hour in the latest CES reading, a little above Illinois’s broader hospitality figure.
None of that makes $24 an hour a downtown-Chicago living wage, and none of it tells you what a housekeeper at a specific Michigan Avenue hotel takes home after the service charge. Average hourly earnings mix managers with room attendants and include tips where they are reported. They also do not include benefits, which are usually the point of a hotel contract fight. What the official series can say is simpler: Illinois hospitality workers have had one of the faster nominal raises in the state payroll, and they are still paid like a bargain relative to everyone else on the same survey.
Illinois hospitality pay rose fast. It is still two-thirds of private-sector pay

View exact chart values
| month | leisure_hospitality | total_private |
|---|---|---|
| 2015-01 | 14.07 | 25.84 |
| 2015-07 | 14.17 | 25.8 |
| 2016-01 | 14.55 | 26.59 |
| 2016-07 | 14.67 | 26.41 |
| 2017-01 | 15.11 | 26.93 |
| 2017-07 | 15.13 | 26.88 |
| 2018-01 | 15.47 | 27.21 |
| 2018-07 | 15.8 | 27.75 |
| 2019-01 | 16.58 | 28.43 |
| 2019-07 | 16.64 | 28.79 |
| 2020-01 | 17.56 | 29.45 |
| 2020-07 | 17.34 | 29.79 |
| 2021-01 | 17.98 | 30.65 |
| 2021-07 | 19.08 | 31.36 |
| 2022-01 | 19.98 | 32.6 |
| 2022-07 | 20.97 | 32.72 |
| 2023-01 | 21.24 | 33.3 |
| 2023-07 | 21.7 | 33.68 |
| 2024-01 | 22.65 | 33.81 |
| 2024-07 | 22.62 | 33.68 |
| 2025-01 | 23.39 | 34.81 |
| 2025-07 | 23.88 | 35.07 |
| 2026-01 | 23.99 | 36.43 |
| 2026-07 | 24.09 | 36.6 |
A thin slice of GDP. A fatter slice of the household bill
Hotels are easier to see on Michigan Avenue than they are in the state’s output accounts. Accommodation produced $8.8 billion of Illinois GDP in 2024, the latest year in the BEA state GDP files — 0.73 percent of a $1.20 trillion state economy. Add restaurants and the broader accommodation-and-food-services sector is $39.0 billion, 3.2 percent of GDP, with $21.4 billion in employee compensation, up 33 percent from 2019. Real accommodation output, in 2017 dollars, is actually 12 percent above 2019 after a 24 percent drop in 2020. The industry is producing more, with fewer people on the July payroll than it had before the pandemic. That is not a morality play. It is what a labor shortage looks like on an accountant’s spreadsheet.
Households notice hotels in the bill more than in the GDP share. Illinois residents spent $5.18 billion on accommodations in 2024, 0.67 percent of statewide personal consumption, according to BEA consumer-spending accounts. That is only 9 percent above 2019 in current dollars, after a 57 percent collapse in 2020. Meals and lodging together are a much bigger item: $53.6 billion, about 7 percent of household spending, or $4,219 per person — almost exactly the U.S. average of $4,201, and well below New York ($4,789) and California ($5,373). The hotel strike is not a fight over a huge share of Illinois output. It is a fight over a small, labor-intensive industry that Illinois households still buy at a national-average clip.
What the vote is actually sitting on
Put the pieces next to each other and the strike authorization stops looking like a seasonal tantrum. Chicago’s hotel payroll is still about 13 percent smaller than in the last normal July. The 7,000 workers who voted to walk are a fifth of the remaining lodging jobs in the division that contains downtown. Their industry’s pay has risen faster than the rest of the private sector and remains far below it. The state’s hotel GDP has recovered in real terms; the headcount has not. New York and Nevada, the two other hotel economies worth comparing, are short by similar percentages.
That does not tell you who will blink in bargaining, or whether guests will notice if the walkout comes in waves, hotel by hotel, as the union’s separate contracts allow. It does tell you why a 7,000-person vote is not a small story in a city that privatized its parking meters and still argues about who gets the 5 percent. The rooms are full enough to book. The payroll that turns those rooms over is not the payroll of 2019. The people who do that work have noticed.
Sources and methods
Payroll figures are from the BLS State and Area Employment program, snapshot dated 2026-08-24, with monthly observations through July 2026. National traveler-accommodation employment and accommodation hourly earnings are from the Current Employment Statistics program in the same vintage, with observations through June 2026. Observation months are not release dates.
Statewide leisure-and-hospitality and accommodation-and-food-services job counts are seasonally adjusted. Hotel/accommodation job counts for Illinois, the Chicago-Naperville-Schaumburg metropolitan division, New York and Nevada are not seasonally adjusted; July-to-July comparisons are used to hold season constant. Duplicate SAE series that store annual averages were not used.
Accommodation (NAICS 721) is lodging — hotels, motels and related establishments — not a count of UNITE HERE members at 46 downtown hotels. The Chicago division is larger than the City of Chicago. The 7,000 authorized strikers come from September 25, 2026 reporting, not from BLS. Shares that divide 7,000 by the BLS payroll are an order-of-magnitude comparison, not a union-density estimate.
State GDP, real GDP in chained 2017 dollars, and employee compensation are from BEA annual state accounts, release 2026-04-09. The accommodation GDP line in this extract runs through 2024. Personal consumption expenditures by state are from BEA SAPCE, release 2025-09-26, through 2024. Per capita food-services-and-accommodations spending includes purchased meals, not only hotel bills.
Provider and refresh lag is normal. Missing observations were not treated as zeros. No causal effect is inferred from the strike vote, from wage changes, or from cross-state hotel comparisons.
Research completed 2026-09-26, for the September 25, 2026 news edition. The available source data may cover earlier periods; see the observation periods and source vintages above.