Research
Caterpillar’s $1 billion North Carolina bet, next to a factory payroll that already stalled
A billion dollars, in a state that already builds things
Caterpillar said Wednesday it would invest about $1 billion in North Carolina to expand compact-equipment capacity, including a new plant in Sanford for compact track loaders and telehandlers. The company pointed to rising demand in construction, landscaping, agriculture and material handling. The same report noted a surge in orders for construction equipment amid a nationwide data-center buildout — and for the backup power gear those buildings need. That is a lot of yellow iron for one announcement. It is not, on the official books, a new industrial state.
As of July 2026, North Carolina already had 449,300 seasonally adjusted manufacturing jobs, according to the Bureau of Labor Statistics state payroll survey. That is 8.8 percent of the state’s 5.11 million nonfarm jobs. Durable-goods plants — the broad home of machinery — accounted for 239,300 of those factory jobs, a little more than half. Texas, Ohio, Michigan, Illinois and Indiana all still have larger manufacturing payrolls. Georgia is just behind. A $1 billion plant can change a town. It does not, by itself, reorder that list.
North Carolina is a real factory state — just not the biggest one in this comparison

View exact chart values
| state | jobs_thousands |
|---|---|
| Texas | 979.7 |
| Ohio | 688.7 |
| Michigan | 585.5 |
| Illinois | 571 |
| Indiana | 512 |
| North Carolina | 449.3 |
| Georgia | 426.3 |
| South Carolina | 264.5 |
The hiring that actually showed up was on the jobsite
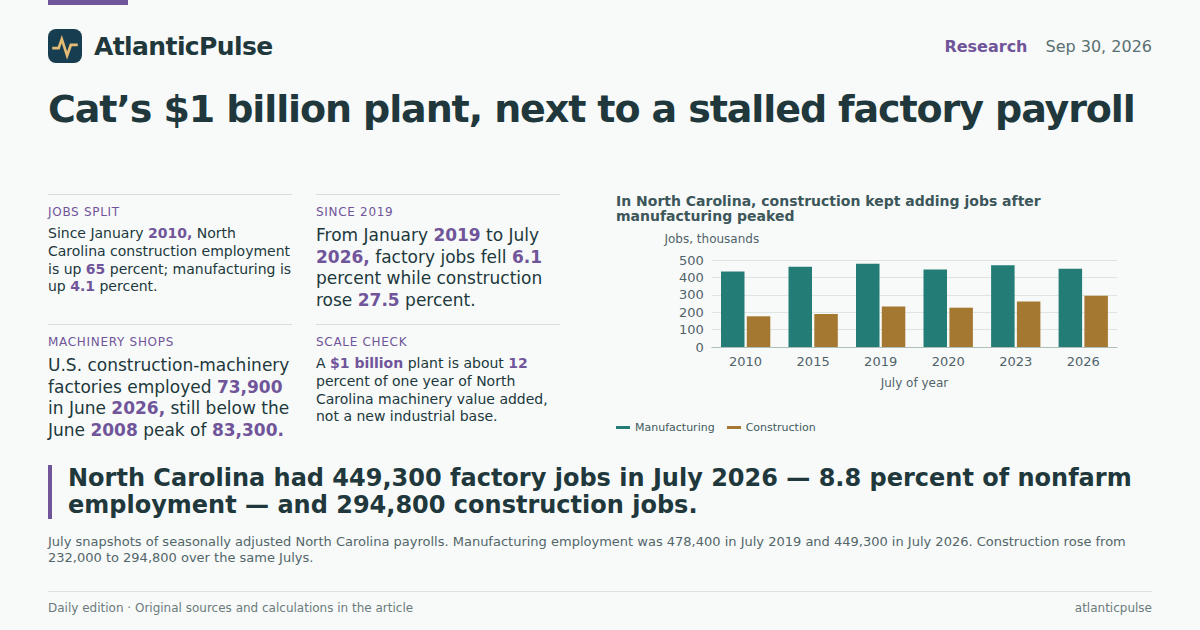
The more striking North Carolina number is not the factory headcount. It is the construction headcount. Seasonally adjusted construction employment in the state reached 294,800 in July 2026, up 65 percent from January 2010. Over the same span, manufacturing rose only 4.1 percent. Total nonfarm payrolls grew 33 percent. Construction is now 5.8 percent of the state’s jobs, still smaller than manufacturing, but it is the sector that kept adding people.
The split is even sharper if the clock starts before the pandemic rather than after the Great Recession. From January 2019 to July 2026, North Carolina manufacturing employment fell 6.1 percent. Construction rose 27.5 percent. From July 2023 to July 2026 — the stretch that overlaps the current data-center boom in the business press — manufacturing was down 4.4 percent and construction was up 13.1 percent. July snapshots make the same point: factory jobs peaked at 478,400 in July 2019 and were 449,300 seven years later. Construction over those Julys went from 232,000 to 294,800.
None of that proves data centers caused the construction surge. The state payroll series does not say who poured which slab. It does say that if Caterpillar is following construction demand into North Carolina, it is following a workforce that has already been hiring — and a factory workforce that has not.
In North Carolina, construction kept adding jobs after manufacturing peaked

View exact chart values
| year | manufacturing_thousands | construction_thousands | durable_goods_thousands | total_nonfarm_thousands |
|---|---|---|---|---|
| 2010 | 434 | 176.6 | 222.6 | 3874.3 |
| 2015 | 461.4 | 189.9 | 248 | 4252.3 |
| 2019 | 478.4 | 232 | 260.3 | 4596.1 |
| 2020 | 446.1 | 226.1 | 240.2 | 4335.7 |
| 2023 | 470 | 260.7 | 251.7 | 4943.6 |
| 2026 | 449.3 | 294.8 | 239.3 | 5112 |
The machines that build the boom are still a small shop
Caterpillar’s own industry is smaller than the rhetoric around it. U.S. construction-machinery manufacturing employed 73,900 people in June 2026, seasonally adjusted, according to the Current Employment Statistics survey. That is 22 percent above January 2010, when the industry was still crawling out of the housing crash, and only 1.8 percent above January 2019. The series peaked at 83,300 jobs in June 2008. Annual averages tell the same story: about 82,200 jobs in 2008, 63,000 in 2010, 75,700 in 2024, and 72,600 in the first half of 2026.
The broader agriculture, construction and mining machinery group — which is what the earnings series covers — employed 201,800 in June 2026, up just 1.2 percent from January 2010. Average hourly earnings in that group were $34.57 in June, $3.03 below the $37.60 total-private average in the same month. These are not software wages with a hard hat. They are a mid-sized durable-goods trade that still has not recaptured its pre-crash peak.
U.S. construction employment as a whole is a different animal: 8.34 million jobs in July 2026, up 50 percent from January 2010. Nonresidential building construction rose 45 percent over that span. Industrial building construction, the closest CES cousin to factories and data halls, was only 8.4 percent above January 2010 as of June 2026 — 165,900 jobs. Indexed to 2010, North Carolina construction and U.S. construction have pulled far ahead of both U.S. manufacturing and U.S. construction-machinery manufacturing. The crews grew. The plants that weld the loaders did not grow in proportion.
North Carolina construction raced ahead. Factory jobs, and the machines that build them, did not

View exact chart values
| month | nc_manufacturing | nc_construction | us_construction_machinery | us_industrial_building | us_construction | us_manufacturing |
|---|---|---|---|---|---|---|
| 2010-01 | 100 | 100 | 100 | 100 | 100 | 100 |
| 2010-04 | 100 | 100.1 | 101.7 | 103.7 | 99.5 | 100.2 |
| 2010-07 | 100.5 | 99 | 105.8 | 103.5 | 98.7 | 100.9 |
| 2010-10 | 100.4 | 98.5 | 107.3 | 101.9 | 98.7 | 100.9 |
| 2011-01 | 100.3 | 94.6 | 108.9 | 99 | 97.3 | 101.4 |
| 2011-04 | 100.5 | 97.5 | 110.1 | 96.9 | 98.3 | 102.1 |
| 2011-07 | 100.6 | 97.9 | 112.6 | 99.2 | 99.4 | 102.5 |
| 2011-10 | 100.5 | 97 | 115.4 | 101.4 | 100.1 | 102.8 |
| 2012-01 | 101.3 | 96.9 | 117.5 | 100.7 | 100.8 | 103.3 |
| 2012-04 | 101.9 | 97.1 | 120.9 | 100.7 | 100.7 | 103.9 |
| 2012-07 | 102.2 | 95.9 | 122 | 99.3 | 100.9 | 104.3 |
| 2012-10 | 102.4 | 96 | 119.5 | 99.3 | 101.7 | 104.3 |
| 2013-01 | 102.5 | 96.2 | 122.4 | 99.6 | 103 | 104.5 |
| 2013-04 | 102.5 | 97.1 | 119.9 | 100.9 | 103.9 | 104.6 |
| 2013-07 | 102.7 | 97.1 | 116.1 | 100.7 | 105 | 104.5 |
| 2013-10 | 103 | 98.1 | 118.2 | 102.4 | 106.3 | 105.1 |
| 2014-01 | 102.9 | 98.7 | 118.5 | 103.9 | 107.3 | 105.3 |
| 2014-04 | 103.5 | 98.9 | 119.4 | 102.5 | 109 | 105.8 |
| 2014-07 | 104 | 100.6 | 119.4 | 101.9 | 110.7 | 106.3 |
| 2014-10 | 105.1 | 102.5 | 119.2 | 103.8 | 112.2 | 106.9 |
| 2015-01 | 106.1 | 103.1 | 119.9 | 104.9 | 113.3 | 107.1 |
| 2015-04 | 106.6 | 104.3 | 120 | 104.2 | 114.6 | 107.4 |
| 2015-07 | 106.9 | 106.4 | 118.2 | 106.1 | 116 | 107.7 |
| 2015-10 | 107.7 | 107.8 | 116.4 | 105.1 | 117.3 | 107.7 |
| 2016-01 | 107.9 | 110 | 112.9 | 107 | 118.8 | 107.9 |
| 2016-04 | 108 | 111.8 | 109.9 | 108 | 120.1 | 107.7 |
| 2016-07 | 107.8 | 112.4 | 107 | 105.2 | 120.7 | 107.8 |
| 2016-10 | 107.6 | 113.8 | 104.1 | 105.1 | 121.8 | 107.6 |
| 2017-01 | 107.9 | 114.3 | 103.3 | 106.3 | 122.6 | 107.7 |
| 2017-04 | 108.3 | 116.1 | 104.5 | 102.9 | 123.9 | 108 |
| 2017-07 | 108.5 | 117.1 | 106 | 106.9 | 124.9 | 108.2 |
| 2017-10 | 108.9 | 118.4 | 108.9 | 106.4 | 126 | 108.8 |
| 2018-01 | 109 | 120.6 | 112.4 | 103.5 | 127.1 | 109.4 |
| 2018-04 | 109.7 | 122 | 115.1 | 113.1 | 129.2 | 110 |
| 2018-07 | 110.3 | 123.7 | 117.4 | 113.1 | 131.1 | 110.7 |
| 2018-10 | 110.8 | 126.8 | 119 | 111.9 | 132.4 | 111.2 |
| 2019-01 | 110.8 | 129.6 | 120.2 | 108.2 | 133.1 | 111.7 |
| 2019-04 | 110.7 | 128.8 | 120.9 | 106.6 | 133.8 | 111.7 |
| 2019-07 | 110.8 | 130 | 122.2 | 105.2 | 134.9 | 111.7 |
| 2019-10 | 110.7 | 131.3 | 121.5 | 105.2 | 135.4 | 111.2 |
| 2020-01 | 110.1 | 130.7 | 118.4 | 105.1 | 135.8 | 111.3 |
| 2020-04 | 98.6 | 124.9 | 115.2 | 84.3 | 116.9 | 99.4 |
| 2020-07 | 103.3 | 126.7 | 110.8 | 86 | 129 | 104.6 |
| 2020-10 | 105 | 128.9 | 108.3 | 90.8 | 130.8 | 105.6 |
| 2021-01 | 106.3 | 132.1 | 107.9 | 88.8 | 131.9 | 106.1 |
| 2021-04 | 106.6 | 133.5 | 107.3 | 89.3 | 132.6 | 106.5 |
| 2021-07 | 107 | 134 | 110.6 | 92 | 133.1 | 107.5 |
| 2021-10 | 108.2 | 134.5 | 114.9 | 92.7 | 134.7 | 108.8 |
| 2022-01 | 108.2 | 135.8 | 117.5 | 93.1 | 136.1 | 109.8 |
| 2022-04 | 109.6 | 138 | 118.9 | 96.8 | 138 | 111.2 |
| 2022-07 | 110 | 139.3 | 119 | 95.2 | 139.6 | 111.8 |
| 2022-10 | 110.2 | 140.4 | 120 | 94.8 | 140.6 | 112.5 |
| 2023-01 | 109.8 | 143.6 | 122.8 | 98.8 | 142.2 | 112.7 |
| 2023-04 | 109.2 | 144.2 | 122 | 99.7 | 142.6 | 112.6 |
| 2023-07 | 108.8 | 146.1 | 123.7 | 102 | 143.7 | 112.4 |
| 2023-10 | 108.5 | 149.3 | 124.8 | 103.5 | 144.8 | 112.1 |
| 2024-01 | 108.3 | 150.2 | 124.2 | 105.1 | 145.6 | 112.5 |
| 2024-04 | 108.2 | 152 | 126.7 | 105.8 | 146.4 | 112.1 |
| 2024-07 | 108 | 153 | 126.8 | 107.4 | 147.1 | 111.9 |
| 2024-10 | 107.7 | 152.9 | 123.5 | 110.3 | 148.1 | 110.9 |
| 2025-01 | 107.3 | 154 | 121.7 | 110.7 | 148.1 | 110.7 |
| 2025-04 | 107.2 | 155.4 | 120.4 | 108.2 | 148.2 | 110.6 |
| 2025-07 | 106.3 | 156.6 | 117.7 | 107.5 | 148 | 110.3 |
| 2025-10 | 105.7 | 157.5 | 121 | 103.4 | 147.7 | 110.1 |
| 2026-01 | 104.5 | 160.4 | 120 | 105.6 | 149.1 | 109.9 |
| 2026-04 | 104.7 | 162.9 | 118.4 | 108.8 | 149 | 110 |
| 2026-06 | 104.3 | 164.8 | 122.4 | 108.4 | 149.1 | 110.1 |
America’s construction-machinery factories never recaptured their 2008 peak

View exact chart values
| year | jobs_thousands |
|---|---|
| 1990 | 75 |
| 1991 | 67.2 |
| 1992 | 63.3 |
| 1993 | 67.2 |
| 1994 | 65.8 |
| 1995 | 69.5 |
| 1996 | 75.2 |
| 1997 | 77.4 |
| 1998 | 80.6 |
| 1999 | 80.7 |
| 2000 | 79.9 |
| 2001 | 71.3 |
| 2002 | 63.2 |
| 2003 | 59.2 |
| 2004 | 63.2 |
| 2005 | 71.4 |
| 2006 | 77.7 |
| 2007 | 78.9 |
| 2008 | 82.2 |
| 2009 | 66.7 |
| 2010 | 63 |
| 2011 | 68 |
| 2012 | 73 |
| 2013 | 71.9 |
| 2014 | 72.1 |
| 2015 | 71.4 |
| 2016 | 65 |
| 2017 | 64.3 |
| 2018 | 70.4 |
| 2019 | 73.2 |
| 2020 | 67.9 |
| 2021 | 66.9 |
| 2022 | 71.9 |
| 2023 | 74.6 |
| 2024 | 75.7 |
| 2025 | 72.5 |
| 2026 | 72.6 |
A $1 billion plant is real money. It is not a new machinery economy.
On the output side, North Carolina is already a manufacturing state of some size. Bureau of Economic Analysis figures put the state’s manufacturing GDP at $103.4 billion in 2025, 11.6 percent of an $894 billion economy. Construction GDP was $43.2 billion that year, 4.8 percent of the total — and 238 percent larger than in 2010, which is a reminder that construction’s job surge has a matching value-added surge in current dollars. Machinery manufacturing, the NAICS industry that includes Caterpillar’s compact line, is much smaller and one year less current: $8.65 billion in 2024, about 8.3 percent of that year’s manufacturing GDP.
A $1 billion investment is about 12 percent of one year of North Carolina machinery value added, and about 1 percent of 2025 manufacturing GDP. That comparison is a scale check, not an accounting identity. Capital spending is not the same as annual output, the dollars land over several years, and BEA figures are current-dollar value added, not plant budgets. California’s manufacturing GDP was $385 billion in 2025; Texas’s was $332 billion; Illinois’s was $133 billion. North Carolina is in the game. It is not writing a new rulebook.
The scatter of industrial-building jobs against construction-machinery jobs since 2010 is the quietest chart in this package, and maybe the most useful. The two series did not rise together after 2020. Industrial-building employment fell harder in the pandemic year and recovered later; machinery employment wobbled in a much narrower band. If the data-center boom were already a full-employment program for both the people who pour concrete and the people who build the loaders, those dots would march up and to the right. They do not. Caterpillar can still be right that compact equipment is busy. The official payroll just says the busy-ness is showing up more clearly on North Carolina jobsites than in America’s construction-machinery shops.
Industrial-building crews and construction-machinery shops have not moved in lockstep

View exact chart values
| year | industrial_building_thousands | construction_machinery_thousands |
|---|---|---|
| 2010 | 155.2 | 63 |
| 2011 | 151.3 | 68 |
| 2012 | 153.4 | 73 |
| 2013 | 155 | 71.9 |
| 2014 | 157.3 | 72.1 |
| 2015 | 162 | 71.4 |
| 2016 | 161.8 | 65 |
| 2017 | 162.4 | 64.3 |
| 2018 | 169.8 | 70.4 |
| 2019 | 162 | 73.2 |
| 2020 | 140.3 | 67.9 |
| 2021 | 139.1 | 66.9 |
| 2022 | 145.6 | 71.9 |
| 2023 | 155.3 | 74.6 |
| 2024 | 164.7 | 75.7 |
| 2025 | 163.7 | 72.5 |
| 2026 | 164.7 | 72.6 |
Sources and methods
Payroll figures are seasonally adjusted monthly estimates from the Bureau of Labor Statistics Current Employment Statistics (national) and State and Area Employment (state) programs, drawn from the August 24, 2026 bulk snapshots. Most North Carolina and U.S. total series run through July 2026; U.S. construction-machinery manufacturing, the broader agriculture-construction-mining machinery group, industrial-building construction, and that group’s hourly earnings run through June 2026. Employment is in thousands of jobs; earnings are dollars per hour for all employees. Duplicate period rows were dropped by keeping the first observation per period. Missing values were not treated as zeros.
State GDP figures are Bureau of Economic Analysis annual current-dollar value added from the April 9, 2026 regional release, covering 2025 for all-industry, manufacturing and construction totals and 2024 for machinery manufacturing (NAICS 333), which had not yet published a 2025 value in this extract. Shares use the matching year. Comparing a multi-year capital investment with one year of value added is a scale illustration only; it is not a rate of return, a jobs forecast, or a claim that the plant equals 12 percent of the industry. Indexes use January 2010 = 100. Annual averages for the scatter and machinery history are unweighted means of available monthly observations in each calendar year, so 2026 is a partial year.
These series describe employment and output levels. They do not identify data-center projects, Caterpillar’s own headcount, or causal effects of the announced investment. Construction employment includes residential and nonresidential work; industrial-building construction is a narrower national series and is not a census of data halls. Compact track loaders and telehandlers are used across construction, not only in data centers. Provider refresh lag is normal: the payroll snapshot predates the September 30, 2026 announcement and is not same-day observation.
Research completed 2026-10-01, for the September 30, 2026 news edition. The available source data may cover earlier periods; see the observation periods and source vintages above.