Research
California’s power bills rose fast. They still are not the country’s highest.
The rate scare, and the quieter bill
California lawmakers spent this week advancing plug-in balcony solar, community solar and virtual-power-plant bills on the argument that electricity rates have doubled over the past decade. That is a political sentence with a household punchline: if the lights are that expensive, maybe a 400-watt panel on a railing is not a hobby. At the same time, governors from Harrisburg to Columbus were putting new guardrails on data centers, which use more power than small cities and are accused of shoving the tab onto everyone else’s bill.
Those two fights share a premise that is easy to shout and hard to measure. Retail rates are not the same as what households actually spend. A high price per kilowatt-hour can still produce a modest bill if people use less power; a cheap rate in a hot state can produce a fat one. Bureau of Economic Analysis household electricity spending, divided by resident population, and regional price parities for utilities make that split visible. They do not prove what a data center will do to next year’s bill. They do show whether California’s decade of rate panic shows up in the checkbook — and whether the states now recruiting, or rejecting, server farms start from cheap power or expensive power.
California’s decade was real. It was not a doubling of the bill.
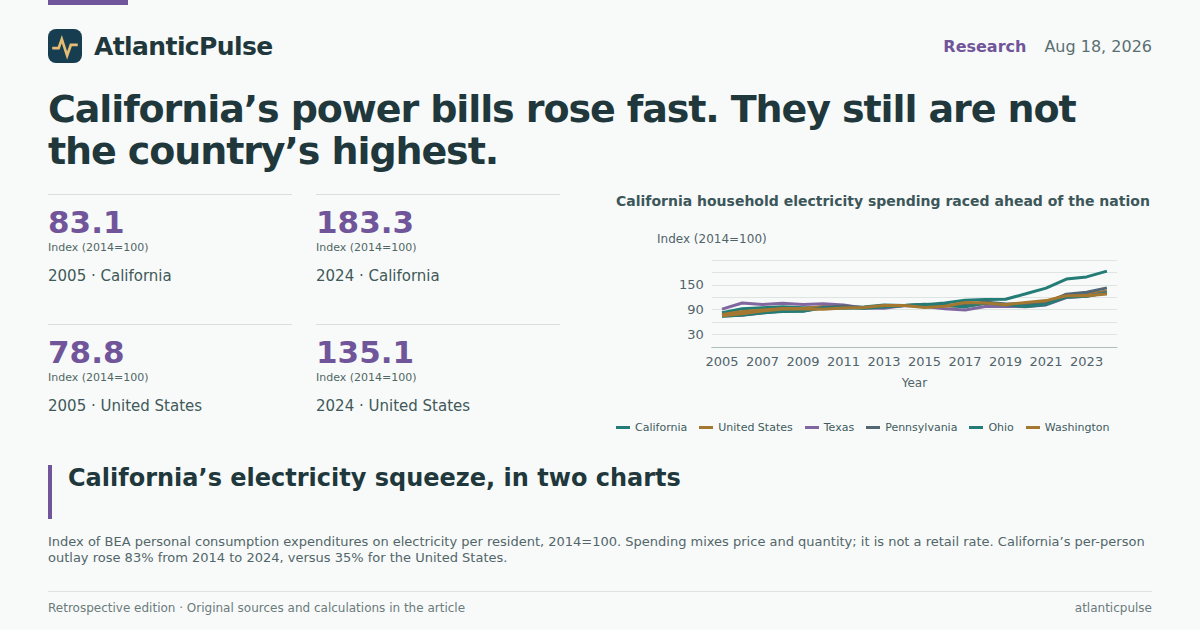
From 2014 to 2024, California households’ electricity spending rose from about $388 per resident to about $711, an 83% increase in current dollars. Over the same decade the United States rose 35%, from about $552 to about $745. Index the two series to 2014 and California’s line leaves the pack after 2019, then steepens again in 2022. Pennsylvania, Ohio, Texas, New York, Hawaii and Washington all finished 2024 between 28% and 43% above their 2014 levels. California finished 83% above.
That is a large gap. It is not the doubling that advocates keep citing, and it is not a pure rate. BEA electricity spending is price times quantity: what households consumed, in millions of current dollars, not the cents-per-kWh tariff on a utility website. A milder winter, more air-conditioning, or a smaller apartment all move the number. Inflation does too. The comparison still matters because the same method is applied everywhere. On that basis, California’s household electricity outlay grew more than twice as fast as the country’s.
Here is the twist that does not fit on a rally sign: even after that sprint, Californians still spent less per person in 2024 than the national average — $711 against $745. Electricity remained about 1% of California personal consumption, versus about 1.3% nationally. The state is expensive at the meter and comparatively modest in the shopping cart, which is another way of saying Californians use less of the stuff they complain about.
California household electricity spending raced ahead of the nation

View exact chart values
| year | ca | us | tx | pa | oh | ny | hi | wa |
|---|---|---|---|---|---|---|---|---|
| 2005 | 83.1 | 78.8 | 91.6 | 75 | 74.2 | 81 | 72.6 | 75.5 |
| 2006 | 92.5 | 85.4 | 106.3 | 76.8 | 77.1 | 86.8 | 80.9 | 80.2 |
| 2007 | 94.9 | 89.2 | 102.6 | 81.9 | 82.8 | 88.4 | 84.1 | 86.8 |
| 2008 | 97 | 92.7 | 105.7 | 87.1 | 85.6 | 94.3 | 101.4 | 91.8 |
| 2009 | 94.9 | 92.8 | 102.7 | 86.7 | 86.2 | 90.4 | 87.8 | 91.5 |
| 2010 | 95.4 | 97.7 | 104.2 | 95.3 | 94.9 | 95.4 | 93.8 | 91.2 |
| 2011 | 94 | 96.9 | 101.1 | 98.8 | 94.1 | 93.9 | 101 | 94.2 |
| 2012 | 96.8 | 94.1 | 93.8 | 95 | 93.7 | 90.3 | 104 | 95.1 |
| 2013 | 101.1 | 96.8 | 93.5 | 97.5 | 96.5 | 96.6 | 99.4 | 100.2 |
| 2014 | 100 | 100 | 100 | 100 | 100 | 100 | 100 | 100 |
| 2015 | 101.8 | 100 | 98 | 103.3 | 102.7 | 95.5 | 86.6 | 95 |
| 2016 | 106.1 | 98.9 | 92.5 | 101.1 | 101.4 | 91.8 | 80 | 98.5 |
| 2017 | 112.7 | 98.6 | 89.4 | 100.8 | 96.9 | 91.9 | 81 | 107.5 |
| 2018 | 114.9 | 105.2 | 97.7 | 108.5 | 106.1 | 97.8 | 87 | 106.4 |
| 2019 | 115.1 | 102.8 | 98.2 | 103.8 | 101.8 | 94.9 | 88.4 | 102.1 |
| 2020 | 128.4 | 104.7 | 97.2 | 103.8 | 97.9 | 99.5 | 94.9 | 107.5 |
| 2021 | 142.2 | 109.5 | 101.7 | 104.6 | 102.9 | 107.1 | 98.5 | 111.9 |
| 2022 | 164 | 126.4 | 119.5 | 127.4 | 120.1 | 132.1 | 121.6 | 123.5 |
| 2023 | 169.3 | 127.4 | 122.4 | 132.1 | 122.6 | 126 | 121.9 | 123.6 |
| 2024 | 183.3 | 135.1 | 131.2 | 142.6 | 131 | 134 | 132.6 | 128 |
The states with the fattest bills are not the ones with the priciest power
Line up 2024 spending and the ranking looks like a summer map, not a California-exception map. Louisiana led this group at about $909 per person, then Florida at $856, Texas at $810 and Hawaii at $832. California sat below the U.S. average, with Ohio at $697 and Washington at $640. New Jersey, another high-cost coastal state, came in at $680. If the political story is that California uniquely cannot afford its grid, the checkbook says several hotter, cheaper-rate states are writing larger electricity checks.
That is not a moral about air-conditioning. It is a warning against treating a retail rate as a household budget. Data-center opponents in Texas, Arizona and Louisiana often argue that new load will raise bills in places where people already run the compressor all afternoon. The spending data says those households are already outspending California. It does not say the next gigawatt will be free.
Hot states still spend more per person than high-price California

View exact chart values
| state | code | pc_elec | pct_change_2014 |
|---|---|---|---|
| Washington | wa | 640 | 28 |
| New Jersey | nj | 679.6 | 16.3 |
| Ohio | oh | 696.9 | 31 |
| California | ca | 711.3 | 83.3 |
| New York | ny | 740 | 34 |
| United States | us | 745.4 | 35.1 |
| Arizona | az | 749.9 | 29.1 |
| Pennsylvania | pa | 773.8 | 42.6 |
| Texas | tx | 810.3 | 31.2 |
| Hawaii | hi | 831.8 | 32.6 |
| Florida | fl | 855.9 | 36.4 |
| Louisiana | la | 908.7 | 40.6 |
On price, California really did pull away
Price parities tell the other half. BEA’s utility regional price parity indexes electricity, gas, water and sanitation against a national average of 100. It is not a pure power tariff, and the U.S. row in the file sits a little under 100 because of how the agency constructs the series, but state-to-state gaps are the point. California’s utility index rose from 128 in 2014 to 159 in 2024. That is 59% above the national average, and a much sharper climb than California’s all-items price parity, which was about 111 in 2024. Utilities, not the whole grocery basket, are where the state ran hot.
Hawaii remains in a class of its own, near 190. Massachusetts jumped from 110 in 2014 to 152 in 2024, the steepest rise in this set. New York was about 134, Connecticut 146. At the other end, Louisiana’s 2024 index was 71, Texas 88, Wisconsin 90, Florida 90, Arizona 92, Washington 93 and Ohio 96. Pennsylvania, a data-center battleground whose governor just tightened the rules, sat at 109 — above average, but not California.
So the decade did rearrange the price map. California and several Northeast states got relatively more expensive. Several Sun Belt hosts of new campuses stayed cheap. If data centers shop for low industrial rates, that is where the brochure photos come from. If households fear that those campuses will import California-style bills, the starting point in Texas or Louisiana is still a long way from Sacramento.
California utility prices pulled away from the national average

View exact chart values
| year | ca | us | tx | pa | oh | ny | az | hi | nj | wa | fl | la | ct | ma | wi |
|---|---|---|---|---|---|---|---|---|---|---|---|---|---|---|---|
| 2008 | 111.4 | 98.5 | 101.4 | 109 | 98.8 | 147.6 | 96.4 | 210.6 | 132.5 | 79.7 | 98.6 | 87.8 | 154.5 | 150 | 99.1 |
| 2009 | 112.8 | 98.5 | 96.2 | 111.9 | 99.7 | 145.8 | 96.3 | 180.3 | 135 | 81.9 | 101.2 | 73.1 | 157.1 | 142.6 | 98.4 |
| 2010 | 117.2 | 98.7 | 98.1 | 110.3 | 94.2 | 140.7 | 104.3 | 161.4 | 130.4 | 84.6 | 96.2 | 80.1 | 146.7 | 114.2 | 99.7 |
| 2011 | 115.3 | 98.7 | 94.4 | 113.7 | 93.1 | 138.3 | 104.3 | 214.6 | 128.3 | 87.3 | 95.3 | 78.4 | 138.3 | 120.2 | 96.7 |
| 2012 | 117.1 | 98.7 | 93.1 | 110.1 | 93.4 | 131.7 | 100.5 | 209.7 | 126.4 | 89.9 | 93.5 | 75 | 135.1 | 127.4 | 96.2 |
| 2013 | 121.4 | 98.7 | 95.7 | 110.4 | 95 | 133.8 | 99 | 210 | 122.7 | 92.1 | 93.6 | 80 | 134.2 | 115.5 | 98.3 |
| 2014 | 128.3 | 98.6 | 94.9 | 102.3 | 91.9 | 130.4 | 100.3 | 195.3 | 111.2 | 90.4 | 95.3 | 80.7 | 135.6 | 110 | 95.9 |
| 2015 | 129.3 | 98.5 | 91.1 | 103.6 | 91.3 | 123.2 | 101 | 176.9 | 107.4 | 95.3 | 92.4 | 79.1 | 139.1 | 117.7 | 96.7 |
| 2016 | 129.5 | 98.5 | 91.9 | 105.3 | 88.5 | 124.5 | 97.5 | 168.7 | 112 | 93.6 | 89.9 | 78.6 | 142.8 | 133.2 | 96.7 |
| 2017 | 130.7 | 98.5 | 88 | 108.4 | 89 | 128.6 | 99 | 170 | 110.6 | 92.7 | 87.5 | 77.8 | 144.6 | 148.8 | 97 |
| 2018 | 125.1 | 98.4 | 87.5 | 111.4 | 94.5 | 135.4 | 99.8 | 195.3 | 113.3 | 94.5 | 91.1 | 76.5 | 140.7 | 151.7 | 97.8 |
| 2019 | 131 | 98.5 | 87.7 | 112.6 | 90.7 | 133.7 | 92.6 | 203.8 | 117.2 | 97.2 | 94.4 | 77.4 | 143.4 | 150.4 | 93 |
| 2020 | 133.5 | 98.6 | 85 | 109 | 91.3 | 138.7 | 90 | 189.8 | 120.7 | 97.2 | 89.8 | 76.8 | 159.9 | 162.3 | 93.9 |
| 2021 | 144.2 | 98.7 | 86.2 | 106.1 | 91.9 | 137.9 | 87.8 | 182 | 115.5 | 92.2 | 90 | 80.7 | 146.5 | 155.8 | 95.4 |
| 2022 | 152.3 | 98.6 | 88.7 | 109.8 | 87.6 | 129.7 | 87.2 | 196.4 | 105.5 | 85.7 | 94.8 | 84.3 | 140 | 151.3 | 89.9 |
| 2023 | 147.3 | 98.6 | 92.4 | 118.3 | 89.2 | 135.4 | 83.3 | 191.7 | 114.8 | 84 | 93.7 | 76.7 | 153.2 | 166.1 | 89.5 |
| 2024 | 158.9 | 98.4 | 87.5 | 109.3 | 95.8 | 134.4 | 92.3 | 190.2 | 114.2 | 92.9 | 90.1 | 71.5 | 146.5 | 152.1 | 89.9 |
Where household utilities cost more than the national average

View exact chart values
| state | rpp_2024 | rpp_2014 | rpp_change |
|---|---|---|---|
| Louisiana | 71.5 | 80.7 | -9.2 |
| Texas | 87.5 | 94.9 | -7.4 |
| Wisconsin | 89.9 | 95.9 | -6 |
| Florida | 90.1 | 95.3 | -5.2 |
| Arizona | 92.3 | 100.3 | -8 |
| Washington | 92.9 | 90.4 | 2.5 |
| Ohio | 95.8 | 91.9 | 4 |
| Pennsylvania | 109.3 | 102.3 | 7 |
| New Jersey | 114.2 | 111.2 | 3 |
| New York | 134.4 | 130.4 | 4 |
| Connecticut | 146.5 | 135.6 | 10.9 |
| Massachusetts | 152.1 | 110 | 42.1 |
| California | 158.9 | 128.3 | 30.6 |
| Hawaii | 190.2 | 195.3 | -5.2 |
What this means for the solar bills — and for the server farms
Put price on one axis and spending on the other and the states fall into camps. California and Hawaii are expensive and only middling in per-person outlays: people pay a lot for each unit and then, relatively, do not buy as many units. Texas, Florida and Louisiana are the reverse: cheaper utility prices, fatter household spending. Ohio and Washington cluster toward cheaper prices and lower spending. New York sits high on price without leading on the bill.
That scatter is descriptive, not a verdict on balcony solar or on OpenAI’s 8-gigawatt Ohio lease. Household electricity in the BEA accounts does not include the industrial load of a hyperscale campus, and a price parity is not a forecast of what happens when 4 gigawatts show up on a rural feeder. The useful caution is simpler. California’s distributed-energy bills are aimed at a real, decade-long jump in what residents spend and at utility prices that have pulled far above the national average. They are not aimed at the highest household electricity budgets in the country. Those still belong to hot states with cheaper power and bigger air conditioners — several of which are the same places now arguing over who pays for the next data center.
High prices and high bills are not the same map

View exact chart values
| state | pc_elec | rpp |
|---|---|---|
| California | 711.3 | 158.9 |
| Texas | 810.3 | 87.5 |
| Pennsylvania | 773.8 | 109.3 |
| Ohio | 696.9 | 95.8 |
| New York | 740 | 134.4 |
| Arizona | 749.9 | 92.3 |
| Hawaii | 831.8 | 190.2 |
| New Jersey | 679.6 | 114.2 |
| Washington | 640 | 92.9 |
| Florida | 855.9 | 90.1 |
| Louisiana | 908.7 | 71.5 |
Sources and methods
This is retrospective enrichment using pinned catalogue snapshots, not an as-known-on-the-edition-date reconstruction. Research was run on 11 September 2026 against extracts retrieved that day. The AtlanticPulse edition date is 18 August 2026.
Household electricity spending is BEA Personal Consumption Expenditures by state, SAPCE3 line for electricity, millions of current dollars, annual, not seasonally adjusted, snapshot bea-sapce-2025-09-26 covering calendar years 2005–2024. Per-person figures divide that total by BEA State annual personal income summary population (persons), snapshot bea-regional-state-annual-2026-04-09. Population includes civilian and military residents. Aggregate dollars are not household averages; missing observations were not treated as zero.
Utility prices are BEA state regional price parities for services: utilities, index with a national average of 100, snapshot bea-rpp-2026-02-19, years 2008–2024. The series covers electricity, gas, water supply and sanitation, not electricity alone. The geo:us row in that file is slightly below 100; state comparisons use the published 100 national average as the reference described in BEA documentation. California’s all-items RPP is cited only as context for the utilities series.
Indexed series use 2014 as 100 because that is the start of the decade invoked in the California reporting. Percent changes are simple ratios of current-dollar per-person spending and are not inflation-adjusted except insofar as RPPs already express relative prices. The state set is a selected comparison group tied to this edition’s reporting (California plus data-center and high-price coastal states), not a ranking of all 50 states.
These series measure household consumption, not industrial or data-center load, and cannot support causal claims about bills, rates, solar adoption or future campuses. Later BEA revisions may change the figures.
Research completed 2026-09-11, for the August 18, 2026 news edition. This is retrospective analysis, not a reconstruction of information available that day.