Research
Builder confidence is at a 2012 low. Construction output is not.
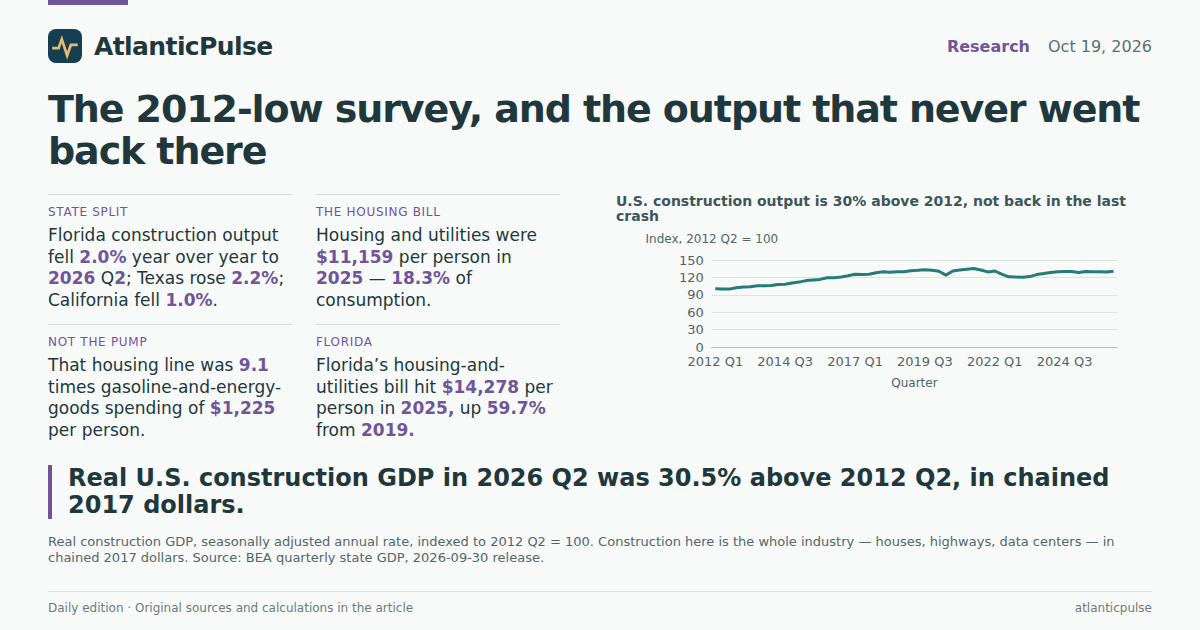
The survey says 2012. The output books do not.
Monday’s NAHB/Wells Fargo Housing Market Index dropped to 29, the weakest reading since June 2012. The 30-year mortgage averaged 7.40 percent last week, buyer traffic is the worst since April 2012 outside the pandemic, and 43 percent of builders are cutting prices. If you lived through the last housing crash, that combination of numbers is enough to make a person check the attic for unsold drywall.
The official output books tell a different story. Real U.S. construction GDP — houses, highways, data centers, the lot — ran at an $870 billion seasonally adjusted annual rate in the second quarter of 2026, in chained 2017 dollars. That is 30.5 percent above the second quarter of 2012, the last time builder morale looked like this. It is also 3.6 percent below the 2021 Q2 peak of $902.5 billion. Construction’s share of real GDP has slipped to 3.56 percent, from 3.82 percent in 2012 Q2 and more than 4 percent in the mid-2010s. The industry is smaller relative to the economy than it was when the last crash ended. It is not small in the 2012 sense.
These figures come from the Bureau of Economic Analysis’s quarterly state GDP accounts, published at a seasonally adjusted annual rate. They measure the whole construction sector, not just single-family housing. A data-center slab and a highway interchange count. That is the point: a homebuilder survey can look like 2012 while the industry’s real output does not.
U.S. construction output is 30% above 2012, not back in the last crash

View exact chart values
| period | period_start | construction_saar_bil_ch2017 | total_gdp_saar_bil_ch2017 | construction_share_pct | index_2012q2 |
|---|---|---|---|---|---|
| 2012 Q1 | 2012-01-01 | 668.46 | 17367 | 3.85 | 100.3 |
| 2012 Q2 | 2012-04-01 | 666.75 | 17444.5 | 3.82 | 100 |
| 2012 Q3 | 2012-07-01 | 665.19 | 17469.7 | 3.81 | 99.8 |
| 2012 Q4 | 2012-10-01 | 680.31 | 17489.9 | 3.89 | 102 |
| 2013 Q1 | 2013-01-01 | 689.7 | 17662.4 | 3.9 | 103.4 |
| 2013 Q2 | 2013-04-01 | 691.94 | 17709.7 | 3.91 | 103.8 |
| 2013 Q3 | 2013-07-01 | 704.8 | 17860.5 | 3.95 | 105.7 |
| 2013 Q4 | 2013-10-01 | 703.85 | 18016.1 | 3.91 | 105.6 |
| 2014 Q1 | 2014-01-01 | 707.2 | 17954 | 3.94 | 106.1 |
| 2014 Q2 | 2014-04-01 | 719.88 | 18185.9 | 3.96 | 108 |
| 2014 Q3 | 2014-07-01 | 721.91 | 18406.9 | 3.92 | 108.3 |
| 2014 Q4 | 2014-10-01 | 735.9 | 18500 | 3.98 | 110.4 |
| 2015 Q1 | 2015-01-01 | 746.14 | 18666.6 | 4 | 111.9 |
| 2015 Q2 | 2015-04-01 | 763.34 | 18782.2 | 4.06 | 114.5 |
| 2015 Q3 | 2015-07-01 | 770.8 | 18857.4 | 4.09 | 115.6 |
| 2015 Q4 | 2015-10-01 | 777.35 | 18892.2 | 4.11 | 116.6 |
| 2016 Q1 | 2016-01-01 | 796.48 | 19001.7 | 4.19 | 119.5 |
| 2016 Q2 | 2016-04-01 | 795.88 | 19062.7 | 4.18 | 119.4 |
| 2016 Q3 | 2016-07-01 | 805.28 | 19197.9 | 4.19 | 120.8 |
| 2016 Q4 | 2016-10-01 | 819.8 | 19304.4 | 4.25 | 123 |
| 2017 Q1 | 2017-01-01 | 836.14 | 19398.3 | 4.31 | 125.4 |
| 2017 Q2 | 2017-04-01 | 833.16 | 19506.9 | 4.27 | 125 |
| 2017 Q3 | 2017-07-01 | 837.16 | 19660.8 | 4.26 | 125.6 |
| 2017 Q4 | 2017-10-01 | 854.42 | 19882.4 | 4.3 | 128.1 |
| 2018 Q1 | 2018-01-01 | 864.94 | 20044.1 | 4.32 | 129.7 |
| 2018 Q2 | 2018-04-01 | 859.86 | 20150.5 | 4.27 | 129 |
| 2018 Q3 | 2018-07-01 | 865.26 | 20276.2 | 4.27 | 129.8 |
| 2018 Q4 | 2018-10-01 | 864.95 | 20304.9 | 4.26 | 129.7 |
| 2019 Q1 | 2019-01-01 | 877.3 | 20431.6 | 4.29 | 131.6 |
| 2019 Q2 | 2019-04-01 | 881.54 | 20602.3 | 4.28 | 132.2 |
| 2019 Q3 | 2019-07-01 | 887.6 | 20843.3 | 4.26 | 133.1 |
| 2019 Q4 | 2019-10-01 | 882.72 | 20985.4 | 4.21 | 132.4 |
| 2020 Q1 | 2020-01-01 | 870.08 | 20709.2 | 4.2 | 130.5 |
| 2020 Q2 | 2020-04-01 | 826.2 | 19078 | 4.33 | 123.9 |
| 2020 Q3 | 2020-07-01 | 873.39 | 20558.9 | 4.25 | 131 |
| 2020 Q4 | 2020-10-01 | 884.09 | 20791.9 | 4.25 | 132.6 |
| 2021 Q1 | 2021-01-01 | 894.21 | 21106.6 | 4.24 | 134.1 |
| 2021 Q2 | 2021-04-01 | 902.5 | 21474.1 | 4.2 | 135.4 |
| 2021 Q3 | 2021-07-01 | 885.62 | 21641.7 | 4.09 | 132.8 |
| 2021 Q4 | 2021-10-01 | 862.54 | 22001.6 | 3.92 | 129.4 |
| 2022 Q1 | 2022-01-01 | 873.51 | 21945.7 | 3.98 | 131 |
| 2022 Q2 | 2022-04-01 | 838 | 21976.3 | 3.81 | 125.7 |
| 2022 Q3 | 2022-07-01 | 807.01 | 22124.4 | 3.65 | 121 |
| 2022 Q4 | 2022-10-01 | 803.19 | 22272.5 | 3.61 | 120.5 |
| 2023 Q1 | 2023-01-01 | 802.7 | 22456.9 | 3.57 | 120.4 |
| 2023 Q2 | 2023-04-01 | 808.64 | 22577.6 | 3.58 | 121.3 |
| 2023 Q3 | 2023-07-01 | 832.41 | 22828.8 | 3.65 | 124.8 |
| 2023 Q4 | 2023-10-01 | 844.49 | 23033.2 | 3.67 | 126.7 |
| 2024 Q1 | 2024-01-01 | 858.29 | 23116 | 3.71 | 128.7 |
| 2024 Q2 | 2024-04-01 | 865.03 | 23320.1 | 3.71 | 129.7 |
| 2024 Q3 | 2024-07-01 | 867.49 | 23501.8 | 3.69 | 130.1 |
| 2024 Q4 | 2024-10-01 | 869.29 | 23641.8 | 3.68 | 130.4 |
| 2025 Q1 | 2025-01-01 | 857.3 | 23650.2 | 3.62 | 128.6 |
| 2025 Q2 | 2025-04-01 | 867 | 23884.6 | 3.63 | 130 |
| 2025 Q3 | 2025-07-01 | 866.22 | 24113 | 3.59 | 129.9 |
| 2025 Q4 | 2025-10-01 | 864.25 | 24125.5 | 3.58 | 129.6 |
| 2026 Q1 | 2026-01-01 | 863.12 | 24274.4 | 3.56 | 129.5 |
| 2026 Q2 | 2026-04-01 | 870.04 | 24408 | 3.56 | 130.5 |
A few housing states have already slipped
The national +0.4 percent year-over-year change from 2025 Q2 to 2026 Q2 hides a split. Florida’s real construction output fell 2.0 percent over that year. New York was down 1.7 percent. California and Georgia were each down 1.0 percent. Arizona slipped 0.6 percent. Texas rose 2.2 percent. Nevada, a much smaller market, was up 5.9 percent.
That is not a 2012-style collapse in the Sun Belt. It is a stall with a couple of large housing states already in reverse, while Texas — still pouring slabs for warehouses and power as well as houses — kept adding. Because the BEA series does not split residential from nonresidential construction in this extract, a Texas gain is not proof that Texas homebuilding is fine. It is proof that the state’s construction industry, broadly defined, had not followed Florida down by mid-2026.
Florida and California construction output slipped. Texas did not.

View exact chart values
| state | q2_2025_mil_ch2017 | q2_2026_mil_ch2017 | pct_change |
|---|---|---|---|
| Florida | 63735.8 | 62469.2 | -2 |
| New York | 44127.1 | 43363.2 | -1.7 |
| California | 99611.5 | 98592.1 | -1 |
| Georgia | 30701.7 | 30381.9 | -1 |
| Arizona | 24443.5 | 24295.9 | -0.6 |
| United States | 867000 | 870037 | 0.4 |
| Texas | 92120.5 | 94120.4 | 2.2 |
| Nevada | 13900.3 | 14723.1 | 5.9 |
Jobs follow the same split
Payrolls, which run more current than quarterly GDP, rhyme with that map. From January 2025 through August 2026, seasonally adjusted construction employment in California fell 16,100, or 1.8 percent, to 886,200. Texas added 39,800 jobs, or 4.5 percent, to 924,900. Florida was essentially unchanged (up 200). Arizona was up 900, or 0.4 percent. The BLS state employment series stop in August 2026 in this snapshot, so they do not include whatever October’s 7.40 percent mortgage did to crews after Labor Day.
Builders told NAHB that more than a third of them saw immigration enforcement in their markets last month, delaying jobs and keeping legal workers home. The payroll books cannot test that claim. They can only show that California has already been shedding construction jobs while Texas has not, and that Florida’s construction workforce stopped growing. A labor-shortage story and a demand-slump story can both be true in different states. The national survey is averaging them.
The bill that actually dominates the household ledger
If the midterm argument is about what households pay, construction GDP is the wrong scoreboard. Personal consumption by state is closer. In 2025, Americans spent $11,159 per person on housing and utilities — tenant rent, an imputed rent for owner-occupied homes, and household power and water. That was 18.3 percent of all personal consumption. Groceries bought for home, including alcohol, were $4,459, or 7.3 percent. Gasoline and other energy goods — motor fuel and heating oils — were $1,225, or 2.0 percent. Health care was $10,442. Housing-and-utilities spending was 9.1 times the gasoline line.
Those are current dollars per person, not household averages, and they are 2025 annual figures, not October pump prices. They still rearrange the campaign poster. Housing and utilities per person were $6,409 in 2012 and $7,758 in 2019. By 2025 they had risen 43.8 percent from 2019. Gasoline per person was actually lower in 2025 ($1,225) than in 2012 ($1,342). The Iran war can still make a week at the pump miserable. On the official consumption books, it is not the line that ate the decade.
Among the large housing states in this extract, Florida’s per-person housing-and-utilities bill hit $14,278 in 2025, up 59.7 percent from 2019. California was $13,333, up 43.3 percent. Arizona $12,041, up 59.3 percent. Texas $10,353, up 46.6 percent. Kansas, where the president is barnstorming this week, was $8,758 — well below the national $11,159, and up 35 percent from 2019. A cheaper housing state is not a cheap one if the rest of the budget is diesel and groceries. It is still a reminder that the 7.40 percent mortgage is landing on bills that were already fatter in Florida than in Kansas.
The housing bill grew. The gasoline line did not catch it.

View exact chart values
| year | housing_utilities_pc | food_offpremises_pc | gasoline_energy_goods_pc | health_care_pc | total_pce_pc | housing_share_pct | food_share_pct | gas_share_pct | health_share_pct | housing_to_gas_ratio |
|---|---|---|---|---|---|---|---|---|---|---|
| 2012 | 6409 | 2692 | 1342 | 5794 | 35145 | 18.2 | 7.7 | 3.8 | 16.5 | 4.8 |
| 2013 | 6585 | 2749 | 1331 | 5884 | 35956 | 18.3 | 7.6 | 3.7 | 16.4 | 4.9 |
| 2014 | 6722 | 2852 | 1287 | 6094 | 37194 | 18.1 | 7.7 | 3.5 | 16.4 | 5.2 |
| 2015 | 6824 | 2927 | 991 | 6400 | 38213 | 17.9 | 7.7 | 2.6 | 16.7 | 6.9 |
| 2016 | 6996 | 2989 | 885 | 6674 | 39238 | 17.8 | 7.6 | 2.3 | 17 | 7.9 |
| 2017 | 7196 | 3094 | 992 | 6875 | 40693 | 17.7 | 7.6 | 2.4 | 16.9 | 7.3 |
| 2018 | 7486 | 3179 | 1116 | 7137 | 42415 | 17.6 | 7.5 | 2.6 | 16.8 | 6.7 |
| 2019 | 7758 | 3280 | 1067 | 7487 | 43720 | 17.7 | 7.5 | 2.4 | 17.1 | 7.3 |
| 2020 | 8106 | 3624 | 779 | 7100 | 42920 | 18.9 | 8.4 | 1.8 | 16.5 | 10.4 |
| 2021 | 8560 | 3889 | 1162 | 7956 | 48524 | 17.6 | 8 | 2.4 | 16.4 | 7.4 |
| 2022 | 9325 | 4174 | 1541 | 8438 | 52907 | 17.6 | 7.9 | 2.9 | 15.9 | 6.1 |
| 2023 | 10017 | 4271 | 1381 | 9098 | 55746 | 18 | 7.7 | 2.5 | 16.3 | 7.3 |
| 2024 | 10585 | 4349 | 1299 | 9786 | 58301 | 18.2 | 7.5 | 2.2 | 16.8 | 8.1 |
| 2025 | 11159 | 4459 | 1225 | 10442 | 61062 | 18.3 | 7.3 | 2 | 17.1 | 9.1 |
What that means for a midterm about $4 gasoline
Three things can be true at once. Builder confidence can look like 2012. Construction output can still be a third larger than 2012 in real terms, with a few big states already slipping. And the consumption line that grew without pause is housing and utilities, not gasoline. None of that says the 7.40 percent mortgage will not cut housing starts from here — the GDP books end in 2026 Q2, the jobs books in August, and NAHB is a survey of people taking orders now. It does say that treating this as a rerun of the last crash, or as a story that begins and ends at the pump, is a misread of the official record.
The political risk is the same mismatch. A sanctions waiver that knocks a few dollars off Brent can dominate a news cycle. A $11,159-per-person housing-and-utilities bill does not fit on a rally sign. Voters who tell pollsters the economy is the issue are not required to mean the thing the White House is trying to fix this week.
Sources and methods
Observation windows: BEA quarterly real GDP through 2026 Q2 (seasonally adjusted annual rates, chained 2017 dollars); BLS SAE construction employment through August 2026 (seasonally adjusted, thousands); BEA annual per-person PCE through calendar 2025 (current dollars). Source vintages are the BEA regional 2026-09-30 releases and the BLS SAE snapshot dated 2026-08-24. Provider lag is normal; these are not current-day observations.
Construction GDP is the entire construction industry (NAICS 23), including residential and nonresidential work. A change in that series is not a change in housing starts. PCE housing and utilities includes tenant rent, imputed rent of owner-occupied dwellings, and household utilities; it is not a mortgage payment. Gasoline and other energy goods includes motor fuels and fuel oil. Food is off-premises food and beverages, including alcohol. Values are per person, not household averages. Missing observations were not treated as zero. No causal claim is made about mortgages, ICE, or oil prices.
Research completed 2026-10-20, for the October 19, 2026 news edition. The available source data may cover earlier periods; see the observation periods and source vintages above.