Research
Arkansas led farm bankruptcies. Family-farm income had already cratered.
The docket is not the whole farm
Arkansas led the country in farm Chapter 12 bankruptcies in the third quarter of 2026, with 12 filings — twice Iowa's total — and 32 so far this year, according to the University of Arkansas Division of Agriculture. Nationwide, 292 Chapter 12 cases have been filed in 2026, nearly 19 percent above the first three quarters of 2025. Farmers in the state describe diesel that jumped from about $2.50 a gallon last year toward $6, fertilizer that more than doubled, and rice acreage falling below a million for the first time since the early 1980s.
A bankruptcy filing is a legal event, not an income statement. Chapter 12 was written for family farmers with regular income; it is not a census of every stressed operation, and it excludes corporate farms that never qualify. The question the docket cannot answer is whether Arkansas is simply a big farm state taking a normal hit, or whether the money that family farms actually keep has already disappeared. The Bureau of Economic Analysis keeps those books. They are annual through 2025 and quarterly through mid-2026. They are not a 2026 harvest tally, and they do not prove that cheap diesel would have stopped the filings. They do show how far Arkansas family-farm income has already fallen — and that Iowa, the next-highest filer, did not keep falling with it.
Arkansas farm-proprietor income never got the 2025 bounce Iowa did

View exact chart values
| year | arkansas | iowa | united_states |
|---|---|---|---|
| 2010 | 13.3 | 29 | 42.9 |
| 2011 | 16 | 64.9 | 69 |
| 2012 | 27.4 | 56.8 | 63.4 |
| 2013 | 73.5 | 74.6 | 94.1 |
| 2014 | 66.7 | 48.1 | 75.1 |
| 2015 | 33.6 | 42.1 | 60.4 |
| 2016 | 20.4 | 20.3 | 41.1 |
| 2017 | 44 | 25.1 | 45.3 |
| 2018 | 35.7 | 31.4 | 36.6 |
| 2019 | 12.8 | 20.3 | 39 |
| 2020 | 11.9 | 18.3 | 55 |
| 2021 | 63.6 | 63.9 | 77.2 |
| 2022 | 100 | 100 | 100 |
| 2023 | 75.3 | 58.6 | 77.7 |
| 2024 | 71.9 | 42.6 | 60.8 |
| 2025 | 61.8 | 62.3 | 86 |
The 2022 boom unwound. Arkansas did not get the bounce.
Arkansas farm proprietors' income — the money sole proprietorships and partnerships receive from farming, not corporate farms — peaked at $3.00 billion in 2022. By 2025 it was $1.85 billion, a 38.2 percent drop in current dollars. Iowa's family-farm income fell by a similar 37.7 percent from its 2022 peak of $10.48 billion. The national total was down 14 percent. Indexed to 2022, Arkansas and Iowa both sat near 62 in 2025. The United States sat at 86.
The annual totals hide the split that matters for this year's docket. Iowa's 2025 figure was a rebound: family-farm income there jumped 46 percent from 2024's $4.47 billion trough. Arkansas kept sliding, down another 14.1 percent from 2024 to 2025. Among the comparison farm states in this set, only North Dakota (−54.4 percent) and Minnesota (−50.1 percent) fell harder from 2022 to 2025. Kansas and Nebraska went the other way. A 38 percent drop from a boom year is not unique. A drop that is still underway, after Iowa has already turned, is the Arkansas story.
The 2022 boom unwound. Arkansas fell with Iowa, not with Kansas

View exact chart values
| state | farm_share_2025_pct | farm_prop_2025_b | farm_prop_2022_b | change_2022_2025_pct |
|---|---|---|---|---|
| North Dakota | 3.5 | 2.169 | 4.751 | -54.4 |
| Minnesota | 0.64 | 2.924 | 5.857 | -50.1 |
| Arkansas | 0.97 | 1.855 | 3.003 | -38.2 |
| Iowa | 2.99 | 6.528 | 10.482 | -37.7 |
| Mississippi | 0.78 | 1.256 | 1.911 | -34.3 |
| United States | 0.34 | 88.899 | 103.331 | -14 |
| South Dakota | 6.19 | 4.571 | 4.2 | 8.8 |
| Nebraska | 3.55 | 5.455 | 4.145 | 31.6 |
| Kansas | 1.58 | 3.253 | 1.948 | 67 |
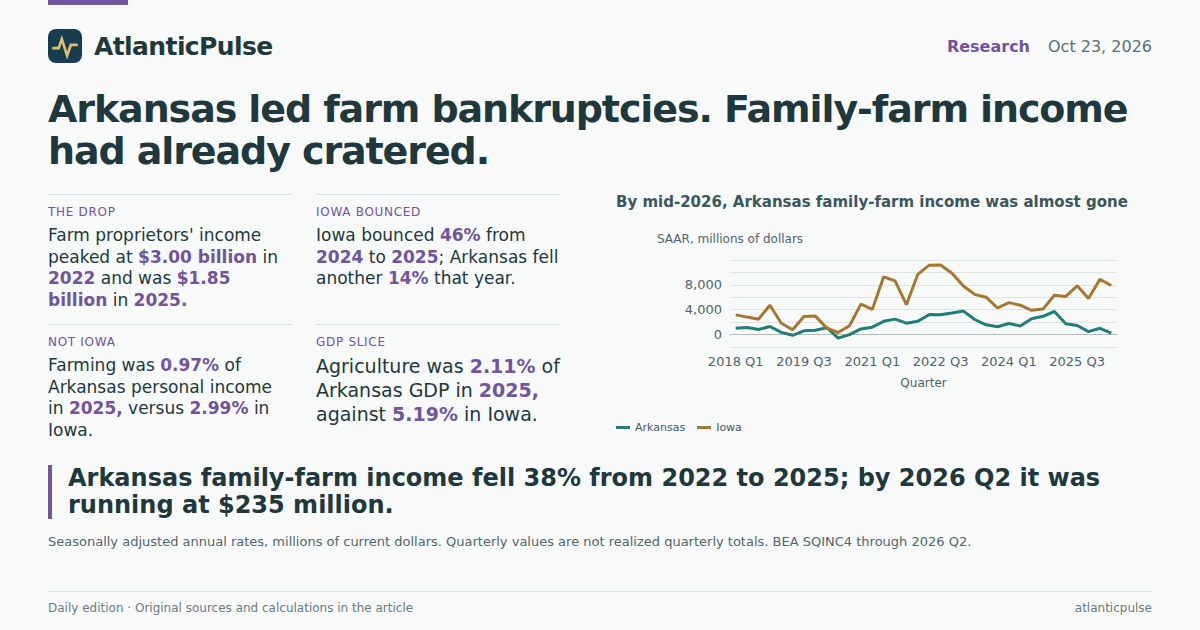
By last spring, the quarterly line was almost on the floor
Quarterly figures are published as seasonally adjusted annual rates, not as cash that arrived in a three-month window. Read that way, Arkansas family-farm income was running at a $3.48 billion annual rate in 2022 Q4. It was $477 million in 2025 Q4, $1.01 billion in 2026 Q1, and $235 million in 2026 Q2 — 93 percent below the late-2022 pace. Iowa, over the same stretch, was still running at a $7.90 billion annual rate in 2026 Q2.
The Arkansas quarterly series has been violent for years. It went negative in 2019 Q2 and again in 2020 Q2, which is what farm proprietors' income does when expenses swamp receipts. The 2021–22 boom filled the hole. The hole is back, and this time Iowa is not in it with them. That is not a forecast of 2026 Chapter 12 filings, which the official income accounts do not count. It is the income path sitting under a state that is already leading the filing table.
Real output moved less violently than the income line, which is a reminder that prices and costs, not just bushels, are doing the damage. Arkansas agriculture, forestry, fishing and hunting real GDP, in chained 2017 dollars, fell 20.5 percent from 2022 to 2025. Family-farm income fell 38 percent. The difference is the squeeze farmers have been describing: diesel, fertilizer, and thin rice margins, not a vanishing countryside.
By mid-2026, Arkansas family-farm income was almost gone

View exact chart values
| quarter | arkansas_saar_m | iowa_saar_m |
|---|---|---|
| 2018 Q1 | 1009.4 | 3171.7 |
| 2018 Q2 | 1158.6 | 2814.5 |
| 2018 Q3 | 818.8 | 2473 |
| 2018 Q4 | 1295.7 | 4721.6 |
| 2019 Q1 | 346.2 | 1811 |
| 2019 Q2 | -115.9 | 786.5 |
| 2019 Q3 | 607.1 | 2918.2 |
| 2019 Q4 | 696 | 2977.7 |
| 2020 Q1 | 1104.8 | 1034.7 |
| 2020 Q2 | -573.3 | 332.1 |
| 2020 Q3 | -7.3 | 1416.7 |
| 2020 Q4 | 909.5 | 4900.2 |
| 2021 Q1 | 1182.5 | 4055.4 |
| 2021 Q2 | 2134.1 | 9299 |
| 2021 Q3 | 2495.9 | 8633.9 |
| 2021 Q4 | 1826 | 4799.9 |
| 2022 Q1 | 2140 | 9694.7 |
| 2022 Q2 | 3208.9 | 11160.9 |
| 2022 Q3 | 3186.4 | 11197.8 |
| 2022 Q4 | 3475.5 | 9873.3 |
| 2023 Q1 | 3784.2 | 7821.5 |
| 2023 Q2 | 2429 | 6470.3 |
| 2023 Q3 | 1579.9 | 6021.1 |
| 2023 Q4 | 1253.6 | 4271 |
| 2024 Q1 | 1783.7 | 5139.5 |
| 2024 Q2 | 1375.8 | 4721.7 |
| 2024 Q3 | 2537.4 | 3913.2 |
| 2024 Q4 | 2938.2 | 4106.2 |
| 2025 Q1 | 3719.9 | 6313.2 |
| 2025 Q2 | 1757 | 6150.2 |
| 2025 Q3 | 1465.5 | 7844.2 |
| 2025 Q4 | 476.6 | 5805.3 |
| 2026 Q1 | 1007.5 | 8887.3 |
| 2026 Q2 | 235.2 | 7895.2 |
Arkansas is not Iowa, and it is not the Dakotas
If the bankruptcy lead were just a story about how farm-heavy a state is, Arkansas would not be first in line. In 2025, farm proprietors' income was 0.97 percent of Arkansas personal income. That is more than the U.S. average of 0.34 percent, and more than Minnesota or Mississippi in this comparison set. It is a third of Iowa's 2.99 percent, and a sixth of South Dakota's 6.19 percent. Nebraska and North Dakota were both above 3.5 percent. Arkansas is a farm state in the Southeast sense: agriculture matters, and when it cracks it shows up in courthouses. It is not a Plains income machine.
The GDP books say the same thing in a slightly wider frame. Agriculture, forestry, fishing and hunting — a sector that includes timber and fishing, not only crop and livestock farms — was 2.11 percent of Arkansas current-dollar GDP in 2025, against 5.19 percent in Iowa and 0.83 percent nationally. That share peaked at 3.32 percent in Arkansas in 2022 and 8.04 percent in Iowa. The swing is large relative to Arkansas's own history. It is still a small slice of a $196 billion state economy. A $1.85 billion family-farm income line can collapse without showing up as a statewide recession. It can still produce the most Chapter 12 filings in the country, because Chapter 12 is a farm statute, not a GDP statute.
Arkansas is not a farm-income state the way Iowa or the Dakotas are

View exact chart values
| state | farm_share_2025_pct | farm_prop_2025_b | farm_prop_2022_b | change_2022_2025_pct |
|---|---|---|---|---|
| United States | 0.34 | 88.899 | 103.331 | -14 |
| Minnesota | 0.64 | 2.924 | 5.857 | -50.1 |
| Mississippi | 0.78 | 1.256 | 1.911 | -34.3 |
| Arkansas | 0.97 | 1.855 | 3.003 | -38.2 |
| Kansas | 1.58 | 3.253 | 1.948 | 67 |
| Iowa | 2.99 | 6.528 | 10.482 | -37.7 |
| North Dakota | 3.5 | 2.169 | 4.751 | -54.4 |
| Nebraska | 3.55 | 5.455 | 4.145 | 31.6 |
| South Dakota | 6.19 | 4.571 | 4.2 | 8.8 |
Farming is a bigger slice of Iowa's economy. Arkansas still feels the swing

View exact chart values
| year | arkansas | iowa | united_states |
|---|---|---|---|
| 2010 | 2.1 | 4.51 | 0.97 |
| 2011 | 2.14 | 7.16 | 1.15 |
| 2012 | 2.37 | 6.64 | 1.1 |
| 2013 | 3.45 | 7.95 | 1.28 |
| 2014 | 3.06 | 6.41 | 1.14 |
| 2015 | 2.38 | 5.07 | 1 |
| 2016 | 2 | 4.17 | 0.89 |
| 2017 | 2.4 | 4.55 | 0.9 |
| 2018 | 2.19 | 4.65 | 0.86 |
| 2019 | 1.39 | 3.42 | 0.76 |
| 2020 | 1.25 | 2.77 | 0.77 |
| 2021 | 2.42 | 6.15 | 0.97 |
| 2022 | 3.32 | 8.04 | 1.13 |
| 2023 | 2.53 | 5.74 | 0.97 |
| 2024 | 2.64 | 5.09 | 0.84 |
| 2025 | 2.11 | 5.19 | 0.83 |
What the books will not do
None of this says the 12 third-quarter filings were caused by the 2025 income drop, or that a fertilizer plant in Nebraska would have changed the rice acreage. BEA farm proprietors' income excludes corporate farms; Chapter 12 is built for family operations, so the two line up better than a total farm-GDP number would, but they are still different universes. The annual accounts end in 2025. The quarterly path through 2026 Q2 is a seasonally adjusted annual rate from a September 2026 vintage, not a live harvest report. Diesel at $6 a gallon is in the reporting, not in these tables.
What the books do say is narrower, and useful. Arkansas led the Chapter 12 table in a year when its family-farm income was still falling, after a 2022 boom, and after Iowa — the next-highest filer — had already bounced. The state is not the most farm-dependent place on the map. It is a place where a thin farm-income line went from $3 billion to $235 million at an annual rate in three and a half years, and where the courthouse is now keeping score.
Sources and methods
BEA annual state personal income (SAINC30) and GDP (SAGDP2, SAGDP9) run through calendar year 2025. Quarterly farm proprietors' income (SQINC4) runs through 2026 Q2 at a seasonally adjusted annual rate, which is not a realized quarterly total. The pinned snapshot is the BEA regional release identified as 2026-09-30; those are not current-day observations.
Farm proprietors' income is the income of sole proprietorships and partnerships that operate farms. It excludes corporate farms. Agriculture GDP is NAICS 11, which includes forestry, fishing and related activities as well as crop and animal production. Those two measures are not interchangeable.
Percent changes use current dollars unless labeled real (chained 2017 dollars). Shares use the same year's personal income or current-dollar GDP as the denominator. Comparison states are other large farm economies in this 2022–25 window, not a complete 50-state ranking. Missing values were not treated as zero.
Chapter 12 filing counts come from the day's Arkansas reporting, not from BEA. The income accounts do not count bankruptcies and cannot support a causal claim that the 2025–26 income path produced the third-quarter filings.
Research completed 2026-10-24, for the October 23, 2026 news edition. The available source data may cover earlier periods; see the observation periods and source vintages above.