Research
Arizona grew. Its farms did not. Then came the river cuts.
A cut that lands where the people are
The Interior Department’s two-year Colorado River plan, published in August 2026, is not a seven-state haircut. Arizona, California and Nevada take the reductions — 760,000, 440,000 and 50,000 acre-feet through 2028, about 27 percent, 10 percent and 16 percent of their supplies — while Utah, Colorado, Wyoming and New Mexico face no mandatory cuts. Reporting on the plan put the arithmetic next to record-low reservoirs. The political fight is about who should share the pain. The economic question is more basic: how large are the farm economies in the states that just got the bill?
The answer, in Bureau of Economic Analysis state accounts, is uneven in a way that should annoy almost everyone. California’s farms are still a national-scale industry. Arizona’s are not, and they have been shrinking even as the state added people. Nevada’s farm sector is tiny. The upper-basin states that escaped mandatory cuts are not farm powerhouses either, except that Utah’s farm output has grown. None of this proves the new cuts caused past farm declines — they have not started yet — but it does show where a smaller river now has to support more households and, in Arizona, a smaller farm sector than a generation ago.
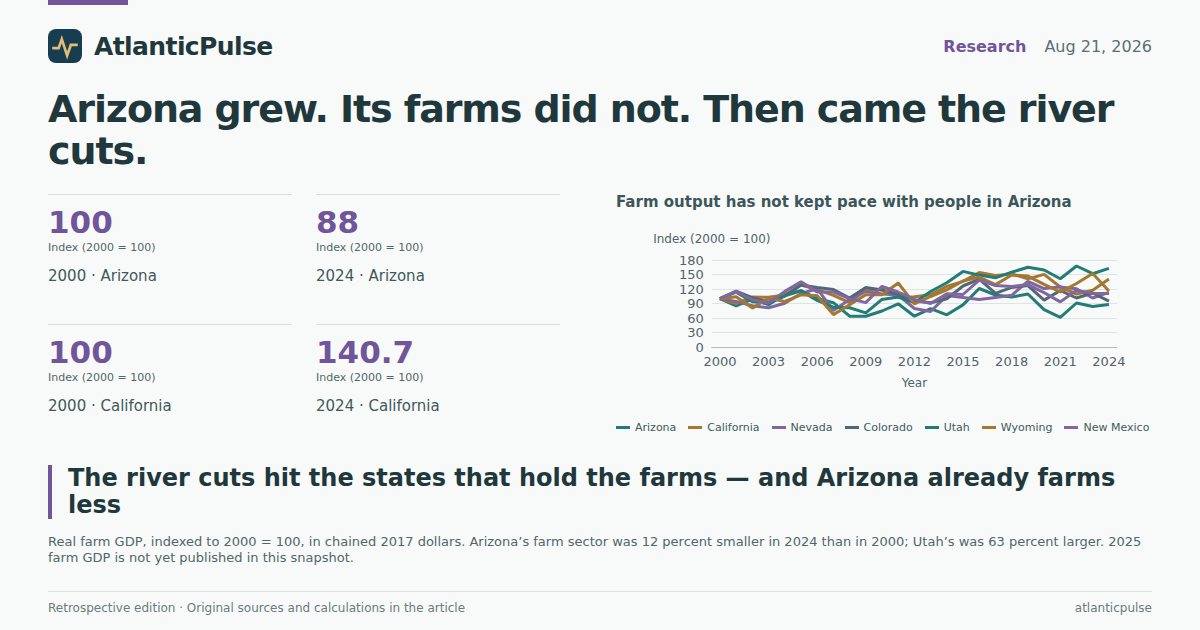
Farm output has not kept pace with people in Arizona

View exact chart values
| year | Arizona | California | Nevada | Colorado | Utah | Wyoming | New Mexico |
|---|---|---|---|---|---|---|---|
| 2000 | 100 | 100 | 100 | 100 | 100 | 100 | 100 |
| 2001 | 85 | 89.9 | 94.4 | 115.4 | 113.3 | 103.9 | 115.2 |
| 2002 | 99.3 | 103.3 | 85.4 | 102.2 | 93.6 | 80.5 | 97.6 |
| 2003 | 87.6 | 102.9 | 81.1 | 93.1 | 90.7 | 101 | 91 |
| 2004 | 109.2 | 107.4 | 90.4 | 105.3 | 105.7 | 94.1 | 115.1 |
| 2005 | 116.7 | 128.3 | 110.7 | 128.3 | 116.1 | 108.1 | 134.6 |
| 2006 | 100.4 | 118.9 | 120.6 | 123.4 | 96.5 | 106.2 | 114 |
| 2007 | 91.7 | 107 | 75.3 | 118.8 | 82.4 | 67 | 113.8 |
| 2008 | 63.8 | 91.7 | 98 | 101.1 | 81 | 87.6 | 100.1 |
| 2009 | 63.6 | 118.9 | 114.9 | 122.9 | 70.5 | 107.9 | 91.9 |
| 2010 | 74.5 | 118.2 | 109.4 | 118.2 | 98.4 | 108 | 125.6 |
| 2011 | 89.3 | 102.9 | 107.5 | 109.3 | 103.2 | 132.5 | 113.8 |
| 2012 | 63.7 | 103.8 | 79.7 | 94.9 | 91.7 | 89.2 | 98.5 |
| 2013 | 79.4 | 107.9 | 73.5 | 91.6 | 114.9 | 104.4 | 90 |
| 2014 | 66.6 | 125.3 | 106.4 | 99.5 | 132.8 | 118.2 | 110.1 |
| 2015 | 87.1 | 135.8 | 102.7 | 126.2 | 156.4 | 136.6 | 108.6 |
| 2016 | 121 | 153.9 | 98.3 | 140.3 | 148.8 | 144.9 | 138.4 |
| 2017 | 107.5 | 148.2 | 102.6 | 111 | 143.1 | 129.2 | 127.3 |
| 2018 | 103.2 | 151 | 106.9 | 123.3 | 154.7 | 148.9 | 125.2 |
| 2019 | 109.6 | 140.9 | 135.9 | 127.1 | 165 | 146.6 | 129.1 |
| 2020 | 77.1 | 150.2 | 120.8 | 97.1 | 159.3 | 129.7 | 112.6 |
| 2021 | 61.5 | 124.1 | 124.1 | 116.8 | 141.2 | 113.8 | 93.4 |
| 2022 | 91 | 109.7 | 120.5 | 101.4 | 167.5 | 131.3 | 117.5 |
| 2023 | 83.7 | 117.5 | 101.3 | 111.8 | 151.6 | 152.1 | 110.6 |
| 2024 | 88 | 140.7 | 112.9 | 94.8 | 162.7 | 115.9 | 110.9 |
California’s farms dwarf the rest of the basin
In 2024, the latest year with published real farm GDP in this snapshot, California’s farm sector produced $25.8 billion in chained 2017 dollars. That is about 16 percent of U.S. farm GDP on the same measure, and it is larger than Arizona, Nevada, Colorado, Utah, Wyoming and New Mexico put together if you simply line the state figures up. Chained-dollar GDP is not strictly additive across states, so that comparison is a ranking, not a ledger. The ranking is still blunt. Arizona’s real farm GDP was $1.43 billion. Colorado’s was $1.69 billion. Nevada’s was $271 million — less than a rounding error in California’s total.
Current-dollar farm personal income, which can be added, tells the same story with a different unit. In 2025, farm income in the three lower-basin states summed to $23.1 billion. The four upper-basin states summed to $4.1 billion. California alone accounted for $21.5 billion, or 79 percent of the seven-state total. Farm income here is wages, benefits and proprietors’ income in crop and animal production; it excludes corporate farm profits. It is not a census of every alfalfa field that drinks Colorado River water. It is the official measure of how much personal income those farm sectors generate.
Farms are also a small slice of these state economies. In 2024, farm GDP was 0.78 percent of California’s real GDP, 0.32 percent of Arizona’s, 0.13 percent of Nevada’s and 0.38 percent of Colorado’s. A water cut can still hammer irrigation districts without showing up as a state-GDP crisis. That is the point. The river’s farm exposure is concentrated, rural, and — in California — large in absolute dollars even when it is small as a share of Hollywood, ports and software.
California still dwarfs the rest of the basin’s farms

View exact chart values
| state | basin | farm_gdp |
|---|---|---|
| Nevada | Lower basin | 271 |
| Wyoming | Upper basin | 491.1 |
| Utah | Upper basin | 867.7 |
| New Mexico | Upper basin | 1099.2 |
| Arizona | Lower basin | 1432.2 |
| Colorado | Upper basin | 1691.4 |
| California | Lower basin | 25760.2 |
Arizona added people and lost farm output
Population went the other way. From 2000 to 2025, Nevada’s population rose 63 percent and Arizona’s 48 percent, per BEA’s midyear resident counts. Utah, in the upper basin, rose 58 percent. California grew 16 percent. Colorado grew 39 percent. Wyoming and New Mexico grew about 19 and 17 percent. These are statewide figures, not the subset of households whose taps actually connect to the Colorado. They still describe the political fact behind the compact fight: the lower basin has been filling with people for a quarter century.
Put farm output on the same 2000 baseline and Arizona stands out. Real farm GDP in 2024 was 12 percent below 2000. Colorado was down 5 percent. California was up 41 percent. Nevada was up 13 percent — a small sector getting slightly less small. Utah was up 63 percent, the strongest farm-output gain among the seven. A scatter of 2000–2024 population change against farm-GDP change puts Arizona in the awkward quadrant: many more residents, less farm product. Nevada added people even faster and still eked out a farm gain. Utah managed both.
That pattern is not a verdict on the Interior plan. Drought, groundwater rules, crop mix, land conversion and commodity prices all move farm GDP. California’s Central Valley does not run only on the Colorado; the State Water Project, the Sacramento–San Joaquin system and wells matter at least as much. Arizona’s farms do lean harder on the river, which is why a 27 percent cut lands differently in Yuma than in Los Angeles. The accounts cannot allocate GDP acre-foot by acre-foot. They can show that the state taking the steepest cut already has a smaller farm sector, in real terms, than it did when the river looked more reliable.
The lower basin added people faster than most of the upper basin

View exact chart values
| year | Arizona | California | Nevada | Colorado | Utah | Wyoming | New Mexico |
|---|---|---|---|---|---|---|---|
| 2000 | 100 | 100 | 100 | 100 | 100 | 100 | 100 |
| 2001 | 102.2 | 101.4 | 103.9 | 102.3 | 101.7 | 100.1 | 100.6 |
| 2002 | 104.6 | 102.6 | 107.7 | 103.8 | 103.6 | 101.2 | 101.9 |
| 2003 | 106.8 | 103.7 | 111.4 | 104.7 | 105.2 | 101.9 | 103.1 |
| 2004 | 109.5 | 104.7 | 116.2 | 105.7 | 107 | 103 | 104.5 |
| 2005 | 113.1 | 105.4 | 120.5 | 107 | 109.5 | 104 | 106.1 |
| 2006 | 116.8 | 106 | 125 | 109.1 | 112.5 | 105.7 | 107.7 |
| 2007 | 119.5 | 106.7 | 128.8 | 111 | 115.7 | 108.2 | 109.3 |
| 2008 | 121.7 | 107.7 | 131.4 | 113 | 118.6 | 110.5 | 110.4 |
| 2009 | 122.9 | 108.7 | 133 | 114.9 | 121.3 | 113.3 | 111.8 |
| 2010 | 124 | 109.8 | 133.8 | 116.6 | 123.7 | 114.2 | 113.4 |
| 2011 | 124.9 | 110.8 | 134.2 | 118.3 | 125.6 | 114.7 | 114.3 |
| 2012 | 126 | 111.7 | 135.7 | 119.9 | 127.5 | 116.4 | 114.8 |
| 2013 | 127 | 112.7 | 137.2 | 121.6 | 129.6 | 117.5 | 115.1 |
| 2014 | 128.5 | 113.7 | 139.1 | 123.5 | 131.5 | 117.5 | 115 |
| 2015 | 129.9 | 114.6 | 141.5 | 125.8 | 133.7 | 118.1 | 115.1 |
| 2016 | 131.6 | 115.4 | 143.9 | 127.8 | 136.5 | 117.7 | 115.3 |
| 2017 | 133.2 | 116 | 146.4 | 129.4 | 139.3 | 116.6 | 115.4 |
| 2018 | 135 | 116.3 | 149.2 | 131.2 | 141.8 | 116.3 | 115.5 |
| 2019 | 137 | 116.4 | 152 | 132.6 | 144 | 116.4 | 115.9 |
| 2020 | 139.3 | 116.3 | 154.4 | 133.7 | 146.3 | 116.9 | 116.3 |
| 2021 | 141 | 115.2 | 156 | 134.4 | 148.8 | 117.3 | 116.3 |
| 2022 | 142.8 | 115.1 | 157.4 | 135.3 | 151.2 | 117.7 | 116 |
| 2023 | 144.4 | 115.3 | 159.1 | 136.6 | 153.7 | 118.3 | 116.4 |
| 2024 | 146.4 | 115.8 | 161.2 | 138.4 | 156.1 | 118.7 | 116.8 |
| 2025 | 147.7 | 115.8 | 162.6 | 139 | 157.7 | 119.1 | 116.7 |
Arizona grew. Its farms did not.

View exact chart values
| state | basin | pop_change_pct | farm_change_pct |
|---|---|---|---|
| Arizona | Lower basin | 46.4 | -12 |
| California | Lower basin | 15.8 | 40.7 |
| Nevada | Lower basin | 61.2 | 12.9 |
| Colorado | Upper basin | 38.4 | -5.2 |
| Utah | Upper basin | 56.1 | 62.7 |
| Wyoming | Upper basin | 18.7 | 15.9 |
| New Mexico | Upper basin | 16.8 | 10.9 |
The building boom is on the payroll. The farms are not.
If you want a labor-market picture of the growth that now shares the river, construction payrolls are the blunt instrument. Seasonally adjusted construction employment in July 2026 was 227,100 in Arizona, more than double the 109,000 of July 2010. Nevada nearly doubled, to 115,800. Colorado rose 66 percent, to 189,500. California rose 59 percent, to 887,400 — a huge payroll that still grew more slowly than Arizona’s. Bureau of Labor Statistics state estimates are statewide. They do not prove those extra crews are pouring slabs in Colorado River cities. They do show where the job growth has been while farm GDP in Arizona went the other way.
The payoff for readers is not a morality play about suburbs versus lettuce. It is a map of exposure. Most of the basin’s farm personal income sits in the three states now required to use less water, because California’s farms are enormous. The steepest percentage cut hits Arizona, where farm output has already contracted over 25 years as population and construction payrolls rose. Nevada’s farm sector is too small to drive the state accounts; its growth is in people and buildings. Upper-basin states can argue they already live with a drier river at the source. The published output numbers do not make them the basin’s farm heavyweights.
None of this forecasts how many acres will come out of production in 2027. Interior’s cuts are an operating plan, not a crop report. Farm GDP will bounce with cattle prices and lettuce yields the way it always does. What the accounts do say is simpler, and harder to litigate away: the first two-year cuts were assigned to the states that hold most of the basin’s farm income, and to a lower-basin economy that has been adding households faster than farm product. The river is smaller. The population is not. Arizona’s farms, unlike Utah’s, have already been living with that mismatch.
Arizona’s construction payrolls more than doubled

View exact chart values
| year | Arizona | Arizona_thousands | California | California_thousands | Nevada | Nevada_thousands | Colorado | Colorado_thousands |
|---|---|---|---|---|---|---|---|---|
| 2010 | 100 | 109 | 100 | 557.1 | 100 | 59.2 | 100 | 114.2 |
| 2011 | 100.7 | 109.8 | 101.2 | 563.7 | 88 | 52.1 | 98.2 | 112.2 |
| 2012 | 105.3 | 114.8 | 106.1 | 591.2 | 87.5 | 51.8 | 101.1 | 115.5 |
| 2013 | 113.3 | 123.5 | 114.6 | 638.3 | 95.8 | 56.7 | 112 | 127.9 |
| 2014 | 112.3 | 122.4 | 120.5 | 671.4 | 107.8 | 63.8 | 125.7 | 143.6 |
| 2015 | 115.9 | 126.3 | 131.9 | 734.7 | 118.4 | 70.1 | 129.9 | 148.3 |
| 2016 | 124 | 135.2 | 139.8 | 779.1 | 128.2 | 75.9 | 136.2 | 155.5 |
| 2017 | 133.3 | 145.3 | 146.3 | 815.3 | 140.7 | 83.3 | 143.1 | 163.4 |
| 2018 | 144.8 | 157.8 | 154.6 | 861 | 150.8 | 89.3 | 152 | 173.6 |
| 2019 | 156.8 | 170.9 | 159.8 | 890.4 | 162.5 | 96.2 | 158 | 180.4 |
| 2020 | 157.2 | 171.4 | 151.2 | 842.2 | 157.1 | 93 | 151.1 | 172.5 |
| 2021 | 164.6 | 179.4 | 158.5 | 883.2 | 166.6 | 98.6 | 155.3 | 177.4 |
| 2022 | 180.7 | 197 | 164.4 | 915.9 | 181.2 | 107.3 | 160.2 | 183 |
| 2023 | 197.9 | 215.7 | 164.2 | 915 | 188.9 | 111.8 | 162.5 | 185.6 |
| 2024 | 207.2 | 225.8 | 164.6 | 917.1 | 186.1 | 110.2 | 164.2 | 187.5 |
| 2025 | 205.3 | 223.8 | 160.5 | 894.1 | 191.4 | 113.3 | 161 | 183.9 |
| 2026 | 208.3 | 227.1 | 159.3 | 887.4 | 195.6 | 115.8 | 165.9 | 189.5 |
Sources and methods
This is retrospective enrichment using pinned catalogue snapshots, not an as-known-on-the-edition-date reconstruction. Research was compiled on 11 September 2026 against the 21 August 2026 State-News edition. BEA annual state GDP and income come from the bea-regional-state-annual-2026-04-09 release in the 31 August 2026 snapshot; BLS State and Area Employment come from the 24 August 2026 snapshot (bls-sm-snapshot-2026-08-24). Later revisions may differ.
Real farm GDP is BEA SAGDP9 Farms (NAICS 111–112), millions of chained 2017 dollars, 2000–2024. One 2025 observation per farm-GDP series was null and was not treated as zero. Current-dollar farm income is BEA SAINC4 farm income, 2000–2025, and excludes corporate farm income. Population is BEA SAINC1 midyear residents, 2000–2025. Total real GDP is SAGDP9 all-industry total. Construction employment is BLS SAE seasonally adjusted statewide construction, thousands, monthly, with July values indexed to July 2010; the latest month in the extract is July 2026.
Chained-dollar GDP is compared state-by-state and is not strictly additive across geographies. Basin income totals use current-dollar farm income, which is additive. Statewide farm GDP is not a measure of Colorado River–irrigated acreage; California in particular draws on multiple water systems. Population and construction payrolls are statewide, not confined to river service areas. Percent changes are descriptive. No causal effect of the 2027–2028 operating plan is inferred from earlier farm or population trends.
Research completed 2026-09-11, for the August 21, 2026 news edition. This is retrospective analysis, not a reconstruction of information available that day.