Research
Americans soured on college. They already cut it as a share of the household budget.
The poll is new. The budget share already turned.
Gallup this week found that just 31 percent of U.S. adults now say a college education is “very important,” down from 70 percent in 2013 and below the 36 percent reading when the firm first asked in 1978. The same reporting pointed to cost: only 12 percent of adults in a Lumina-Gallup survey called a four-year education affordable, and the national student-loan balance has reached $1.86 trillion. That is an opinion poll about value. The question it raises for the official books is simpler. Did households already start spending less on college, or did they keep writing bigger checks while telling pollsters the product was no longer worth it?
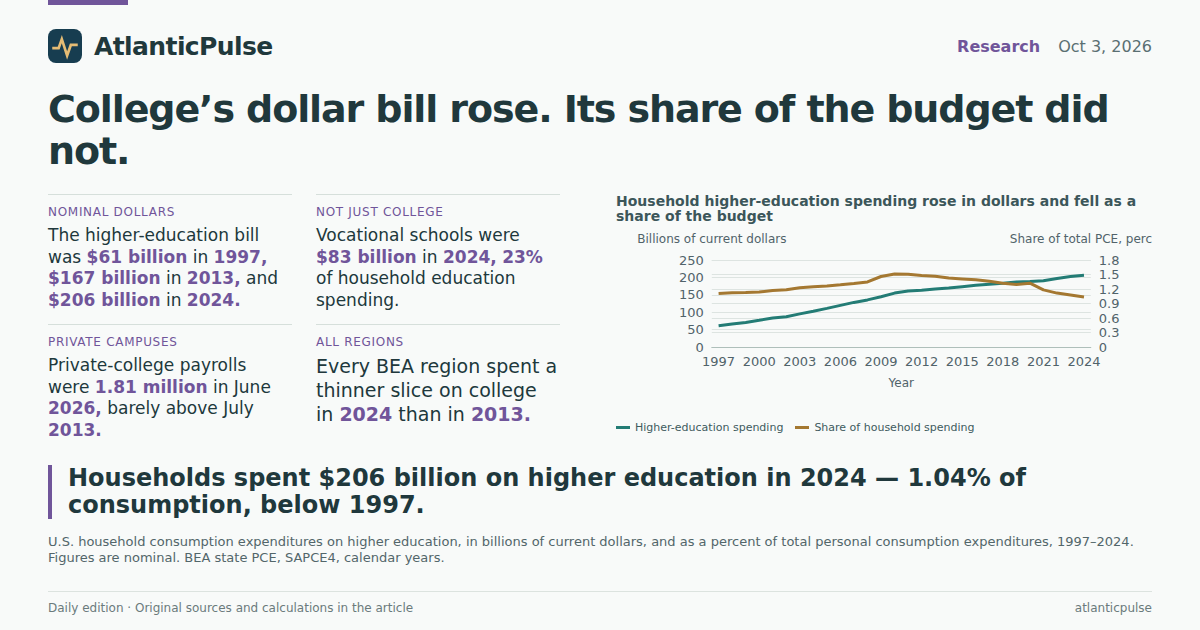
The Bureau of Economic Analysis’s household consumption accounts, through calendar 2024, give a two-part answer. In current dollars, the higher-education bill kept climbing. U.S. households spent $61.3 billion on higher education in 1997, $166.7 billion in 2013 — the year Gallup last recorded that 70 percent “very important” reading — and $206.3 billion in 2024. That is a 237 percent increase over the full span and a much slower 24 percent rise from 2013 to 2024. The dollars did not collapse. They decelerated.
As a share of the household budget, the story is harsher. Higher education was 1.11 percent of total personal consumption in 1997, peaked at 1.51 percent in 2010, was still 1.46 percent in 2013, and had fallen to 1.04 percent by 2024 — below the 1997 share even though the sticker-price folklore never left the kitchen table. Total household spending in those same accounts reached $19.9 trillion in 2024. College took a larger check and a smaller slice.
Household higher-education spending rose in dollars and fell as a share of the budget

View exact chart values
| year | higher_ed_billions | total_pce_trillions | higher_ed_share_pct | education_billions |
|---|---|---|---|---|
| 1997 | 61.26 | 5.537 | 1.106 | 107.12 |
| 1998 | 66.03 | 5.877 | 1.123 | 115.24 |
| 1999 | 70.77 | 6.284 | 1.126 | 123.93 |
| 2000 | 76.78 | 6.767 | 1.135 | 134.29 |
| 2001 | 82.92 | 7.074 | 1.172 | 143.62 |
| 2002 | 86.99 | 7.349 | 1.184 | 149.53 |
| 2003 | 94.98 | 7.741 | 1.227 | 159.52 |
| 2004 | 102.48 | 8.232 | 1.245 | 169 |
| 2005 | 110.85 | 8.769 | 1.264 | 180.51 |
| 2006 | 119.68 | 9.277 | 1.29 | 193.07 |
| 2007 | 128.28 | 9.747 | 1.316 | 206 |
| 2008 | 135.28 | 10.05 | 1.346 | 216.43 |
| 2009 | 144.3 | 9.891 | 1.459 | 226.05 |
| 2010 | 154.98 | 10.26 | 1.51 | 240.31 |
| 2011 | 161.11 | 10.699 | 1.506 | 248.21 |
| 2012 | 163.22 | 11.047 | 1.477 | 250.59 |
| 2013 | 166.69 | 11.388 | 1.464 | 255.99 |
| 2014 | 169.28 | 11.874 | 1.426 | 261.98 |
| 2015 | 173.15 | 12.297 | 1.408 | 269.96 |
| 2016 | 177.28 | 12.727 | 1.393 | 278.97 |
| 2017 | 180.59 | 13.291 | 1.359 | 285.64 |
| 2018 | 183.46 | 13.934 | 1.317 | 293.5 |
| 2019 | 187.05 | 14.438 | 1.296 | 300.77 |
| 2020 | 188.02 | 14.231 | 1.321 | 296.1 |
| 2021 | 190.43 | 16.12 | 1.181 | 313.2 |
| 2022 | 197.19 | 17.69 | 1.115 | 331.63 |
| 2023 | 202.52 | 18.833 | 1.075 | 346.87 |
| 2024 | 206.34 | 19.896 | 1.037 | 360.72 |
Most of the education bill is still college. Vocational school is not a footnote.
Household “education” in the BEA accounts is not the public-school system. It is what families pay for education services: higher education, commercial and vocational schools, nursery through secondary schools, and educational books. In 2024 that bundle was $360.7 billion. Higher education was $206.3 billion, or 57 percent of it. Commercial and vocational schools were $82.8 billion, 23 percent — not a rounding error, and the one line that matches the federal push toward short-term job training that the same college-value coverage mentioned. Nursery, elementary and secondary schools were $63.0 billion. Educational books were $8.5 billion.
Those four lines add to the education total. They do not include state appropriations, endowment spending, or the $1.86 trillion loan stock. They also are not tuition “sticker prices.” They are what households actually booked as consumption. The implication is narrow and useful. If Americans are walking away from the four-year degree in surveys, they have not walked away from paying for school. They have shifted the mix, and they have let college grow more slowly than groceries, housing and health care.
Higher education is still most of the household education bill — vocational schools are not a rounding error

View exact chart values
| category | billions | share_of_education_pct |
|---|---|---|
| Higher education | 206.34 | 57.2 |
| Nursery, elementary, and secondary schools | 63.04 | 17.5 |
| Commercial and vocational schools | 82.84 | 23 |
| Educational books | 8.5 | 2.4 |
The payrolls did not boom with the AI decade
The employment record is even less dramatic than the dollar bill. The Bureau of Labor Statistics counts private junior colleges, colleges, universities and professional schools as a distinct industry. That private-campus payroll was 1.78 million in July 2013 and 1.81 million in June 2026, the latest month in this snapshot. It had been a little higher in 2017 and again in 2025 before slipping. Indexed to July 2013, private-college employment was barely above where it started, while total nonfarm payrolls were 16 percent higher by July 2026.
Public campuses do not live in that private series. Most of them sit in state government education, a broader bucket that also includes other state education employees, so it is college-adjacent rather than a clean headcount of professors. That payroll was 2.38 million in July 2013 and 2.61 million in July 2026, a 10 percent rise — more than private colleges, still well short of the rest of the job market. Add the two series and the combined college-adjacent workforce grew from 4.15 million in July 2013 to about 4.41 million in June 2026. The country added jobs. Campuses did not get them first.
None of that measures quality, completion, or whether a degree still pays. It does measure whether the industry Americans are downgrading in surveys has been a hiring engine. It has not. Private campuses spent the decade after Gallup’s 70 percent reading roughly treading water. Public-campus employment grew, then only in line with a government education workforce, not with a boom.
College-adjacent payrolls lagged the rest of the job market after 2013

View exact chart values
| year | private_colleges_thousands | state_gov_education_thousands | combined_college_adjacent_thousands | private_colleges_index_2013 | state_gov_ed_index_2013 | nonfarm_index_2013 |
|---|---|---|---|---|---|---|
| 1990 | 989.7 | 1732 | 2721.7 | 55.7 | 72.9 | 80.5 |
| 1991 | 1016.4 | 1767.9 | 2784.3 | 57.2 | 74.4 | 79.4 |
| 1992 | 980.9 | 1804.4 | 2785.3 | 55.2 | 76 | 79.8 |
| 1993 | 989.4 | 1830.8 | 2820.2 | 55.6 | 77.1 | 81.4 |
| 1994 | 1079.8 | 1884.5 | 2964.3 | 60.7 | 79.3 | 84 |
| 1995 | 1147.2 | 1916.6 | 3063.8 | 64.5 | 80.7 | 86.1 |
| 1996 | 1174.6 | 1913.1 | 3087.7 | 66 | 80.5 | 88 |
| 1997 | 1204.5 | 1921.2 | 3125.7 | 67.7 | 80.9 | 90.3 |
| 1998 | 1230 | 1927.6 | 3157.6 | 69.2 | 81.2 | 92.5 |
| 1999 | 1252.1 | 1980.1 | 3232.2 | 70.4 | 83.4 | 94.9 |
| 2000 | 1277.5 | 2021.5 | 3299 | 71.8 | 85.1 | 96.9 |
| 2001 | 1354.8 | 2130.3 | 3485.1 | 76.2 | 89.7 | 96.9 |
| 2002 | 1463.8 | 2286.5 | 3750.3 | 82.3 | 96.3 | 95.7 |
| 2003 | 1429.2 | 2246.3 | 3675.5 | 80.4 | 94.6 | 95.4 |
| 2004 | 1445.6 | 2238.8 | 3684.4 | 81.3 | 94.3 | 96.7 |
| 2005 | 1502.1 | 2262.4 | 3764.5 | 84.5 | 95.2 | 98.5 |
| 2006 | 1509 | 2293.5 | 3802.5 | 84.9 | 96.6 | 100.1 |
| 2007 | 1544.6 | 2310.8 | 3855.4 | 86.9 | 97.3 | 101.2 |
| 2008 | 1613.1 | 2364.9 | 3978 | 90.7 | 99.6 | 100.8 |
| 2009 | 1652.7 | 2314.5 | 3967.2 | 92.9 | 97.4 | 95.8 |
| 2010 | 1693.4 | 2372.3 | 4065.7 | 95.2 | 99.9 | 95.6 |
| 2011 | 1729.6 | 2379.5 | 4109.1 | 97.3 | 100.2 | 96.8 |
| 2012 | 1780.7 | 2391.6 | 4172.3 | 100.1 | 100.7 | 98.4 |
| 2013 | 1778.4 | 2375.3 | 4153.7 | 100 | 100 | 100 |
| 2014 | 1788.5 | 2371.3 | 4159.8 | 100.6 | 99.8 | 102 |
| 2015 | 1783.1 | 2396.1 | 4179.2 | 100.3 | 100.9 | 104.1 |
| 2016 | 1821.2 | 2433.2 | 4254.4 | 102.4 | 102.4 | 106 |
| 2017 | 1856.4 | 2490.7 | 4347.1 | 104.4 | 104.9 | 107.6 |
| 2018 | 1853.3 | 2480.7 | 4334 | 104.2 | 104.4 | 109.3 |
| 2019 | 1825.5 | 2499.9 | 4325.4 | 102.6 | 105.2 | 110.7 |
| 2020 | 1699.6 | 2386.4 | 4086 | 95.6 | 100.5 | 102.1 |
| 2021 | 1752.7 | 2506 | 4258.7 | 98.6 | 105.5 | 107.6 |
| 2022 | 1767.3 | 2477.9 | 4245.2 | 99.4 | 104.3 | 112.2 |
| 2023 | 1752.4 | 2561.5 | 4313.9 | 98.5 | 107.8 | 114.4 |
| 2024 | 1806.8 | 2599.6 | 4406.4 | 101.6 | 109.4 | 115.7 |
| 2025 | 1840.7 | 2626.7 | 4467.4 | 103.5 | 110.6 | 116.2 |
New England still spends the most. Every region spent a thinner slice.
The national share drop is not a coastal illusion. In 2024, higher education took 1.40 percent of household spending in New England, 1.28 percent in the Great Lakes, 1.23 percent in the Mideast, 1.09 percent in the Plains, 0.94 percent in the Far West, 0.90 percent in the Southwest, 0.87 percent in the Southeast and 0.80 percent in the Rocky Mountain region. New England remains the college region. The Rocky Mountain states remain the least college-intensive on these books.
Every one of those regions spent a smaller share on higher education in 2024 than in 2013. New England’s share fell from 1.84 percent to 1.40 percent. The Great Lakes fell from 1.75 percent to 1.28 percent. The Southeast, already a thinner slice, went from 1.26 percent to 0.87 percent. Nominal dollar spending still rose in each region — Rocky Mountain higher-education consumption was up 31 percent, the most of the eight — but total household budgets rose faster. The map did not flip. It compressed.
Every BEA region now spends a thinner slice of its budget on college

View exact chart values
| region | higher_ed_2013_billions | higher_ed_2024_billions | share_2013_pct | share_2024_pct | nominal_change_pct |
|---|---|---|---|---|---|
| New England | 11.71 | 14.72 | 1.84 | 1.403 | 25.7 |
| Great Lakes | 28.38 | 33.56 | 1.749 | 1.276 | 18.3 |
| Mideast | 31.91 | 39.58 | 1.611 | 1.231 | 24 |
| Plains | 10.93 | 13 | 1.465 | 1.087 | 19 |
| Far West | 28.04 | 35.2 | 1.378 | 0.943 | 25.5 |
| Southwest | 17.17 | 21.69 | 1.329 | 0.9 | 26.3 |
| Southeast | 33.8 | 42.34 | 1.262 | 0.869 | 25.3 |
| Rocky Mountain | 4.76 | 6.24 | 1.218 | 0.801 | 31.1 |
The college share of spending fell in every region after 2013

View exact chart values
| region | share_2013_pct | share_2024_pct |
|---|---|---|
| New England | 1.84 | 1.403 |
| Mideast | 1.611 | 1.231 |
| Great Lakes | 1.749 | 1.276 |
| Plains | 1.465 | 1.087 |
| Southeast | 1.262 | 0.869 |
| Southwest | 1.329 | 0.9 |
| Rocky Mountain | 1.218 | 0.801 |
| Far West | 1.378 | 0.943 |
What the books do not say
Two traps are worth walking around. The first is to treat a shrinking budget share as proof that college got cheaper. These figures are nominal. A 24 percent rise in the higher-education bill from 2013 to 2024 can still feel like a crisis in a household whose wages did not keep up, which is exactly the complaint in the Gallup and Lumina numbers. The second is to treat state government education as “public universities” and private-college payrolls as “professors.” Both series are payrolls, not classroom counts, and the public series is wider than campuses.
What the books do say is enough to answer the question. Households did not slash higher education in dollar terms through 2024. They let it grow more slowly than everything else they buy, until college was a smaller slice of consumption than it had been in 1997. The people who work at private colleges are barely more numerous than they were when Gallup last heard that college was “very important.” Public-campus employment grew, and not as fast as the rest of the labor market. Americans told a pollster they had fallen out of love with college. The spending and hiring records say they had already started to act like it.
Sources and methods
This package uses the pinned read-only catalogue snapshots, not live downloads. BEA state personal consumption expenditures (SAPCE4, millions of current dollars, calendar years 1997–2024) come from the August 31, 2026 normalized snapshot of the September 26, 2025 SAPCE release. BLS Current Employment Statistics come from the August 24, 2026 snapshot of the official CES bulk files; private college employment is observed through June 2026 and state government education and total nonfarm through July 2026. Those are observation periods in the snapshots, not current-day prints, and they predate the September 2026 jobs report in this edition.
Higher-education, education, vocational, K-12 and educational-books series are household consumption expenditures in current dollars, not tuition stickers, not government appropriations, not student-loan stocks, and not inflation-adjusted volumes. Shares are higher-education PCE divided by total PCE for the same geography and year. Null observations were skipped, not treated as zero. The four education components sum to the education total in 2024 within ordinary rounding.
Private junior colleges, colleges, universities and professional schools are a CES private-industry series (seasonally adjusted, thousands). State government education is a broader public payroll that includes public campuses and other state education employees; it is described as college-adjacent, not as a professor count. July values are used for year-to-year payroll indexes (July 2013 = 100) through 2025; the latest private-college month in this snapshot is June 2026. Regional comparisons use BEA regions, not states. No causal claim is made that Gallup answers caused spending or hiring changes.
Research completed 2026-10-04, for the October 3, 2026 news edition. The available source data may cover earlier periods; see the observation periods and source vintages above.