Research
A $4 billion Texas chip park, in a factory economy that already exists
The $4 billion is real money. It is not a new industry.
Taiwan is raising at least $4 billion through the Taiwan Electrical and Electronic Manufacturers’ Association to put an industrial park in Texas. The pitch, as Economic Affairs Minister Kung Ming-hsin told Bloomberg, is a long-term supply chain that smaller Taiwanese firms can join — the ones that cannot, unlike TSMC, spend $165 billion on an Arizona campus of their own. American companies are welcome, he said. The process technology is not being handed over for someone else’s vertical integration.
Four billion dollars is a serious cheque. It is also a rounding error on the economy already sitting in Texas. In 2025, Texas’s computer-and-electronic-product factories produced $31.5 billion of output, about 10 percent of the U.S. total of $315.4 billion. The proposed park is about 13 percent of that one-year Texas figure, and 0.14 percent of the state’s $2.93 trillion GDP. It is closer in size to Texas’s electrical-equipment factories, which booked $6.0 billion of output the same year — the supplier-ish industry a parts park would actually resemble.
A $4 billion park, next to the Texas electronics economy already on the books

View exact chart values
| item | billions |
|---|---|
| Proposed Texas park | 4 |
| Texas electrical-equipment GDP, 2025 | 6 |
| Texas computer-and-electronics GDP, 2025 | 31.5 |
Texas already has the second-largest electronics factory payroll in this set
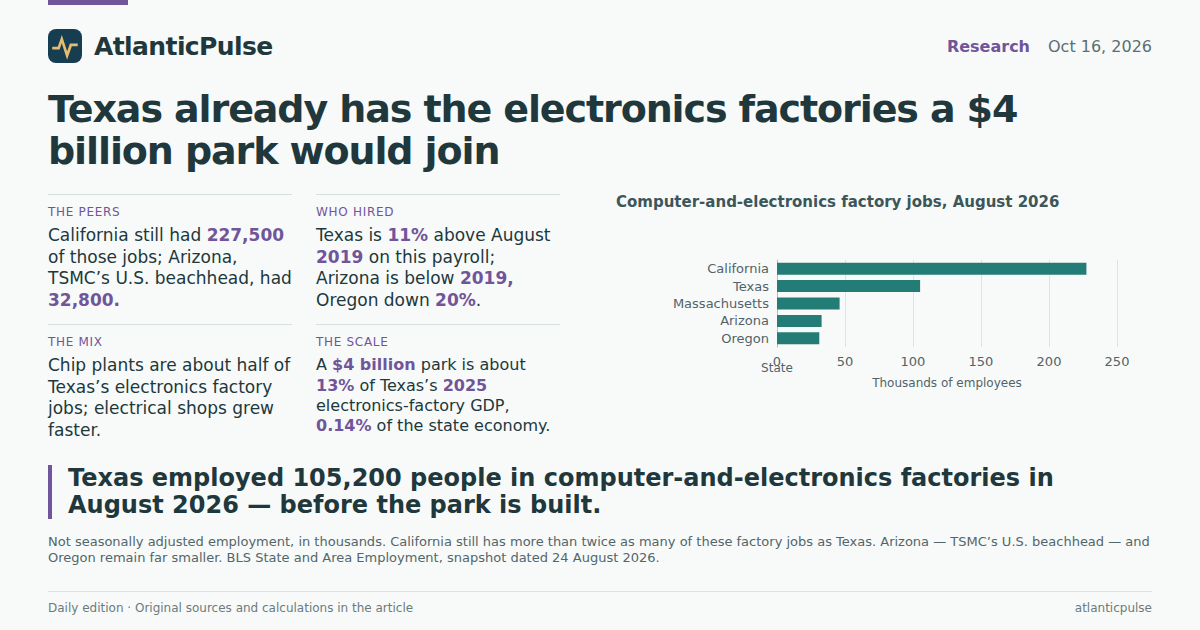
The jobs books are even blunter. In August 2026, Texas employed 105,200 people in computer and electronic product manufacturing, not seasonally adjusted. That is more than twice Massachusetts (46,000) and more than three times Arizona (32,800) or Oregon (31,100). California still dwarfs everyone, at 227,500. Those five states are the ones where the Bureau of Labor Statistics publishes a usable statewide series for this industry; they are also the ones the chip-onshoring story actually names.
Those 105,200 Texans are not a rounding error on a factory state, but they are not the factory state. They were 10.7 percent of Texas’s 984,800 manufacturing jobs that August. A park that helps smaller suppliers follow TSMC and Foxconn is attaching itself to a workforce that is already large by American electronics standards and still small by Texas standards. The $4 billion does not have to create an industry. The industry is already on the payroll.
Computer-and-electronics factory jobs, August 2026

View exact chart values
| state | jobs_thousands |
|---|---|
| California | 227.5 |
| Texas | 105.2 |
| Massachusetts | 46 |
| Arizona | 32.8 |
| Oregon | 31.1 |
The AI boom did not hire a new electronics workforce in Arizona
If the story were simply “fabs arrive, factory jobs follow,” Arizona should be the exhibit. TSMC has been pouring concrete there for years. The statewide computer-and-electronics payroll has not followed. August 2026 employment in Arizona was 32,800, below 33,600 in August 2019 and well below 38,300 in August 2010. Indexed to August 2019, Arizona sits at 97.6. Texas is at 110.9. California is at 92.9. Oregon, Intel’s long-time American home, is at 79.9 after a drop from 42,000 jobs in August 2022 to 31,100.
That is not a claim that TSMC subtracted jobs, or that Texas added them because of Taiwan. Construction crews and temporary contractors do not always show up in the factory series, and NAICS 334 mixes chip plants with computers, communications gear and instruments. What the official books do show is simpler, and more useful for a $4 billion supplier-park headline: the state where the marquee fabs are being built has not yet booked a statewide electronics-factory boom, and the state being offered as the suppliers’ next stop already has more than 100,000 of those jobs.
Computer-and-electronics factory jobs, August 2019 = 100

View exact chart values
| year | tx | tx_index | az | az_index | ca | ca_index | oregon | or_index | ma | ma_index |
|---|---|---|---|---|---|---|---|---|---|---|
| 2010 | 100.8 | 106.2 | 38.3 | 114 | 264.4 | 108 | 35.1 | 90.2 | 59.6 | 110.4 |
| 2011 | 104.6 | 110.2 | 39 | 116.1 | 267.7 | 109.4 | 37 | 95.1 | 57.8 | 107 |
| 2012 | 103.6 | 109.2 | 39.9 | 118.8 | 259.5 | 106 | 37.5 | 96.4 | 58.1 | 107.6 |
| 2013 | 100.4 | 105.8 | 37.4 | 111.3 | 251.4 | 102.7 | 37.2 | 95.6 | 57.4 | 106.3 |
| 2014 | 96.2 | 101.4 | 35.4 | 105.4 | 248.3 | 101.4 | 36.9 | 94.9 | 56.5 | 104.6 |
| 2015 | 93.2 | 98.2 | 34.4 | 102.4 | 247.2 | 101 | 38.1 | 97.9 | 56 | 103.7 |
| 2016 | 91.8 | 96.7 | 32.3 | 96.1 | 245.9 | 100.4 | 37.9 | 97.4 | 55 | 101.9 |
| 2017 | 91 | 95.9 | 32.8 | 97.6 | 242.5 | 99.1 | 37.3 | 95.9 | 53.8 | 99.6 |
| 2018 | 91.6 | 96.5 | 33 | 98.2 | 243.4 | 99.4 | 38.3 | 98.5 | 54 | 100 |
| 2019 | 94.9 | 100 | 33.6 | 100 | 244.8 | 100 | 38.9 | 100 | 54 | 100 |
| 2020 | 93.6 | 98.6 | 33.8 | 100.6 | 239.8 | 98 | 37.9 | 97.4 | 52.2 | 96.7 |
| 2021 | 94.7 | 99.8 | 32.9 | 97.9 | 241.9 | 98.8 | 38 | 97.7 | 51.6 | 95.6 |
| 2022 | 102.2 | 107.7 | 34.7 | 103.3 | 256.4 | 104.7 | 42 | 108 | 51.8 | 95.9 |
| 2023 | 105.3 | 111 | 35.4 | 105.4 | 243.6 | 99.5 | 40.7 | 104.6 | 50.3 | 93.1 |
| 2024 | 103.6 | 109.2 | 35 | 104.2 | 230.1 | 94 | 40.2 | 103.3 | 46.9 | 86.9 |
| 2025 | 103.8 | 109.4 | 33.3 | 99.1 | 226.2 | 92.4 | 35 | 90 | 45.5 | 84.3 |
| 2026 | 105.2 | 110.9 | 32.8 | 97.6 | 227.5 | 92.9 | 31.1 | 79.9 | 46 | 85.2 |
The shops that actually grew are the unglamorous ones
Inside Texas, the mix has shifted toward the things a supplier park would actually host. Semiconductor and other electronic-component plants employed 50,700 Texans in August 2026, up from 42,000 in August 2010, and now account for about 48 percent of the state’s computer-and-electronics factory payroll. Electrical equipment, appliances and components — motors, transformers, switchgear, batteries, wire — employed 28,400, up from 17,000. That electrical series grew faster, in percentage terms, than the chip plants. Austin’s semiconductor payroll, a useful check on whether the growth is just Dallas spreadsheets, rose from 11,600 in August 2010 to 17,100.
The computer-and-electronics total for Texas, 105,200, is only a little above 100,800 in August 2010. The mid-2010s slump took it down to 91,000 in August 2017; the 2022–23 bump took it to a recent peak of 105,300 in August 2023. This is not a disappearing industry, and it is not a hockey-stick hiring boom. It is a large, mature electronics factory base that added chip and electrical jobs while the headline count barely moved. A park for smaller Taiwanese suppliers is trying to join that base, not invent it.
Texas electronics factories: chips grew, so did the electrical shops

View exact chart values
| year | computer_electronics | semiconductors | electrical_equipment |
|---|---|---|---|
| 2010 | 100.8 | 42 | 17 |
| 2011 | 104.6 | 44.2 | 17.9 |
| 2012 | 103.6 | 43.8 | 19.1 |
| 2013 | 100.4 | 42.8 | 19.4 |
| 2014 | 96.2 | 40.6 | 19.7 |
| 2015 | 93.2 | 39.7 | 19.7 |
| 2016 | 91.8 | 39.2 | 18.8 |
| 2017 | 91 | 39.8 | 18.6 |
| 2018 | 91.6 | 40.9 | 19.8 |
| 2019 | 94.9 | 41.8 | 20.1 |
| 2020 | 93.6 | 41.9 | 19 |
| 2021 | 94.7 | 42.7 | 19.2 |
| 2022 | 102.2 | 47.1 | 20.9 |
| 2023 | 105.3 | 50.8 | 23.1 |
| 2024 | 103.6 | 50.3 | 25.3 |
| 2025 | 103.8 | 50.4 | 27.3 |
| 2026 | 105.2 | 50.7 | 28.4 |
California still books the output. Texas books the second-place factory.
Jobs and output do not tell the same story, because chip factories are capital-heavy. California’s computer-and-electronics plants produced $132.2 billion of GDP in 2025 — more than four times Texas’s $31.5 billion — even though California’s payroll is only a bit more than twice as large. Oregon, with 31,100 jobs, still booked $13.5 billion of output, ahead of Massachusetts ($12.8 billion) and well ahead of Arizona ($9.7 billion). Arizona’s 2025 figure is down from $11.6 billion in 2022. New York, which has spent years chasing a megafab of its own, booked $10.2 billion.
Texas’s computer-and-electronics output was 1.08 percent of the state’s economy in 2025. In real terms, chained 2017 dollars, that industry produced $29.4 billion in 2025, up from $26.2 billion in 2010 and $22.9 billion in 2019. The rebound is real. It is also the sort of rebound you get from a sector that already existed, not from a greenfield that has not been poured. Kung Ming-hsin is not wrong that smaller Taiwanese firms need a cheaper way to follow TSMC and Foxconn. The official books say they would be following them into a Texas electronics industry that already employs more than 100,000 people, already produces more than $30 billion a year, and is still, by California’s standard, the second factory in the room.
Computer-and-electronics factory output, 2025

View exact chart values
| state | gdp_billions |
|---|---|
| California | 132.2 |
| Texas | 31.5 |
| Oregon | 13.5 |
| Massachusetts | 12.8 |
| New York | 10.2 |
| Arizona | 9.7 |
Sources and methods
This is a retrospective reading of official payrolls and GDP against a 16 October 2026 news peg. It is not a current-day observation and not a reconstruction of what any official knew on a given morning.
Employment is from the Bureau of Labor Statistics State and Area Employment program, not seasonally adjusted, in thousands of employees. Statewide series cover computer and electronic product manufacturing (NAICS 334), semiconductor and other electronic component manufacturing (NAICS 3344), electrical equipment, appliance and component manufacturing (NAICS 335), and manufacturing. Austin-Round Rock-San Marcos is the metro semiconductor series. August-to-August comparisons avoid mixing in seasonal factory shutdowns; the latest month in the pinned snapshot is August 2026 (BLS SM snapshot dated 24 August 2026). Missing values were not treated as zero.
NAICS 334 is broader than semiconductor fabrication. It includes computers, communications equipment and instruments. Construction crews, contractors and temporary workers on a fab site may not appear in the factory series. Product-level geography dictionaries are not proof that every state publishes every industry; this article uses states with retrieved observations.
Output is Bureau of Economic Analysis annual GDP by state, millions of current dollars except where chained 2017 dollars are identified as real. The latest year is 2025 (BEA regional annual release dated 30 September 2026). Industry real GDP is chain-weighted and not additive across industries. Aggregate dollars are not household averages or plant-level productivity.
The $4 billion figure is the amount Taiwan’s manufacturers’ association says it is raising for a Texas park, as reported on 16 October 2026. It is not a completed capital expenditure, a jobs promise, or a claim that the park will be built at that size. No causal effect is inferred from Arizona’s TSMC construction or from Texas’s payroll path. Provider and refresh lag in the pinned catalogue is expected.
Research completed 2026-10-18, for the October 16, 2026 news edition. The available source data may cover earlier periods; see the observation periods and source vintages above.