Research
A $275 million nurse pitch, next to a $267 billion nursing-home bill
The infant line was already bending down
The CDC’s 2025 fertility report is the demographic headline of the week: the general fertility rate fell another 1 percent to a new record low, with births down 6 percent among women 20 to 24 and 7 percent among late teens. Women 30 to 45 are having more babies. Vermont mother Sarah Harris, who had her daughter at 37, put the household version in one sentence: one is enough. That is a story about choice, housing, daycare and whether a 20-something can imagine taking care of anyone else.
It is also a story the Census Bureau had already sketched, in slower motion. The Bureau’s 2023 middle-series national projections — published before this latest fertility drop, and labelled projections even for 2022 — show the infant cohort, age 0, slipping from 3.683 million in 2022 to 3.646 million in 2026 and 3.443 million in 2050. That is not the under-18 population, and it is not a birth count. It is a single year of age. Even so, the direction is the same as the CDC’s: fewer new children, year after year, in a projection that has not yet been rewritten for 2025’s steeper drop.
Put that infant line next to people turning 65 and the picture is already lopsided. The 2023 vintage had 91.6 infants for every 100 people aged 65 in 2022, 87.9 in 2026, and 83.5 in 2050. Age 65 is also a one-year slice, so the ratio is a comparison of two cohorts, not a dependency ratio for everyone over 65. It still answers the week’s question in the only way the official projection will allow: the pipeline of new children was already thinning relative to the pipeline of new 65-year-olds, and the 2025 fertility print makes that vintage look optimistic on the child side.
Census 2023 projections: infants stay flat while 85-year-olds more than double

View exact chart values
| year | age0_millions | age35_millions | age65_millions | age85_millions | total_millions | age0_share_pct | age85_share_pct | age0_per_100_age65 |
|---|---|---|---|---|---|---|---|---|
| 2022 | 3.683 | 4.477 | 4.021 | 0.962 | 333.288 | 1.105 | 0.289 | 91.6 |
| 2023 | 3.631 | 4.542 | 4.056 | 1.017 | 334.906 | 1.084 | 0.304 | 89.5 |
| 2024 | 3.637 | 4.64 | 4.056 | 1.034 | 336.482 | 1.081 | 0.307 | 89.7 |
| 2025 | 3.642 | 4.793 | 4.102 | 1.064 | 338.016 | 1.077 | 0.315 | 88.8 |
| 2026 | 3.646 | 4.8 | 4.146 | 1.116 | 339.513 | 1.074 | 0.329 | 87.9 |
| 2027 | 3.65 | 4.757 | 4.128 | 1.2 | 340.97 | 1.071 | 0.352 | 88.4 |
| 2028 | 3.654 | 4.683 | 4.091 | 1.357 | 342.385 | 1.067 | 0.396 | 89.3 |
| 2029 | 3.657 | 4.645 | 4.069 | 1.309 | 343.754 | 1.064 | 0.381 | 89.9 |
| 2030 | 3.659 | 4.592 | 3.959 | 1.314 | 345.074 | 1.06 | 0.381 | 92.4 |
| 2031 | 3.661 | 4.557 | 3.799 | 1.34 | 346.339 | 1.057 | 0.387 | 96.4 |
| 2032 | 3.661 | 4.583 | 3.734 | 1.848 | 347.545 | 1.053 | 0.532 | 98.1 |
| 2033 | 3.66 | 4.663 | 3.709 | 1.726 | 348.702 | 1.05 | 0.495 | 98.7 |
| 2034 | 3.657 | 4.779 | 3.779 | 1.737 | 349.808 | 1.045 | 0.497 | 96.8 |
| 2035 | 3.653 | 4.982 | 3.913 | 1.759 | 350.861 | 1.041 | 0.501 | 93.4 |
| 2036 | 3.647 | 5.068 | 3.963 | 1.819 | 351.861 | 1.036 | 0.517 | 92 |
| 2037 | 3.638 | 4.818 | 3.738 | 1.887 | 352.806 | 1.031 | 0.535 | 97.3 |
| 2038 | 3.628 | 4.708 | 3.564 | 1.939 | 353.696 | 1.026 | 0.548 | 101.8 |
| 2039 | 3.616 | 4.766 | 3.516 | 2.004 | 354.53 | 1.02 | 0.565 | 102.8 |
| 2040 | 3.601 | 4.757 | 3.58 | 2.059 | 355.309 | 1.014 | 0.58 | 100.6 |
| 2041 | 3.585 | 4.815 | 3.541 | 2.093 | 356.034 | 1.007 | 0.588 | 101.2 |
| 2042 | 3.568 | 4.904 | 3.664 | 2.176 | 356.705 | 1 | 0.61 | 97.4 |
| 2043 | 3.551 | 4.93 | 3.714 | 2.204 | 357.327 | 0.994 | 0.617 | 95.6 |
| 2044 | 3.534 | 4.79 | 3.801 | 2.213 | 357.903 | 0.987 | 0.618 | 93 |
| 2045 | 3.517 | 4.721 | 3.962 | 2.247 | 358.438 | 0.981 | 0.627 | 88.8 |
| 2046 | 3.501 | 4.656 | 3.987 | 2.281 | 358.936 | 0.975 | 0.636 | 87.8 |
| 2047 | 3.485 | 4.629 | 4.05 | 2.282 | 359.4 | 0.97 | 0.635 | 86.1 |
| 2048 | 3.47 | 4.639 | 4.067 | 2.271 | 359.836 | 0.964 | 0.631 | 85.3 |
| 2049 | 3.456 | 4.669 | 4.024 | 2.268 | 360.247 | 0.959 | 0.63 | 85.9 |
| 2050 | 3.443 | 4.697 | 4.122 | 2.217 | 360.639 | 0.955 | 0.615 | 83.5 |
Eighty-five is the line that actually moves
Nursing homes do not fill up with 65-year-olds. They fill up later. The same Census vintage has the age-85 cohort rising from 962,000 in 2022 to 1.116 million in 2026 and 2.217 million in 2050 — more than a doubling of that single year of age. The path is lumpy, as one-year birth cohorts always are; the late-2020s jump is a reminder not to read a smooth curve into a baby-boom echo. The level change is still the one that matches this week’s other announcement.
On Friday in Fort Myers, President Trump unveiled a $275 million Nurses for Nursing Homes program: up to $40,000 in loan repayment and a $10,000 stipend for a three-year, 30-hour-a-week commitment, funded from civil penalties, open in all 50 states, applications on Oct. 26. HHS framed it as rural staffing. The Census math says the demand side of that market is not a 2026 surprise. An 85-year-old cohort that more than doubles by mid-century is a slow-moving occupancy forecast, even if the 2023 vintage never heard of this week’s fertility print.
The household ledger already prefers nursing homes to classrooms
BEA personal consumption expenditures — current dollars, through 2025 — put a price tag on that shift without pretending it is a public-school budget. Households spent $267.43 billion on nursing-home services in 2025, up from $76.31 billion in 1997. They spent $66.46 billion on nursery, elementary and secondary schools, up from $20.71 billion. That school series is what families pay — private tuition and related outlays — not what districts spend. Even with that caveat, nursing homes were 3.69 times the household K-12-and-nursery bill in 1997 and 4.02 times in 2025.
Indexed to 1997, nursing-home spending is at 350.5, the school series at 320.9, and all household spending at 376.9. Nursing homes did not outrun the rest of the consumption basket; they roughly kept pace, and their share of total PCE actually slipped from 1.378 percent to 1.281 percent. Hospitals, for context, were a $1.612 trillion household line in 2025. The useful comparison for this week is narrower: the care bill attached to old age is already four times the household bill attached to childhood classrooms, and it has been for a generation.
Households still spend about four dollars on nursing homes for every dollar on private K-12

View exact chart values
| year | nursing_bil | school_bil | hospitals_bil | education_bil | total_pce_bil | nursing_share_pct | school_share_pct | nursing_over_school | nursing_index_1997 | school_index_1997 | hospitals_index_1997 | total_pce_index_1997 | education_index_1997 | nursing_per_capita | school_per_capita |
|---|---|---|---|---|---|---|---|---|---|---|---|---|---|---|---|
| 1997 | 76.31 | 20.71 | 345.49 | 107.12 | 5536.8 | 1.378 | 0.374 | 3.69 | 100 | 100 | 100 | 100 | 100 | 280 | 76 |
| 1998 | 81.54 | 21.49 | 360.08 | 115.24 | 5877.2 | 1.387 | 0.366 | 3.79 | 106.9 | 103.8 | 104.2 | 106.1 | 107.6 | 296 | 78 |
| 1999 | 83.22 | 22.77 | 373.24 | 123.93 | 6283.8 | 1.324 | 0.362 | 3.65 | 109.1 | 110 | 108 | 113.5 | 115.7 | 298 | 82 |
| 2000 | 87.91 | 24.12 | 393.89 | 134.29 | 6767.2 | 1.299 | 0.356 | 3.64 | 115.2 | 116.5 | 114 | 122.2 | 125.4 | 312 | 85 |
| 2001 | 93.66 | 25.69 | 427.11 | 143.62 | 7073.8 | 1.324 | 0.363 | 3.65 | 122.7 | 124.1 | 123.6 | 127.8 | 134.1 | 329 | 90 |
| 2002 | 98.61 | 26.86 | 469.54 | 149.53 | 7348.9 | 1.342 | 0.365 | 3.67 | 129.2 | 129.7 | 135.9 | 132.7 | 139.6 | 343 | 93 |
| 2003 | 105.66 | 27.7 | 498.44 | 159.52 | 7740.7 | 1.365 | 0.358 | 3.81 | 138.5 | 133.8 | 144.3 | 139.8 | 148.9 | 364 | 95 |
| 2004 | 111.76 | 28.56 | 537.86 | 169 | 8232 | 1.358 | 0.347 | 3.91 | 146.5 | 137.9 | 155.7 | 148.7 | 157.8 | 382 | 98 |
| 2005 | 118.97 | 29.56 | 577.15 | 180.51 | 8769.1 | 1.357 | 0.337 | 4.02 | 155.9 | 142.8 | 167.1 | 158.4 | 168.5 | 403 | 100 |
| 2006 | 124.18 | 31 | 617.04 | 193.07 | 9277.2 | 1.339 | 0.334 | 4.01 | 162.7 | 149.7 | 178.6 | 167.6 | 180.2 | 416 | 104 |
| 2007 | 133.81 | 32.76 | 658.08 | 206 | 9746.6 | 1.373 | 0.336 | 4.08 | 175.4 | 158.2 | 190.5 | 176 | 192.3 | 444 | 109 |
| 2008 | 141.58 | 34.18 | 689.8 | 216.43 | 10050.1 | 1.409 | 0.34 | 4.14 | 185.5 | 165.1 | 199.7 | 181.5 | 202 | 466 | 112 |
| 2009 | 147.99 | 34.97 | 736.32 | 226.05 | 9891.2 | 1.496 | 0.354 | 4.23 | 193.9 | 168.9 | 213.1 | 178.6 | 211 | 482 | 114 |
| 2010 | 155.1 | 35.57 | 769.88 | 240.31 | 10260.3 | 1.512 | 0.347 | 4.36 | 203.3 | 171.8 | 222.8 | 185.3 | 224.3 | 501 | 115 |
| 2011 | 157.91 | 35.88 | 796.97 | 248.21 | 10698.9 | 1.476 | 0.335 | 4.4 | 206.9 | 173.3 | 230.7 | 193.2 | 231.7 | 506 | 115 |
| 2012 | 161.13 | 36.5 | 830.32 | 250.59 | 11047.4 | 1.459 | 0.33 | 4.42 | 211.2 | 176.3 | 240.3 | 199.5 | 233.9 | 513 | 116 |
| 2013 | 163.94 | 37.84 | 857.68 | 255.99 | 11388.2 | 1.44 | 0.332 | 4.33 | 214.8 | 182.7 | 248.2 | 205.7 | 239 | 518 | 119 |
| 2014 | 169.33 | 38.95 | 894.64 | 261.98 | 11874.5 | 1.426 | 0.328 | 4.35 | 221.9 | 188.1 | 258.9 | 214.5 | 244.6 | 530 | 122 |
| 2015 | 175.07 | 41.18 | 949.46 | 269.96 | 12297.4 | 1.424 | 0.335 | 4.25 | 229.4 | 198.9 | 274.8 | 222.1 | 252 | 544 | 128 |
| 2016 | 182.28 | 44.18 | 992.62 | 278.97 | 12726.8 | 1.432 | 0.347 | 4.13 | 238.9 | 213.4 | 287.3 | 229.9 | 260.4 | 562 | 136 |
| 2017 | 185.64 | 45.79 | 1022.69 | 285.64 | 13290.6 | 1.397 | 0.345 | 4.05 | 243.3 | 221.1 | 296 | 240 | 266.7 | 568 | 140 |
| 2018 | 190.14 | 48.15 | 1072.21 | 293.5 | 13934.4 | 1.365 | 0.346 | 3.95 | 249.2 | 232.6 | 310.3 | 251.7 | 274 | 579 | 147 |
| 2019 | 197.04 | 49.43 | 1139.64 | 300.77 | 14437.5 | 1.365 | 0.342 | 3.99 | 258.2 | 238.7 | 329.9 | 260.8 | 280.8 | 597 | 150 |
| 2020 | 187.23 | 48.93 | 1087.46 | 296.1 | 14231.4 | 1.316 | 0.344 | 3.83 | 245.4 | 236.3 | 314.8 | 257 | 276.4 | 565 | 148 |
| 2021 | 190 | 54.2 | 1235.5 | 313.15 | 16114.8 | 1.179 | 0.336 | 3.51 | 249 | 261.8 | 357.6 | 291.1 | 292.3 | 572 | 163 |
| 2022 | 202.38 | 57.47 | 1300.94 | 331.59 | 17670.8 | 1.145 | 0.325 | 3.52 | 265.2 | 277.6 | 376.5 | 319.2 | 309.6 | 606 | 172 |
| 2023 | 226.75 | 59.47 | 1399.97 | 347.22 | 18772.6 | 1.208 | 0.317 | 3.81 | 297.1 | 287.2 | 405.2 | 339.1 | 324.1 | 673 | 177 |
| 2024 | 248.72 | 62.38 | 1505.78 | 361.09 | 19822.5 | 1.255 | 0.315 | 3.99 | 325.9 | 301.3 | 435.8 | 358 | 337.1 | 732 | 183 |
| 2025 | 267.43 | 66.46 | 1612 | 372.75 | 20870.2 | 1.281 | 0.318 | 4.02 | 350.5 | 320.9 | 466.6 | 376.9 | 348 | 782 | 194 |
Nursing-home spending rose 3.5 times since 1997 — a bit slower than the whole household bill

View exact chart values
| year | nursing_bil | school_bil | hospitals_bil | education_bil | total_pce_bil | nursing_share_pct | school_share_pct | nursing_over_school | nursing_index_1997 | school_index_1997 | hospitals_index_1997 | total_pce_index_1997 | education_index_1997 | nursing_per_capita | school_per_capita |
|---|---|---|---|---|---|---|---|---|---|---|---|---|---|---|---|
| 1997 | 76.31 | 20.71 | 345.49 | 107.12 | 5536.8 | 1.378 | 0.374 | 3.69 | 100 | 100 | 100 | 100 | 100 | 280 | 76 |
| 1998 | 81.54 | 21.49 | 360.08 | 115.24 | 5877.2 | 1.387 | 0.366 | 3.79 | 106.9 | 103.8 | 104.2 | 106.1 | 107.6 | 296 | 78 |
| 1999 | 83.22 | 22.77 | 373.24 | 123.93 | 6283.8 | 1.324 | 0.362 | 3.65 | 109.1 | 110 | 108 | 113.5 | 115.7 | 298 | 82 |
| 2000 | 87.91 | 24.12 | 393.89 | 134.29 | 6767.2 | 1.299 | 0.356 | 3.64 | 115.2 | 116.5 | 114 | 122.2 | 125.4 | 312 | 85 |
| 2001 | 93.66 | 25.69 | 427.11 | 143.62 | 7073.8 | 1.324 | 0.363 | 3.65 | 122.7 | 124.1 | 123.6 | 127.8 | 134.1 | 329 | 90 |
| 2002 | 98.61 | 26.86 | 469.54 | 149.53 | 7348.9 | 1.342 | 0.365 | 3.67 | 129.2 | 129.7 | 135.9 | 132.7 | 139.6 | 343 | 93 |
| 2003 | 105.66 | 27.7 | 498.44 | 159.52 | 7740.7 | 1.365 | 0.358 | 3.81 | 138.5 | 133.8 | 144.3 | 139.8 | 148.9 | 364 | 95 |
| 2004 | 111.76 | 28.56 | 537.86 | 169 | 8232 | 1.358 | 0.347 | 3.91 | 146.5 | 137.9 | 155.7 | 148.7 | 157.8 | 382 | 98 |
| 2005 | 118.97 | 29.56 | 577.15 | 180.51 | 8769.1 | 1.357 | 0.337 | 4.02 | 155.9 | 142.8 | 167.1 | 158.4 | 168.5 | 403 | 100 |
| 2006 | 124.18 | 31 | 617.04 | 193.07 | 9277.2 | 1.339 | 0.334 | 4.01 | 162.7 | 149.7 | 178.6 | 167.6 | 180.2 | 416 | 104 |
| 2007 | 133.81 | 32.76 | 658.08 | 206 | 9746.6 | 1.373 | 0.336 | 4.08 | 175.4 | 158.2 | 190.5 | 176 | 192.3 | 444 | 109 |
| 2008 | 141.58 | 34.18 | 689.8 | 216.43 | 10050.1 | 1.409 | 0.34 | 4.14 | 185.5 | 165.1 | 199.7 | 181.5 | 202 | 466 | 112 |
| 2009 | 147.99 | 34.97 | 736.32 | 226.05 | 9891.2 | 1.496 | 0.354 | 4.23 | 193.9 | 168.9 | 213.1 | 178.6 | 211 | 482 | 114 |
| 2010 | 155.1 | 35.57 | 769.88 | 240.31 | 10260.3 | 1.512 | 0.347 | 4.36 | 203.3 | 171.8 | 222.8 | 185.3 | 224.3 | 501 | 115 |
| 2011 | 157.91 | 35.88 | 796.97 | 248.21 | 10698.9 | 1.476 | 0.335 | 4.4 | 206.9 | 173.3 | 230.7 | 193.2 | 231.7 | 506 | 115 |
| 2012 | 161.13 | 36.5 | 830.32 | 250.59 | 11047.4 | 1.459 | 0.33 | 4.42 | 211.2 | 176.3 | 240.3 | 199.5 | 233.9 | 513 | 116 |
| 2013 | 163.94 | 37.84 | 857.68 | 255.99 | 11388.2 | 1.44 | 0.332 | 4.33 | 214.8 | 182.7 | 248.2 | 205.7 | 239 | 518 | 119 |
| 2014 | 169.33 | 38.95 | 894.64 | 261.98 | 11874.5 | 1.426 | 0.328 | 4.35 | 221.9 | 188.1 | 258.9 | 214.5 | 244.6 | 530 | 122 |
| 2015 | 175.07 | 41.18 | 949.46 | 269.96 | 12297.4 | 1.424 | 0.335 | 4.25 | 229.4 | 198.9 | 274.8 | 222.1 | 252 | 544 | 128 |
| 2016 | 182.28 | 44.18 | 992.62 | 278.97 | 12726.8 | 1.432 | 0.347 | 4.13 | 238.9 | 213.4 | 287.3 | 229.9 | 260.4 | 562 | 136 |
| 2017 | 185.64 | 45.79 | 1022.69 | 285.64 | 13290.6 | 1.397 | 0.345 | 4.05 | 243.3 | 221.1 | 296 | 240 | 266.7 | 568 | 140 |
| 2018 | 190.14 | 48.15 | 1072.21 | 293.5 | 13934.4 | 1.365 | 0.346 | 3.95 | 249.2 | 232.6 | 310.3 | 251.7 | 274 | 579 | 147 |
| 2019 | 197.04 | 49.43 | 1139.64 | 300.77 | 14437.5 | 1.365 | 0.342 | 3.99 | 258.2 | 238.7 | 329.9 | 260.8 | 280.8 | 597 | 150 |
| 2020 | 187.23 | 48.93 | 1087.46 | 296.1 | 14231.4 | 1.316 | 0.344 | 3.83 | 245.4 | 236.3 | 314.8 | 257 | 276.4 | 565 | 148 |
| 2021 | 190 | 54.2 | 1235.5 | 313.15 | 16114.8 | 1.179 | 0.336 | 3.51 | 249 | 261.8 | 357.6 | 291.1 | 292.3 | 572 | 163 |
| 2022 | 202.38 | 57.47 | 1300.94 | 331.59 | 17670.8 | 1.145 | 0.325 | 3.52 | 265.2 | 277.6 | 376.5 | 319.2 | 309.6 | 606 | 172 |
| 2023 | 226.75 | 59.47 | 1399.97 | 347.22 | 18772.6 | 1.208 | 0.317 | 3.81 | 297.1 | 287.2 | 405.2 | 339.1 | 324.1 | 673 | 177 |
| 2024 | 248.72 | 62.38 | 1505.78 | 361.09 | 19822.5 | 1.255 | 0.315 | 3.99 | 325.9 | 301.3 | 435.8 | 358 | 337.1 | 732 | 183 |
| 2025 | 267.43 | 66.46 | 1612 | 372.75 | 20870.2 | 1.281 | 0.318 | 4.02 | 350.5 | 320.9 | 466.6 | 376.9 | 348 | 782 | 194 |
Florida’s rally is not where the bill is fattest
Divide those nursing-home dollars by BEA midyear resident population and the national average in 2025 is $782 per person, up from $280 in 1997, with a pandemic dip in 2020–21 and the steepest climb of the series since 2022. Those are current dollars, not inflation-adjusted, so part of the tripling is prices. The level is still the one a $275 million recruitment pot has to live next to.
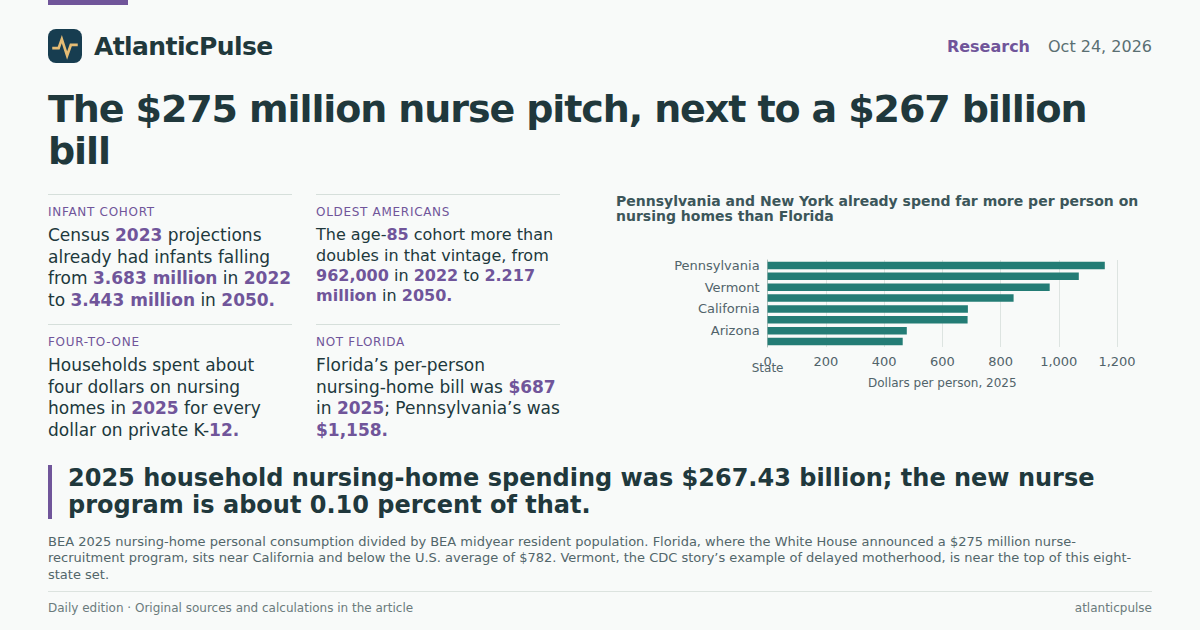
Among eight states that sit in this week’s reporting or in the usual retirement-and-size set, Pennsylvania spent $1,158 per person on nursing homes in 2025 and New York $1,069. Vermont — Harris’s state, and a place already watching elementary-school doors — spent $969. Maine spent $845. Florida, the rally state, spent $687, essentially tied with California at $688. Arizona and Texas, younger on paper, spent $478 and $464. The program is national. The existing bill is not evenly spread, and the campaign backdrop is not the high-spend end of the map.
The nursing-home bill per person nearly tripled in current dollars

View exact chart values
| year | nursing_bil | school_bil | hospitals_bil | education_bil | total_pce_bil | nursing_share_pct | school_share_pct | nursing_over_school | nursing_index_1997 | school_index_1997 | hospitals_index_1997 | total_pce_index_1997 | education_index_1997 | nursing_per_capita | school_per_capita |
|---|---|---|---|---|---|---|---|---|---|---|---|---|---|---|---|
| 1997 | 76.31 | 20.71 | 345.49 | 107.12 | 5536.8 | 1.378 | 0.374 | 3.69 | 100 | 100 | 100 | 100 | 100 | 280 | 76 |
| 1998 | 81.54 | 21.49 | 360.08 | 115.24 | 5877.2 | 1.387 | 0.366 | 3.79 | 106.9 | 103.8 | 104.2 | 106.1 | 107.6 | 296 | 78 |
| 1999 | 83.22 | 22.77 | 373.24 | 123.93 | 6283.8 | 1.324 | 0.362 | 3.65 | 109.1 | 110 | 108 | 113.5 | 115.7 | 298 | 82 |
| 2000 | 87.91 | 24.12 | 393.89 | 134.29 | 6767.2 | 1.299 | 0.356 | 3.64 | 115.2 | 116.5 | 114 | 122.2 | 125.4 | 312 | 85 |
| 2001 | 93.66 | 25.69 | 427.11 | 143.62 | 7073.8 | 1.324 | 0.363 | 3.65 | 122.7 | 124.1 | 123.6 | 127.8 | 134.1 | 329 | 90 |
| 2002 | 98.61 | 26.86 | 469.54 | 149.53 | 7348.9 | 1.342 | 0.365 | 3.67 | 129.2 | 129.7 | 135.9 | 132.7 | 139.6 | 343 | 93 |
| 2003 | 105.66 | 27.7 | 498.44 | 159.52 | 7740.7 | 1.365 | 0.358 | 3.81 | 138.5 | 133.8 | 144.3 | 139.8 | 148.9 | 364 | 95 |
| 2004 | 111.76 | 28.56 | 537.86 | 169 | 8232 | 1.358 | 0.347 | 3.91 | 146.5 | 137.9 | 155.7 | 148.7 | 157.8 | 382 | 98 |
| 2005 | 118.97 | 29.56 | 577.15 | 180.51 | 8769.1 | 1.357 | 0.337 | 4.02 | 155.9 | 142.8 | 167.1 | 158.4 | 168.5 | 403 | 100 |
| 2006 | 124.18 | 31 | 617.04 | 193.07 | 9277.2 | 1.339 | 0.334 | 4.01 | 162.7 | 149.7 | 178.6 | 167.6 | 180.2 | 416 | 104 |
| 2007 | 133.81 | 32.76 | 658.08 | 206 | 9746.6 | 1.373 | 0.336 | 4.08 | 175.4 | 158.2 | 190.5 | 176 | 192.3 | 444 | 109 |
| 2008 | 141.58 | 34.18 | 689.8 | 216.43 | 10050.1 | 1.409 | 0.34 | 4.14 | 185.5 | 165.1 | 199.7 | 181.5 | 202 | 466 | 112 |
| 2009 | 147.99 | 34.97 | 736.32 | 226.05 | 9891.2 | 1.496 | 0.354 | 4.23 | 193.9 | 168.9 | 213.1 | 178.6 | 211 | 482 | 114 |
| 2010 | 155.1 | 35.57 | 769.88 | 240.31 | 10260.3 | 1.512 | 0.347 | 4.36 | 203.3 | 171.8 | 222.8 | 185.3 | 224.3 | 501 | 115 |
| 2011 | 157.91 | 35.88 | 796.97 | 248.21 | 10698.9 | 1.476 | 0.335 | 4.4 | 206.9 | 173.3 | 230.7 | 193.2 | 231.7 | 506 | 115 |
| 2012 | 161.13 | 36.5 | 830.32 | 250.59 | 11047.4 | 1.459 | 0.33 | 4.42 | 211.2 | 176.3 | 240.3 | 199.5 | 233.9 | 513 | 116 |
| 2013 | 163.94 | 37.84 | 857.68 | 255.99 | 11388.2 | 1.44 | 0.332 | 4.33 | 214.8 | 182.7 | 248.2 | 205.7 | 239 | 518 | 119 |
| 2014 | 169.33 | 38.95 | 894.64 | 261.98 | 11874.5 | 1.426 | 0.328 | 4.35 | 221.9 | 188.1 | 258.9 | 214.5 | 244.6 | 530 | 122 |
| 2015 | 175.07 | 41.18 | 949.46 | 269.96 | 12297.4 | 1.424 | 0.335 | 4.25 | 229.4 | 198.9 | 274.8 | 222.1 | 252 | 544 | 128 |
| 2016 | 182.28 | 44.18 | 992.62 | 278.97 | 12726.8 | 1.432 | 0.347 | 4.13 | 238.9 | 213.4 | 287.3 | 229.9 | 260.4 | 562 | 136 |
| 2017 | 185.64 | 45.79 | 1022.69 | 285.64 | 13290.6 | 1.397 | 0.345 | 4.05 | 243.3 | 221.1 | 296 | 240 | 266.7 | 568 | 140 |
| 2018 | 190.14 | 48.15 | 1072.21 | 293.5 | 13934.4 | 1.365 | 0.346 | 3.95 | 249.2 | 232.6 | 310.3 | 251.7 | 274 | 579 | 147 |
| 2019 | 197.04 | 49.43 | 1139.64 | 300.77 | 14437.5 | 1.365 | 0.342 | 3.99 | 258.2 | 238.7 | 329.9 | 260.8 | 280.8 | 597 | 150 |
| 2020 | 187.23 | 48.93 | 1087.46 | 296.1 | 14231.4 | 1.316 | 0.344 | 3.83 | 245.4 | 236.3 | 314.8 | 257 | 276.4 | 565 | 148 |
| 2021 | 190 | 54.2 | 1235.5 | 313.15 | 16114.8 | 1.179 | 0.336 | 3.51 | 249 | 261.8 | 357.6 | 291.1 | 292.3 | 572 | 163 |
| 2022 | 202.38 | 57.47 | 1300.94 | 331.59 | 17670.8 | 1.145 | 0.325 | 3.52 | 265.2 | 277.6 | 376.5 | 319.2 | 309.6 | 606 | 172 |
| 2023 | 226.75 | 59.47 | 1399.97 | 347.22 | 18772.6 | 1.208 | 0.317 | 3.81 | 297.1 | 287.2 | 405.2 | 339.1 | 324.1 | 673 | 177 |
| 2024 | 248.72 | 62.38 | 1505.78 | 361.09 | 19822.5 | 1.255 | 0.315 | 3.99 | 325.9 | 301.3 | 435.8 | 358 | 337.1 | 732 | 183 |
| 2025 | 267.43 | 66.46 | 1612 | 372.75 | 20870.2 | 1.281 | 0.318 | 4.02 | 350.5 | 320.9 | 466.6 | 376.9 | 348 | 782 | 194 |
Pennsylvania and New York already spend far more per person on nursing homes than Florida

View exact chart values
| state | year | nursing_mil | population | nursing_per_capita |
|---|---|---|---|---|
| Pennsylvania | 2025 | 15116.4 | 13059432 | 1158 |
| New York | 2025 | 21380.7 | 20002427 | 1069 |
| Vermont | 2025 | 624.7 | 644663 | 969 |
| Maine | 2025 | 1195.4 | 1414874 | 845 |
| California | 2025 | 27071.6 | 39355309 | 688 |
| Florida | 2025 | 16112.5 | 23462518 | 687 |
| Arizona | 2025 | 3641.5 | 7623818 | 478 |
| Texas | 2025 | 14715.3 | 31709821 | 464 |
What $275 million is, on a $267 billion ledger
Take the new nurse initiative at face value: $275 million, once. 2025 household nursing-home spending was $267.43 billion. The program is about 0.10 percent of that annual bill. It is not nothing for a rural home that cannot hire. It is also not a demographic response commensurate with an 85-year-old cohort on track to more than double, or with a fertility rate that just made the last Census projection look high on infants.
None of this says the CDC print caused the nursing-home bill, or that loan repayment will fill shifts in Maine. It says the two stories that landed on the same day’s docket — fewer babies, more money for nursing-home nurses — were already visible as a crossing of lines on the official books: a shrinking infant cohort in a 2023 projection, a doubling of 85-year-olds in the same vintage, and a household ledger that has spent about four dollars on nursing homes for every dollar on private K-12 for as long as BEA has published the split. The $275 million is a rounding error on that ledger. The occupancy forecast is not.
Sources and methods
Census figures are the 2023 National Population Projections, middle series, all races and both sexes (origin 0, race 0, sex 0). Every observation in that extract is flagged as a projection, including 2022. They are not 2025–26 population counts and they do not incorporate the CDC’s later 2025 fertility decline, so the infant path is likely high relative to the new print.
Age 0, age 65 and age 85 are single years of age, not the under-18 or 65+ populations. Ratios of those series are cohort comparisons, not conventional dependency ratios. One-year cohorts are lumpy; the late-2020s jump in age 85 is a birth-cohort echo, not a smooth trend.
BEA personal consumption expenditures are current dollars through 2025 (SAPCE state tables, 2026-09-30 release). Nursing homes are household consumption of nursing-home services. Nursery, elementary and secondary schools are household outlays, chiefly private tuition, not public-school budgets. Shares and indexes are calculated from those current-dollar totals; they are not inflation-adjusted.
Per-person figures divide BEA nursing-home PCE by BEA SAINC1 midyear resident population for the same year and geography. State bars use 2025, the latest overlapping year in both extracts. The eight states are a reporting-driven set, not a complete ranking of all 50.
The $275 million program is compared with 2025 annual nursing-home PCE as a size check only. That is not a staffing model, a multi-year appropriation, or a claim about how many nurses $275 million hires. No causal link is drawn from fertility to spending or from the program to occupancy.
Research completed 2026-10-25, for the October 24, 2026 news edition. The available source data may cover earlier periods; see the observation periods and source vintages above.