Research
A $2 billion battery plant is not a Michigan factory-job recovery
The ribbon-cutting and the payroll
On 19 August 2026, LG Energy Solution said it had started production at a $2 billion, 226-acre battery plant in Lansing. The factory is designed for more than 35 gigawatt-hours a year and as many as 1,700 jobs. Lithium-iron-phosphate cells are meant for grid storage; nickel-manganese-cobalt cells will go into Toyota’s 2027 Highlander EV, assembled in Kentucky. The company already employs about 900 people there and has invested more than $5 billion in Michigan since 2010. It is the sort of announcement that sounds like a turning point for a state whose identity is still welded to the assembly line.
The payroll file is less cinematic. Seasonally adjusted manufacturing employment in Michigan was 585,500 in July 2026, according to the Bureau of Labor Statistics State and Area Employment series. That is 34 percent below January 2000, when the state still carried 888,100 factory jobs, and 6.5 percent below July 2019. The series peaked at 896,500 in June 2000. The post-2008 low was not the Great Recession trough but April 2020, at 403,300, during the pandemic shutdown. Manufacturing’s share of Michigan nonfarm employment has slid from 19.1 percent at the start of 2000 to 13.0 percent in July 2026. A plant that might eventually add 1,700 jobs is real. It is also smaller than the month-to-month noise on a half-million-job payroll.
July 2026 is the last month in this employment snapshot. LG’s production start was reported in mid-August, so these figures are a baseline, not a verdict on the Lansing line. They do answer a simpler question that the ribbon-cutting invites: had Michigan’s factory workforce already turned up before the first cells rolled? It had not.
Michigan factory payrolls never recaptured the 2000 peak

View exact chart values
| period | jobs_thousands |
|---|---|
| 2000-01 | 888.1 |
| 2000-02 | 889.5 |
| 2000-03 | 885.1 |
| 2000-04 | 894.6 |
| 2000-05 | 894.9 |
| 2000-06 | 896.5 |
| 2000-07 | 893.4 |
| 2000-08 | 885.7 |
| 2000-09 | 877.3 |
| 2000-10 | 882.3 |
| 2000-11 | 876.7 |
| 2000-12 | 871 |
| 2001-01 | 841.5 |
| 2001-02 | 847.1 |
| 2001-03 | 839.3 |
| 2001-04 | 832.3 |
| 2001-05 | 823 |
| 2001-06 | 817.9 |
| 2001-07 | 810.8 |
| 2001-08 | 799.8 |
| 2001-09 | 797 |
| 2001-10 | 784.9 |
| 2001-11 | 776 |
| 2001-12 | 772.6 |
| 2002-01 | 755.6 |
| 2002-02 | 765 |
| 2002-03 | 761 |
| 2002-04 | 758.1 |
| 2002-05 | 754.4 |
| 2002-06 | 755.5 |
| 2002-07 | 760.6 |
| 2002-08 | 751.3 |
| 2002-09 | 747.5 |
| 2002-10 | 747 |
| 2002-11 | 743.9 |
| 2002-12 | 739.7 |
| 2003-01 | 733.1 |
| 2003-02 | 726.2 |
| 2003-03 | 723.6 |
| 2003-04 | 712.7 |
| 2003-05 | 712.8 |
| 2003-06 | 714 |
| 2003-07 | 690.9 |
| 2003-08 | 704.2 |
| 2003-09 | 700.5 |
| 2003-10 | 697.3 |
| 2003-11 | 697.1 |
| 2003-12 | 695 |
| 2004-01 | 698.6 |
| 2004-02 | 693.2 |
| 2004-03 | 694.5 |
| 2004-04 | 697 |
| 2004-05 | 693.9 |
| 2004-06 | 689.2 |
| 2004-07 | 671.2 |
| 2004-08 | 688.9 |
| 2004-09 | 687.9 |
| 2004-10 | 686.7 |
| 2004-11 | 683 |
| 2004-12 | 682.5 |
| 2005-01 | 675 |
| 2005-02 | 681.7 |
| 2005-03 | 676.3 |
| 2005-04 | 673.4 |
| 2005-05 | 673.7 |
| 2005-06 | 667.4 |
| 2005-07 | 658.9 |
| 2005-08 | 658.4 |
| 2005-09 | 662.3 |
| 2005-10 | 664 |
| 2005-11 | 662.8 |
| 2005-12 | 659.3 |
| 2006-01 | 655.6 |
| 2006-02 | 650.6 |
| 2006-03 | 649.8 |
| 2006-04 | 653 |
| 2006-05 | 648.2 |
| 2006-06 | 645.4 |
| 2006-07 | 625 |
| 2006-08 | 632.5 |
| 2006-09 | 629.6 |
| 2006-10 | 623.2 |
| 2006-11 | 624.6 |
| 2006-12 | 622.6 |
| 2007-01 | 610.8 |
| 2007-02 | 620.7 |
| 2007-03 | 619.9 |
| 2007-04 | 618 |
| 2007-05 | 614.1 |
| 2007-06 | 612.2 |
| 2007-07 | 606.9 |
| 2007-08 | 606.1 |
| 2007-09 | 601 |
| 2007-10 | 591.1 |
| 2007-11 | 596.9 |
| 2007-12 | 595.9 |
| 2008-01 | 591.5 |
| 2008-02 | 590.7 |
| 2008-03 | 579.2 |
| 2008-04 | 569.4 |
| 2008-05 | 565.5 |
| 2008-06 | 579.8 |
| 2008-07 | 554.3 |
| 2008-08 | 556.3 |
| 2008-09 | 551.4 |
| 2008-10 | 545.8 |
| 2008-11 | 540.9 |
| 2008-12 | 531.2 |
| 2009-01 | 467.8 |
| 2009-02 | 480.1 |
| 2009-03 | 477.1 |
| 2009-04 | 466.9 |
| 2009-05 | 443.9 |
| 2009-06 | 431.3 |
| 2009-07 | 442.5 |
| 2009-08 | 445.6 |
| 2009-09 | 450 |
| 2009-10 | 453.9 |
| 2009-11 | 450.1 |
| 2009-12 | 452.4 |
| 2010-01 | 455 |
| 2010-02 | 454.3 |
| 2010-03 | 454.8 |
| 2010-04 | 460.4 |
| 2010-05 | 462.8 |
| 2010-06 | 465.5 |
| 2010-07 | 475.2 |
| 2010-08 | 461.5 |
| 2010-09 | 472.5 |
| 2010-10 | 476.1 |
| 2010-11 | 477.5 |
| 2010-12 | 478.7 |
| 2011-01 | 483.5 |
| 2011-02 | 486.8 |
| 2011-03 | 490.1 |
| 2011-04 | 498 |
| 2011-05 | 499.8 |
| 2011-06 | 501.6 |
| 2011-07 | 506.3 |
| 2011-08 | 505.3 |
| 2011-09 | 507.6 |
| 2011-10 | 511 |
| 2011-11 | 514.4 |
| 2011-12 | 518.2 |
| 2012-01 | 521.3 |
| 2012-02 | 522.3 |
| 2012-03 | 525.9 |
| 2012-04 | 526.5 |
| 2012-05 | 528.8 |
| 2012-06 | 530 |
| 2012-07 | 537.6 |
| 2012-08 | 532.6 |
| 2012-09 | 533 |
| 2012-10 | 534.4 |
| 2012-11 | 534.9 |
| 2012-12 | 539.1 |
| 2013-01 | 538.8 |
| 2013-02 | 541.7 |
| 2013-03 | 545.1 |
| 2013-04 | 544.1 |
| 2013-05 | 545.9 |
| 2013-06 | 547.8 |
| 2013-07 | 544.5 |
| 2013-08 | 551.2 |
| 2013-09 | 553.7 |
| 2013-10 | 557 |
| 2013-11 | 558.4 |
| 2013-12 | 557 |
| 2014-01 | 557.5 |
| 2014-02 | 565.6 |
| 2014-03 | 567.8 |
| 2014-04 | 568.8 |
| 2014-05 | 572.7 |
| 2014-06 | 580 |
| 2014-07 | 579.9 |
| 2014-08 | 580.3 |
| 2014-09 | 575.2 |
| 2014-10 | 579.5 |
| 2014-11 | 582.7 |
| 2014-12 | 588 |
| 2015-01 | 585.4 |
| 2015-02 | 585.2 |
| 2015-03 | 585.3 |
| 2015-04 | 586.4 |
| 2015-05 | 589.6 |
| 2015-06 | 590.8 |
| 2015-07 | 594.1 |
| 2015-08 | 595 |
| 2015-09 | 596.9 |
| 2015-10 | 596.5 |
| 2015-11 | 597.4 |
| 2015-12 | 599 |
| 2016-01 | 603.8 |
| 2016-02 | 600.1 |
| 2016-03 | 600 |
| 2016-04 | 606.3 |
| 2016-05 | 603.1 |
| 2016-06 | 606 |
| 2016-07 | 607 |
| 2016-08 | 604 |
| 2016-09 | 607.6 |
| 2016-10 | 608 |
| 2016-11 | 611.7 |
| 2016-12 | 611.5 |
| 2017-01 | 615.5 |
| 2017-02 | 614.1 |
| 2017-03 | 614.1 |
| 2017-04 | 615.4 |
| 2017-05 | 617.1 |
| 2017-06 | 617 |
| 2017-07 | 608.8 |
| 2017-08 | 617.8 |
| 2017-09 | 615.9 |
| 2017-10 | 618.7 |
| 2017-11 | 620 |
| 2017-12 | 621 |
| 2018-01 | 621.3 |
| 2018-02 | 624.7 |
| 2018-03 | 627.5 |
| 2018-04 | 628.3 |
| 2018-05 | 628.9 |
| 2018-06 | 628 |
| 2018-07 | 628.3 |
| 2018-08 | 629.7 |
| 2018-09 | 631.3 |
| 2018-10 | 633.7 |
| 2018-11 | 633.4 |
| 2018-12 | 634.8 |
| 2019-01 | 628.9 |
| 2019-02 | 634.3 |
| 2019-03 | 633.4 |
| 2019-04 | 630.7 |
| 2019-05 | 628.2 |
| 2019-06 | 630.4 |
| 2019-07 | 626.4 |
| 2019-08 | 629.6 |
| 2019-09 | 629.1 |
| 2019-10 | 605.9 |
| 2019-11 | 625.2 |
| 2019-12 | 623.9 |
| 2020-01 | 621 |
| 2020-02 | 620.8 |
| 2020-03 | 617.6 |
| 2020-04 | 403.3 |
| 2020-05 | 429.9 |
| 2020-06 | 552.8 |
| 2020-07 | 568.2 |
| 2020-08 | 570.1 |
| 2020-09 | 572.2 |
| 2020-10 | 578.1 |
| 2020-11 | 579.9 |
| 2020-12 | 582.3 |
| 2021-01 | 586.3 |
| 2021-02 | 586 |
| 2021-03 | 589.2 |
| 2021-04 | 569.2 |
| 2021-05 | 575 |
| 2021-06 | 576.9 |
| 2021-07 | 580 |
| 2021-08 | 581.4 |
| 2021-09 | 586.4 |
| 2021-10 | 597.2 |
| 2021-11 | 599 |
| 2021-12 | 599.3 |
| 2022-01 | 598.7 |
| 2022-02 | 595.8 |
| 2022-03 | 605.5 |
| 2022-04 | 605.7 |
| 2022-05 | 604.9 |
| 2022-06 | 608.7 |
| 2022-07 | 616 |
| 2022-08 | 612.6 |
| 2022-09 | 612.3 |
| 2022-10 | 614.3 |
| 2022-11 | 614.1 |
| 2022-12 | 616 |
| 2023-01 | 617.5 |
| 2023-02 | 618.1 |
| 2023-03 | 619.5 |
| 2023-04 | 619.9 |
| 2023-05 | 620.2 |
| 2023-06 | 621.5 |
| 2023-07 | 626.2 |
| 2023-08 | 620.7 |
| 2023-09 | 621.6 |
| 2023-10 | 603.2 |
| 2023-11 | 613.1 |
| 2023-12 | 613.8 |
| 2024-01 | 613.7 |
| 2024-02 | 611.6 |
| 2024-03 | 610.2 |
| 2024-04 | 609.2 |
| 2024-05 | 610.1 |
| 2024-06 | 608.2 |
| 2024-07 | 602 |
| 2024-08 | 606.7 |
| 2024-09 | 607 |
| 2024-10 | 591.5 |
| 2024-11 | 595.2 |
| 2024-12 | 595.6 |
| 2025-01 | 578.7 |
| 2025-02 | 590.6 |
| 2025-03 | 589.2 |
| 2025-04 | 589.2 |
| 2025-05 | 590.1 |
| 2025-06 | 587.9 |
| 2025-07 | 586.7 |
| 2025-08 | 585.4 |
| 2025-09 | 585.4 |
| 2025-10 | 584.7 |
| 2025-11 | 581.9 |
| 2025-12 | 582.5 |
| 2026-01 | 578.7 |
| 2026-02 | 579 |
| 2026-03 | 580.4 |
| 2026-04 | 579.9 |
| 2026-05 | 582.4 |
| 2026-06 | 581.9 |
| 2026-07 | 585.5 |
The 2019 test, and the states that passed it
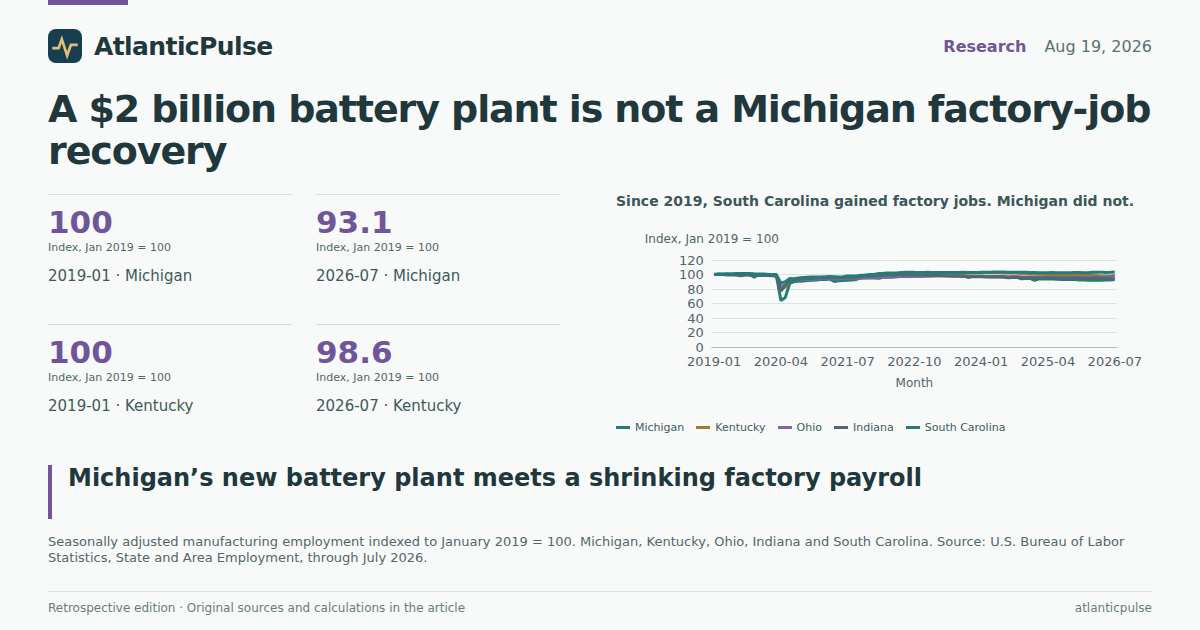
Index every state’s manufacturing payroll to January 2019 and the divergence is blunt. By July 2026 Michigan sat at 93.1 on that index. Indiana was 94.0, Ohio 97.9, Kentucky 98.6. South Carolina — which is also stacking battery and auto work — was 103.4. From July 2019 to July 2026, seasonally adjusted factory jobs fell 6.5 percent in Michigan, 4.5 percent in Indiana, 2.2 percent in Ohio and 1.5 percent in Kentucky. They rose 2.0 percent in South Carolina. The pandemic collapse and rebound are visible in every line. The recovery did not return Michigan to its pre-Covid factory headcount.
That is not because Michigan stopped hiring everywhere. Construction employment in the state was 200,700 in July 2026, up 15.2 percent from July 2019. Durable-goods factories still dominate what remains of the shop floor — 438,200 jobs against 147,300 in nondurables — but the mix has shifted toward building sites rather than battery halls. Total nonfarm employment was 4.50 million. The factory share is smaller because other payrolls held up better, not because manufacturing staged a stealth boom.
Lansing itself is only a modest exception. Not-seasonally-adjusted manufacturing employment in the Lansing–East Lansing metro area was 20,000 in July 2026, against 19,300 in July 2019. The 12-month average ending July 2026 was 20,120 jobs. Calendar-year averages drifted from about 17,100 in 2010 to a recent plateau near 20,700–20,900 in 2022–24, then eased. A 1,700-job plant, if it staffs as advertised, would be a large local event. It would not rewrite the statewide series.
Since 2019, South Carolina gained factory jobs. Michigan did not.

View exact chart values
| period | Michigan | Kentucky | Ohio | Indiana | South_Carolina |
|---|---|---|---|---|---|
| 2019-01 | 100 | 100 | 100 | 100 | 100 |
| 2019-02 | 100.9 | 99.9 | 100 | 100 | 100 |
| 2019-03 | 100.7 | 99.8 | 99.9 | 99.9 | 100.4 |
| 2019-04 | 100.3 | 99.8 | 99.9 | 99.5 | 100.9 |
| 2019-05 | 99.9 | 99.8 | 100 | 99.6 | 101.1 |
| 2019-06 | 100.2 | 99.6 | 99.9 | 99.5 | 101.3 |
| 2019-07 | 99.6 | 100.2 | 100.1 | 98.4 | 101.4 |
| 2019-08 | 100.1 | 100.2 | 99.7 | 99.4 | 101.4 |
| 2019-09 | 100 | 100 | 99.5 | 99.3 | 101.2 |
| 2019-10 | 96.3 | 99.1 | 98.8 | 99 | 100.9 |
| 2019-11 | 99.4 | 99.8 | 98.9 | 98.9 | 100.8 |
| 2019-12 | 99.2 | 99.4 | 98.6 | 98.8 | 100.7 |
| 2020-01 | 98.7 | 99.3 | 98.8 | 98.5 | 100.3 |
| 2020-02 | 98.7 | 99 | 98.5 | 98.3 | 100 |
| 2020-03 | 98.2 | 98.3 | 98.3 | 97.9 | 99.8 |
| 2020-04 | 64.1 | 81.2 | 82.9 | 77.2 | 88 |
| 2020-05 | 68.4 | 82.6 | 85.8 | 84.8 | 90.1 |
| 2020-06 | 87.9 | 91.8 | 92.1 | 91.7 | 94.6 |
| 2020-07 | 90.3 | 92.9 | 92.1 | 92.6 | 94.1 |
| 2020-08 | 90.7 | 93.5 | 92.3 | 93.4 | 95.3 |
| 2020-09 | 91 | 94.2 | 93.1 | 94 | 95.8 |
| 2020-10 | 91.9 | 94.7 | 93.3 | 94.3 | 96.2 |
| 2020-11 | 92.2 | 94.9 | 93.5 | 94.3 | 96.4 |
| 2020-12 | 92.6 | 95.4 | 93.9 | 95 | 96.5 |
| 2021-01 | 93.2 | 95.6 | 94 | 95.5 | 96.7 |
| 2021-02 | 93.2 | 95.8 | 94.1 | 95.4 | 97 |
| 2021-03 | 93.7 | 96.1 | 94.5 | 96 | 97.1 |
| 2021-04 | 90.5 | 95.3 | 93.7 | 95.5 | 97 |
| 2021-05 | 91.4 | 95.7 | 93.9 | 95.6 | 96.7 |
| 2021-06 | 91.7 | 95 | 94.1 | 96 | 96.9 |
| 2021-07 | 92.2 | 96.2 | 94.5 | 96.6 | 97.8 |
| 2021-08 | 92.4 | 96.2 | 94.8 | 95.8 | 97.8 |
| 2021-09 | 93.2 | 96.2 | 94.7 | 96.4 | 97.9 |
| 2021-10 | 95 | 96.9 | 95.3 | 97.2 | 98.9 |
| 2021-11 | 95.2 | 97.2 | 95.6 | 97.8 | 99.4 |
| 2021-12 | 95.3 | 97.4 | 95.9 | 97.9 | 100.1 |
| 2022-01 | 95.2 | 97.6 | 95.8 | 98.1 | 100.1 |
| 2022-02 | 94.7 | 97.9 | 96.3 | 98.6 | 101.4 |
| 2022-03 | 96.3 | 97.9 | 96.7 | 99 | 101.8 |
| 2022-04 | 96.3 | 99.4 | 97.1 | 99.3 | 102.2 |
| 2022-05 | 96.2 | 99.5 | 97.2 | 99.4 | 102.2 |
| 2022-06 | 96.8 | 99.7 | 96.9 | 99.2 | 102.1 |
| 2022-07 | 97.9 | 100.6 | 97.4 | 100.1 | 102.7 |
| 2022-08 | 97.4 | 100.6 | 97.4 | 99.7 | 103.2 |
| 2022-09 | 97.4 | 100.8 | 97.5 | 99.5 | 103.2 |
| 2022-10 | 97.7 | 100.9 | 97.8 | 99.7 | 103.1 |
| 2022-11 | 97.6 | 100.8 | 97.7 | 99.8 | 102.9 |
| 2022-12 | 97.9 | 100.9 | 97.7 | 99.5 | 102.8 |
| 2023-01 | 98.2 | 100 | 97.9 | 98.2 | 103.1 |
| 2023-02 | 98.3 | 100.3 | 97.8 | 99.1 | 102.9 |
| 2023-03 | 98.5 | 101.3 | 97.9 | 98.8 | 102.9 |
| 2023-04 | 98.6 | 101.5 | 97.9 | 98.5 | 102.7 |
| 2023-05 | 98.6 | 101.4 | 97.9 | 98.2 | 102.8 |
| 2023-06 | 98.8 | 101.5 | 98.1 | 98.1 | 102.9 |
| 2023-07 | 99.6 | 101.9 | 98.1 | 97.7 | 102.9 |
| 2023-08 | 98.7 | 101.8 | 97.9 | 97.5 | 102.9 |
| 2023-09 | 98.8 | 102.1 | 98 | 97.4 | 103 |
| 2023-10 | 95.9 | 101.7 | 96.7 | 97.1 | 102.9 |
| 2023-11 | 97.5 | 102.1 | 97.2 | 96.9 | 102.9 |
| 2023-12 | 97.6 | 102.3 | 97.4 | 97 | 102.9 |
| 2024-01 | 97.6 | 102.4 | 97.5 | 96.8 | 103 |
| 2024-02 | 97.2 | 102.4 | 97.4 | 96.6 | 103 |
| 2024-03 | 97 | 102.3 | 97.4 | 96.6 | 103.1 |
| 2024-04 | 96.9 | 102.3 | 97.3 | 96.5 | 103.3 |
| 2024-05 | 97 | 102.3 | 97.4 | 96.7 | 103.3 |
| 2024-06 | 96.7 | 102.2 | 97.4 | 96.6 | 103.5 |
| 2024-07 | 95.7 | 102 | 96.9 | 95.4 | 103.2 |
| 2024-08 | 96.5 | 102 | 97 | 95.7 | 103.1 |
| 2024-09 | 96.5 | 101.9 | 97.2 | 95.8 | 103.1 |
| 2024-10 | 94.1 | 101.3 | 96.4 | 95.5 | 103 |
| 2024-11 | 94.6 | 101.3 | 96.6 | 95.5 | 103 |
| 2024-12 | 94.7 | 100.8 | 96.5 | 95.4 | 102.9 |
| 2025-01 | 92 | 100.3 | 96 | 95.2 | 102.7 |
| 2025-02 | 93.9 | 100.3 | 96.5 | 95.3 | 102.5 |
| 2025-03 | 93.7 | 100.4 | 96.5 | 95.3 | 102.5 |
| 2025-04 | 93.7 | 100.2 | 96.5 | 95.3 | 102.5 |
| 2025-05 | 93.8 | 100.4 | 96.4 | 95.2 | 102.9 |
| 2025-06 | 93.5 | 100 | 96.3 | 95 | 102.5 |
| 2025-07 | 93.3 | 99.8 | 96 | 94.3 | 102.4 |
| 2025-08 | 93.1 | 99.6 | 96.1 | 94.9 | 102.5 |
| 2025-09 | 93.1 | 99.4 | 95.9 | 94.8 | 102.5 |
| 2025-10 | 93 | 99.3 | 96.4 | 95 | 102.8 |
| 2025-11 | 92.5 | 99.4 | 96.6 | 94.8 | 102.6 |
| 2025-12 | 92.6 | 99.2 | 96.6 | 94.6 | 102.4 |
| 2026-01 | 92 | 99.7 | 96.3 | 94.7 | 102.3 |
| 2026-02 | 92.1 | 99.3 | 96.4 | 95.1 | 103.2 |
| 2026-03 | 92.3 | 98.6 | 96.1 | 95.4 | 103.1 |
| 2026-04 | 92.2 | 98.1 | 96.7 | 94.7 | 103 |
| 2026-05 | 92.6 | 97.8 | 96.8 | 94.8 | 102.7 |
| 2026-06 | 92.5 | 97.9 | 97.2 | 94.3 | 103 |
| 2026-07 | 93.1 | 98.6 | 97.9 | 94 | 103.4 |
Factory-job change since July 2019, auto-belt states

View exact chart values
| state | jobs_thousands | latest_period | change_vs_jul2019_pct | change_vs_jul2022_pct | change_vs_jul2025_pct | jobs_jul2019 |
|---|---|---|---|---|---|---|
| Michigan | 585.5 | 2026-07 | -6.5 | -5 | -0.2 | 626.4 |
| Indiana | 512 | 2026-07 | -4.5 | -6.1 | -0.4 | 535.9 |
| Ohio | 688.7 | 2026-07 | -2.2 | 0.6 | 2 | 704.2 |
| Kentucky | 249.3 | 2026-07 | -1.5 | -1.9 | -1.2 | 253.2 |
| South Carolina | 264.5 | 2026-07 | 2 | 0.7 | 1 | 259.3 |
The auto core is still the story. The battery NAICS is not.
Transportation-equipment manufacturing remains the centre of gravity. On a 12-month average of not-seasonally-adjusted jobs — the right way to read a series that still takes summer shutdowns — Michigan employed about 172,900 transportation-equipment workers in the year to July 2026, down from 193,400 in the year to July 2019. Motor-vehicle manufacturing, a narrower slice, averaged 45,000. Calendar-year averages for transportation equipment peaked near 193,300 in 2018, slumped in 2020, recovered toward 190,300 in 2023, then slipped to 174,300 in 2025. The auto core healed from the pandemic. It did not recapture the late-2010s plateau.
Real output tells a more generous auto story and a colder electrical one. In the Bureau of Economic Analysis state GDP accounts, Michigan’s motor vehicles, bodies, trailers and parts industry produced $48.2 billion of chained-2017-dollar output in 2024, the latest published year, against $28.0 billion in 2010. Kentucky’s auto output rose from $5.5 billion to $11.7 billion over the same span; Ohio’s from $7.4 billion to $13.1 billion. Factories can ship more with fewer people. That is productivity, or mix, or both — not a jobs recovery.
Electrical equipment, appliance and component manufacturing is the NAICS home for batteries, along with motors, appliances and wire. Michigan’s real output there was $1.56 billion in 2024, down 30 percent from $2.23 billion in 2010. Kentucky’s rose 23.5 percent, to $1.78 billion. Ohio remained much larger, at $4.29 billion, up 11.5 percent from 2010. Indiana fell 15.7 percent. The Lansing plant will, if it ramps, eventually show up in that Michigan line. Through 2024 it had not reversed a decade of decline. Nationally, the picture is the opposite of Michigan’s electrical-output slide: U.S. electrical-equipment payrolls rose 8.3 percent from January 2019 to 439,400 in July 2026, while motor-vehicles-and-parts jobs fell 4.7 percent, to 964,500.
Lansing’s factory count is barely above 2019. The auto core is not.

View exact chart values
| year | motor_vehicle_mfg | transport_equipment |
|---|---|---|
| 2010 | 27.22 | 123.89 |
| 2011 | 29.83 | 137.32 |
| 2012 | 32.37 | 149.78 |
| 2013 | 36 | 160.29 |
| 2014 | 37.85 | 169.65 |
| 2015 | 39.4 | 178.09 |
| 2016 | 39.93 | 185.09 |
| 2017 | 40.48 | 189.17 |
| 2018 | 40.22 | 193.25 |
| 2019 | 39.91 | 190.87 |
| 2020 | 36.83 | 164.29 |
| 2021 | 44.2 | 180.47 |
| 2022 | 48.4 | 188.52 |
| 2023 | 48.9 | 190.25 |
| 2024 | 48.28 | 183.92 |
| 2025 | 44.86 | 174.32 |
Michigan’s electrical-equipment output shrank as Kentucky’s grew

View exact chart values
| year | Michigan | Kentucky | Ohio | Indiana |
|---|---|---|---|---|
| 2010 | 2226.5 | 1444.3 | 3845 | 1002.8 |
| 2011 | 2088.7 | 1356.9 | 3745.6 | 952.7 |
| 2012 | 2036.2 | 1433.2 | 3960.1 | 887.7 |
| 2013 | 2247.5 | 1676 | 3919.6 | 915.6 |
| 2014 | 2135.7 | 1396.2 | 3827.7 | 709.4 |
| 2015 | 2544.8 | 1511.7 | 4475.8 | 917.2 |
| 2016 | 2428.4 | 1273.8 | 4258.7 | 878.1 |
| 2017 | 2417.1 | 1550.4 | 4389.4 | 971.9 |
| 2018 | 2139.9 | 1807.1 | 4198.2 | 804.5 |
| 2019 | 2150.1 | 1757.4 | 4230.9 | 889.9 |
| 2020 | 2198.9 | 2026.3 | 3966 | 910.1 |
| 2021 | 2152.5 | 2109.3 | 4542.8 | 1062.6 |
| 2022 | 1866.1 | 1978.3 | 3938.9 | 927.2 |
| 2023 | 1606.4 | 1698.1 | 3847.4 | 824.2 |
| 2024 | 1558.3 | 1784.3 | 4288 | 845 |
What a plant can and cannot do
None of this is an argument against the Lansing factory. A $2 billion plant with dual-use cells — cars in Kentucky, storage on the grid — is exactly the industrial policy Michigan has been trying to buy. LG already runs a plant in Holland and a North American headquarters in Troy. By the end of 2026 the company expects more than 50 gigawatt-hours of North American lithium-iron-phosphate capacity and more than 3,300 Michigan employees. Those are company figures from the August announcement, not BLS counts.
The official statistics answer a different question, and they answer it clearly. Before the first production month could appear in the books, Michigan’s factory payroll was still smaller than in 2019, smaller as a share of the state’s job market than a generation ago, and weaker than South Carolina’s on the same 2019 test. Construction, not manufacturing, supplied the post-2019 job growth. Auto output recovered in real dollars; electrical-equipment output in Michigan did not. Readers who treat a battery groundbreaking as proof of a manufacturing renaissance are reading a press release, not a payroll.
Two caveats belong next to that conclusion. First, July 2026 employment cannot include mid-August hires; a fair test of Lansing comes in 2027, not in this snapshot. Second, electrical-equipment GDP is a broad industry, not a battery census, and 2024 is the last BEA year in the file. Missing years are not zeros. The comparison across Michigan, Kentucky, Ohio and Indiana is still the right one for a plant whose cells will be packed into a Kentucky-built Toyota: the jobs and the output have been migrating even as the announcements stay in the Upper Midwest.
Sources and methods
This is retrospective enrichment using pinned catalogue snapshots, not a reconstruction of what was knowable on the 19 August 2026 edition date. Later releases and revisions may be present.
Research date: 11 September 2026. Historical edition date: 19 August 2026.
Employment: U.S. Bureau of Labor Statistics State and Area Employment (product bls_sae), snapshot bls-sm-snapshot-2026-08-24, monthly observations. Michigan manufacturing and total nonfarm, seasonally adjusted, January 2000–July 2026. Peer-state manufacturing, Michigan durable and nondurable goods, and construction, seasonally adjusted, January 2010–July 2026. Lansing–East Lansing manufacturing, Michigan transportation-equipment manufacturing, and Michigan motor-vehicle manufacturing are not seasonally adjusted; those series are reported as monthly levels where labelled NSA or as 12-month averages and calendar-year averages of months with observations. National electrical-equipment and motor-vehicles-and-parts payrolls are Current Employment Statistics, snapshot bls-ce-snapshot-2026-08-24, seasonally adjusted, January 2019–July 2026.
Output: U.S. Bureau of Economic Analysis annual real GDP by state (SAGDP9, millions of chained 2017 dollars), release bea-regional-state-annual-2026-04-09. Electrical equipment, appliance and component manufacturing (NAICS 335) and motor vehicles, bodies and trailers, and parts (NAICS 3361–3363) for Michigan, Kentucky, Ohio and Indiana, calendar years 2010–2024. The 2025 BEA year is not in this extract; it is not treated as zero.
Index comparisons use January 2019 = 100 on seasonally adjusted manufacturing employment. Percent changes use the same month (July) across years where stated. Duplicate period rows: first observation kept (none appeared in the manufacturing extracts used). Null values were excluded and were not coerced to zero.
LG plant capacity, investment and employment targets are from the 19 August 2026 reporting, not from BLS or BEA. July 2026 payrolls cannot include a mid-August production start. Electrical-equipment GDP includes batteries and much else. No causal effect is inferred from the plant announcement or from cross-state descriptive comparisons.
Research completed 2026-09-11, for the August 19, 2026 news edition. This is retrospective analysis, not a reconstruction of information available that day.