Research
A 100-year oil deal, measured against a $121 billion country
The deal is bigger than the country
President Trump called Friday’s Venezuelan oil pact “THE BIGGEST OIL DEAL IN WORLD HISTORY.” Acting President Delcy Rodríguez said 17 fields with a claimed 65 billion barrels could draw $100 billion of investment and more than $209 billion in taxes for Caracas. A U.S. official said a new company, granted rights for 100 years, would give Washington 55 percent of effective output, with purchases headed for the Strategic Petroleum Reserve and the military. No contract text has been released. Experts warned that Venezuela’s wrecked infrastructure will take years to repair, and that pump prices will not notice in time for Labor Day.
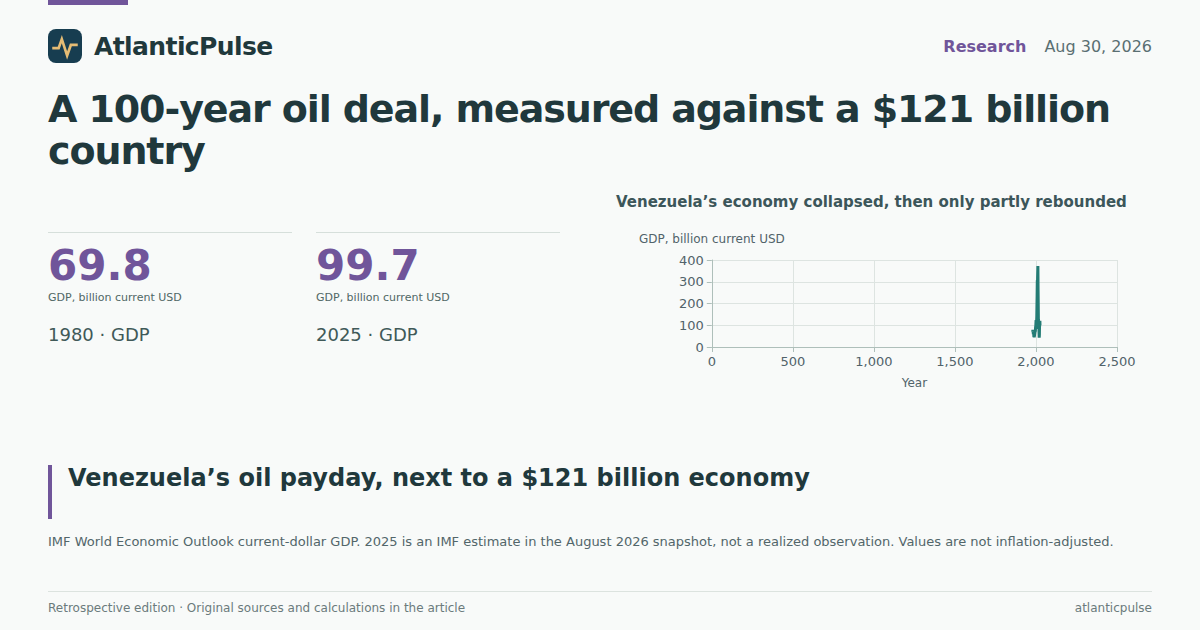
Those tax and investment numbers only make sense next to the size of the country that is supposed to collect them. In the IMF World Economic Outlook snapshot used here, Venezuela’s current-dollar GDP was about $121 billion in 2024. That is down 68 percent from a 2012 peak of about $373 billion. Real output compounded to a 69 percent decline from 2014 through 2024. Average consumer-price inflation, which the IMF recorded at more than 65,000 percent in 2018, was still about 49 percent in 2024. GDP per person was about $4,500, against about $86,000 in the United States.
The 2025 IMF estimate in the same file is even lower, about $100 billion, and should be read as an estimate, not a closing print. Either way, the partner in this “historic” deal is a fraction of the economy it was a dozen years ago.
Venezuela’s economy collapsed, then only partly rebounded

View exact chart values
| year | gdp_billion_usd | status |
|---|---|---|
| 1980 | 69.8 | historical |
| 1981 | 78.4 | historical |
| 1982 | 80 | historical |
| 1983 | 79.7 | historical |
| 1984 | 57.8 | historical |
| 1985 | 59.9 | historical |
| 1986 | 60.9 | historical |
| 1987 | 46.9 | historical |
| 1988 | 60.4 | historical |
| 1989 | 44.7 | historical |
| 1990 | 48.4 | historical |
| 1991 | 53.4 | historical |
| 1992 | 60.4 | historical |
| 1993 | 59.9 | historical |
| 1994 | 58.4 | historical |
| 1995 | 77.4 | historical |
| 1996 | 70.5 | historical |
| 1997 | 85.7 | historical |
| 1998 | 91.8 | historical |
| 1999 | 97.5 | historical |
| 2000 | 117.6 | historical |
| 2001 | 123.1 | historical |
| 2002 | 95.3 | historical |
| 2003 | 83.7 | historical |
| 2004 | 112.3 | historical |
| 2005 | 143.4 | historical |
| 2006 | 178.5 | historical |
| 2007 | 232.9 | historical |
| 2008 | 306.8 | historical |
| 2009 | 268.6 | historical |
| 2010 | 318.3 | historical |
| 2011 | 316.5 | historical |
| 2012 | 372.6 | historical |
| 2013 | 258.9 | historical |
| 2014 | 214.7 | historical |
| 2015 | 125.4 | historical |
| 2016 | 112.9 | historical |
| 2017 | 115.9 | historical |
| 2018 | 102 | historical |
| 2019 | 73 | historical |
| 2020 | 42.8 | historical |
| 2021 | 56.6 | historical |
| 2022 | 89 | historical |
| 2023 | 102.4 | historical |
| 2024 | 120.6 | historical |
| 2025 | 99.7 | estimate |
Oil neighbors, a different weight class
Scale is easier to see among other oil states than against the United States, which at about $29.3 trillion in 2024 was roughly 243 times Venezuela’s GDP. Mexico’s 2024 GDP was about $1.83 trillion. Saudi Arabia’s was about $1.25 trillion. Venezuela, sitting on what Washington describes as a prize reserve, printed an economy closer to a mid-size American metro than to a petrostate that can write $209 billion checks.
That does not prove the reserves are fictional, and it does not prove the deal will fail. It does show why a tax total larger than a year’s national output is either a multi-decade present value, an optimistic multiple of today’s government take, or both. IMF government revenue was about 14 percent of Venezuelan GDP in 2024, implying on the order of $17 billion of public revenue that year. The $209 billion tax claim is about 13 times that annual take. If the money is stretched over the 100-year rights the Associated Press reported, it is a slow drip. If it is meant to arrive on a political timetable, it is a fantasy of compounding that the last decade’s real growth does not support.
Even among oil neighbors, Venezuela is now a small economy

View exact chart values
| economy | gdp_billion_usd |
|---|---|
| Mexico | 1830.5 |
| Saudi Arabia | 1254.1 |
| Venezuela | 120.6 |
The promised tax haul is larger than Venezuela’s entire economy

View exact chart values
| item | billion_usd |
|---|---|
| Claimed Caracas taxes | 209 |
| Claimed oil investment | 100 |
| Venezuela GDP, 2024 | 120.6 |
| US oil-and-gas GDP, 2024 | 252.6 |
| US refining GDP, 2024 | 195.7 |
| US gasoline-energy PCE, 2024 | 440.5 |
America already has an oil industry
The White House pitch treats Venezuelan barrels as the missing piece of U.S. energy security. BEA industry accounts already show a large domestic extraction business. U.S. oil-and-gas extraction GDP was about $253 billion in 2024, 0.86 percent of U.S. GDP. Petroleum and coal products manufacturing — the refining-heavy slice — added another $196 billion. Those are value-added totals, not barrels, and they bounce with prices: nominal extraction GDP spiked to $329 billion in 2022 and slumped to $104 billion in 2020. In chained 2017 dollars, though, real extraction output in 2024 was more than double its 1997 level.
The geography is lopsided. In 2024, Texas oil-and-gas extraction GDP was about $163 billion — by itself larger than Venezuela’s entire recorded economy. Oklahoma, New Mexico and Colorado followed. Eight producing states in this extract summed to about 90 percent of the U.S. industry total; Texas alone was about 65 percent. A 100-year claim on Venezuelan fields is a geopolitical story. It is not, on these books, a substitute for the Permian.
None of this measures proved reserves, the Strategic Petroleum Reserve, or how many incremental barrels Caracas can actually lift. Those series are not in the pinned catalogue. What the books do show is that the United States is not waiting on Venezuela for an oil sector to exist.
America already has a large oil-and-gas extraction industry

View exact chart values
| year | oilgas_gdp_billion | real_oilgas_gdp_billion_2017 | share_of_us_gdp_pct | refining_gdp_billion |
|---|---|---|---|---|
| 1997 | 55.1 | 102.6 | 0.64 | 47.5 |
| 1998 | 39.1 | 105 | 0.43 | 50.1 |
| 1999 | 44.1 | 94.7 | 0.46 | 45.2 |
| 2000 | 68.2 | 68.1 | 0.67 | 52.7 |
| 2001 | 76.1 | 80 | 0.72 | 68.3 |
| 2002 | 69.9 | 92.4 | 0.64 | 50.7 |
| 2003 | 92.9 | 73.6 | 0.81 | 81.2 |
| 2004 | 112.9 | 72.4 | 0.92 | 104.2 |
| 2005 | 155.8 | 70.9 | 1.19 | 141 |
| 2006 | 178.7 | 80.5 | 1.29 | 140 |
| 2007 | 206 | 87.2 | 1.42 | 154.7 |
| 2008 | 271.8 | 82.5 | 1.84 | 154.8 |
| 2009 | 172.6 | 112 | 1.19 | 110.6 |
| 2010 | 189.1 | 88.7 | 1.26 | 123.8 |
| 2011 | 219 | 88.9 | 1.4 | 159.1 |
| 2012 | 224.9 | 109.6 | 1.38 | 159.1 |
| 2013 | 251.8 | 113.8 | 1.49 | 146.6 |
| 2014 | 268.8 | 126.2 | 1.53 | 147.8 |
| 2015 | 151.6 | 171.6 | 0.83 | 131.4 |
| 2016 | 131.1 | 178.5 | 0.7 | 76 |
| 2017 | 161.1 | 161.1 | 0.82 | 110.7 |
| 2018 | 189.2 | 151.4 | 0.92 | 154.2 |
| 2019 | 172.8 | 191.7 | 0.8 | 143.4 |
| 2020 | 104 | 211.7 | 0.49 | 61.5 |
| 2021 | 225 | 165.6 | 0.95 | 147.8 |
| 2022 | 329.1 | 139.3 | 1.26 | 231 |
| 2023 | 259.9 | 224.6 | 0.93 | 218 |
| 2024 | 252.6 | 238.1 | 0.86 | 195.7 |
Texas alone accounts for most U.S. oil-and-gas extraction GDP

View exact chart values
| state | year | gdp_billions |
|---|---|---|
| Texas | 2024 | 163.27 |
| Oklahoma | 2024 | 17.52 |
| New Mexico | 2024 | 13.31 |
| Colorado | 2024 | 11.79 |
| Louisiana | 2024 | 6.75 |
| North Dakota | 2024 | 6.68 |
| Alaska | 2024 | 5.78 |
| Wyoming | 2024 | 2.85 |
The payroll is small. The gasoline bill is not.
Oil wealth and oil jobs are not the same thing. Bureau of Labor Statistics payrolls put seasonally adjusted oil-and-gas extraction employment at 117,200 in July 2025, plus 211,600 in support activities for oil and gas operations — about 329,000 jobs combined, or 0.21 percent of nonfarm employment. Combined July employment peaked near 526,000 in 2014. Extraction employment in July 2026 was 114,600; the support series in this snapshot ends a month earlier. The shale boom hired. The price busts fired. A Venezuelan joint venture that takes years to rebuild wells will not restock that payroll this quarter.
Households, meanwhile, are already paying an oil bill the deal claims it will shrink. BEA consumer accounts put U.S. spending on gasoline and other energy goods at $441 billion in 2024, about $1,295 per person, or 2.2 percent of personal consumption. That is down from a $515 billion, $1,541-per-person spike in 2022, and still a quarter above 2019. AAA, in the day’s reporting, had the national retail average near $4.08 a gallon. Industry GDP of $253 billion and a household fuel bill of $441 billion are different concepts — one is value added at the well, the other is what drivers and furnace owners spend — but they rhyme: the money is already moving through an American system, not a Venezuelan one that has yet to be rebuilt.
What the books will not do
A descriptive comparison is not a verdict on sovereignty, on Maduro’s capture, or on whether Chevron or anyone else will write the checks. Rodríguez says Venezuela keeps ownership. Critics in Caracas call the pact a way to cling to power. Harvard’s Ricardo Hausmann called it illegitimate. Those are political claims. The statistical ones are narrower.
Venezuela’s recorded economy is about a third of its 2012 peak and about 1/243 the size of America’s. The tax haul advertised for Caracas exceeds a year of Venezuelan GDP and many years of implied government revenue. The United States already books a quarter-trillion dollars of oil-and-gas extraction value added, concentrated in Texas, and households already spend more than that on fuel. If the deal is a long-horizon option on heavy crude, the books do not contradict it. If it is a plan to refill the reserve and cheapen gasoline before an election, they offer no support. The wells that would have to rise are in a country that, on the IMF’s ledger, has already shrunk.
Sources and methods
This is retrospective enrichment using pinned catalogue snapshots available to the research tools, not a reconstruction of what was knowable on the edition date of 2026-08-30. Later releases and revisions may be present.
Research was assembled on 2026-09-11 against those snapshots. IMF World Economic Outlook facts are from snapshot 2026-08-24 (lineage 23729089). BEA annual state GDP is from snapshot 2026-08-31 (release bea-regional-state-annual-2026-04-09), which post-dates the edition date. BEA state PCE is from snapshot 2026-08-31 (release bea-sapce-2025-09-26). BLS CES is from snapshot 2026-08-24 (bls-ce-snapshot-2026-08-24).
IMF current-dollar GDP, GDP per capita, real GDP percent change, average consumer-price inflation, government revenue as a share of GDP, and the current-account balance were used for Venezuela and, where compared, the United States, Mexico and Saudi Arabia. Years through 2024 are treated as historical in the narrative. 2025 IMF values are labeled estimates. IMF files in this extract run on January 1 dates and mix realized, estimated and projected years; frequency is annual despite a monthly filename.
BEA oil-and-gas extraction and petroleum-and-coal products manufacturing GDP are industry value added in millions of current dollars, or chained 2017 dollars for the real extraction series, for the United States and selected states. They are not barrel counts, reserve estimates, or SPR inventories, which are not in the pinned catalogue. State bars cover eight producing states only, not a 50-state census. The latest complete BEA industry year in these extracts is 2024.
BLS CES employment is seasonally adjusted national payrolls in thousands. Extraction and support series were added only in months where both exist; support activities end in June 2026 in this snapshot, so combined July 2026 employment is not shown. July snapshots were used for the long employment history.
BEA gasoline and other energy goods PCE includes motor-vehicle fuels, lubricants and fluids plus fuel oils and other fuels. It is a spending aggregate, not a retail price. Per-capita figures are BEA’s published dollars, not a household average computed here. Shares of total PCE are current-dollar ratios.
Announced deal figures — $209 billion in taxes, $100 billion of investment, 65 billion barrels, 100-year rights, 55 percent effective U.S. output — come from contemporaneous reporting of official statements, not from IMF or BEA series. Comparing those claims with annual GDP or government revenue is a scale check, not proof of the contract’s duration or present value. Missing observations were skipped, not filled with zeros. No causal effect of the deal on prices, output or employment is inferred.
Research completed 2026-09-11, for the August 30, 2026 news edition. This is retrospective analysis, not a reconstruction of information available that day.