Research
A $100 billion oil promise, in an economy that is already smaller than Texas
The superlative, and the country underneath it
President Trump billed Friday’s Venezuelan oil pact as “THE BIGGEST OIL DEAL IN WORLD HISTORY.” The Associated Press, working from U.S. and Venezuelan statements, reported a new private company over 17 fields holding a claimed 65 billion barrels, 100-year development rights, a 55 percent U.S. claim on output, and a Caracas promise of $100 billion in investment plus more than $209 billion in taxes. The same reporting was careful about the next sentence: repairing Venezuela’s pipes will take years, ExxonMobil’s Darren Woods once called the country “un-investable,” and U.S. petrol was already $4.09 a gallon with the Strait of Hormuz still a parking lot.
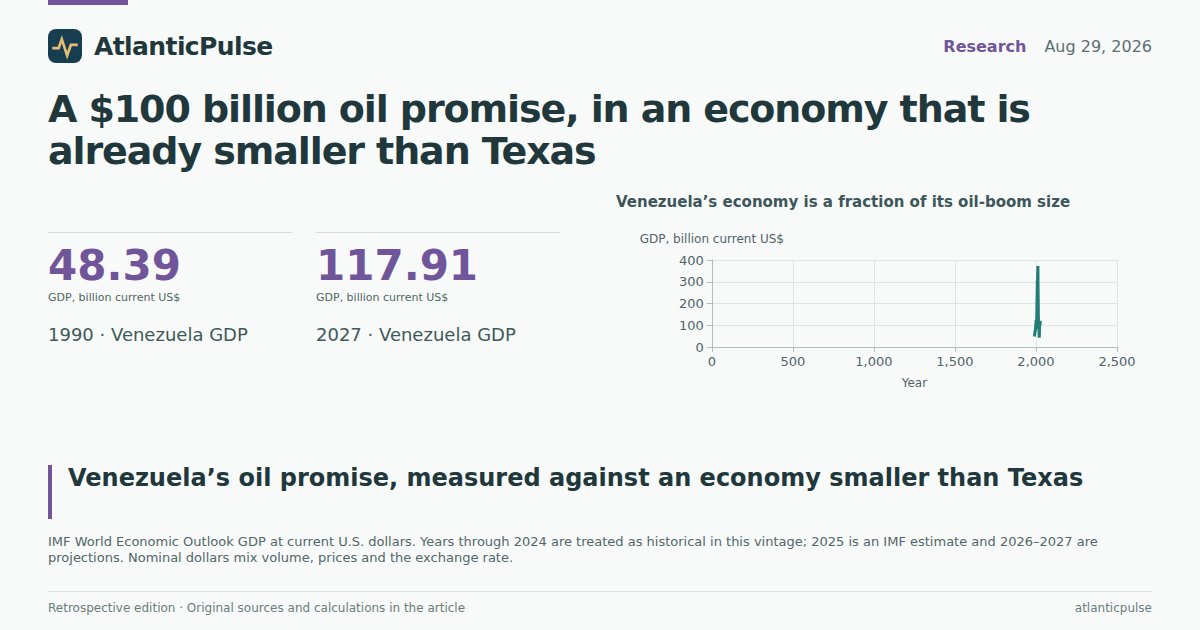
Those barrel counts are not in the official statistical catalogue used here. What the books do show is the economy that would have to absorb the money. In the IMF World Economic Outlook, Venezuela’s GDP at current U.S. dollars was about $121 billion in 2024. That is 0.4 percent of the United States, a tenth of Saudi Arabia, and less than a third of neighbouring Colombia. It is also two-thirds smaller than Venezuela’s own 2012 peak of about $373 billion in the same series.
The $100 billion investment figure, if it ever arrived as advertised, would equal about 83 percent of that 2024 GDP. The $209 billion tax figure, which Caracas did not time to a single year, is about 1.7 times the entire 2024 economy. Superlatives travel well on social media. Arithmetic is less impressed.
Venezuela’s economy is a fraction of its oil-boom size

View exact chart values
| year | gdp_billion_usd | weo_status |
|---|---|---|
| 1990 | 48.39 | historical_weo |
| 1991 | 53.38 | historical_weo |
| 1992 | 60.4 | historical_weo |
| 1993 | 59.87 | historical_weo |
| 1994 | 58.36 | historical_weo |
| 1995 | 77.43 | historical_weo |
| 1996 | 70.54 | historical_weo |
| 1997 | 85.68 | historical_weo |
| 1998 | 91.84 | historical_weo |
| 1999 | 97.52 | historical_weo |
| 2000 | 117.6 | historical_weo |
| 2001 | 123.12 | historical_weo |
| 2002 | 95.26 | historical_weo |
| 2003 | 83.68 | historical_weo |
| 2004 | 112.25 | historical_weo |
| 2005 | 143.38 | historical_weo |
| 2006 | 178.52 | historical_weo |
| 2007 | 232.86 | historical_weo |
| 2008 | 306.76 | historical_weo |
| 2009 | 268.62 | historical_weo |
| 2010 | 318.28 | historical_weo |
| 2011 | 316.48 | historical_weo |
| 2012 | 372.59 | historical_weo |
| 2013 | 258.93 | historical_weo |
| 2014 | 214.69 | historical_weo |
| 2015 | 125.45 | historical_weo |
| 2016 | 112.91 | historical_weo |
| 2017 | 115.88 | historical_weo |
| 2018 | 102.02 | historical_weo |
| 2019 | 73.01 | historical_weo |
| 2020 | 42.84 | historical_weo |
| 2021 | 56.62 | historical_weo |
| 2022 | 89.01 | historical_weo |
| 2023 | 102.38 | historical_weo |
| 2024 | 120.57 | historical_weo |
| 2025 | 99.66 | imf_estimate |
| 2026 | 111.3 | imf_projection |
| 2027 | 117.91 | imf_projection |
$100 billion is almost a year’s Venezuelan GDP

View exact chart values
| metric | billion_usd |
|---|---|
| Promised investment into Venezuelan oil | 100 |
| Venezuela GDP, 2024 (IMF WEO) | 120.6 |
| Venezuela GDP peak in this series | 372.6 |
| U.S. oil and gas extraction GDP, 2024 | 252.6 |
| Promised Venezuelan tax take (unspecified years) | 209 |
Seven years of contraction, then a partial bounce
The collapse was not a one-year oil-price scare. Real GDP, again from the IMF WEO, fell in every year from 2014 through 2020. Compounded, that is about a 74 percent shrinkage in the level of real output over those seven years. Nominal GDP in current dollars bottomed at about $43 billion in 2020 — 88 percent below the 2012 peak — then crawled back as oil prices recovered and the currency arithmetic changed.
Income per person tells the same story in a more intimate unit. IMF current-dollar GDP per capita peaked at about $12,700 in 2012 and was about $4,500 in 2024, against about $86,200 in the United States. Average consumer-price inflation was still 49 percent in 2024. The IMF’s 2025 estimate is 252 percent. The 2018 reading in this vintage is 65,374 percent, which is less a statistic than a crime scene.
The Fund stopped publishing a total-investment share of GDP after 2017, when the series sat at 5.1 percent. That silence is itself a finding: this is not an economy whose capital stock the IMF still pretends to measure in the usual way. A 100-year oil concession is a long time to wait for a country that recently lost three-quarters of its real output in seven years.
The industry America already has
While Caracas was offering barrels in the ground, the United States was already running a large oil-and-gas extraction industry above ground. Bureau of Economic Analysis state GDP accounts put U.S. oil and gas extraction at $253 billion in 2024 current dollars — about 0.9 percent of national GDP, and about 2.1 times Venezuela’s entire 2024 economy. Petroleum and coal products manufacturing, the refining step that actually makes petrol, added another $196 billion. Extraction GDP had been even larger in 2022, at $329 billion, when prices were higher.
That industry is not evenly spread. Texas oil-and-gas extraction GDP was $163 billion in 2024, 65 percent of the U.S. extraction total in these accounts and, on its own, larger than Venezuela. Oklahoma, New Mexico, Louisiana, North Dakota and Alaska fill out the next tier. If the political test of the Venezuelan deal is whether it “doubles American oil reserves,” the economic test is whether it can move an industry that already dwarfs the country it is buying into.
None of this measures barrels. BEA industry GDP is value added, not production. It rises and falls with prices as well as volumes. It also excludes the oilfield-services payroll that does much of the actual drilling. The comparison is still the right one for a $100 billion promise: America’s existing extraction industry, in a single year, produces more dollar output than Venezuela’s whole economy.
America’s oil-and-gas extraction industry is already larger than Venezuela

View exact chart values
| year | oil_gas_extraction_gdp_billion | petroleum_coal_mfg_gdp_billion | us_all_industry_gdp_billion | extraction_share_of_us_gdp_pct |
|---|---|---|---|---|
| 1997 | 55.06 | 47.51 | 8577.6 | 0.64 |
| 1998 | 39.06 | 50.12 | 9062.8 | 0.43 |
| 1999 | 44.09 | 45.24 | 9631.2 | 0.46 |
| 2000 | 68.21 | 52.68 | 10251 | 0.67 |
| 2001 | 76.1 | 68.31 | 10581.9 | 0.72 |
| 2002 | 69.86 | 50.71 | 10929.1 | 0.64 |
| 2003 | 92.85 | 81.25 | 11456.5 | 0.81 |
| 2004 | 112.91 | 104.19 | 12217.2 | 0.92 |
| 2005 | 155.79 | 141.04 | 13039.2 | 1.19 |
| 2006 | 178.74 | 139.97 | 13815.6 | 1.29 |
| 2007 | 205.97 | 154.72 | 14474.2 | 1.42 |
| 2008 | 271.76 | 154.84 | 14769.9 | 1.84 |
| 2009 | 172.57 | 110.63 | 14478.1 | 1.19 |
| 2010 | 189.12 | 123.81 | 15049 | 1.26 |
| 2011 | 219.02 | 159.06 | 15599.7 | 1.4 |
| 2012 | 224.92 | 159.14 | 16254 | 1.38 |
| 2013 | 251.79 | 146.61 | 16880.7 | 1.49 |
| 2014 | 268.85 | 147.8 | 17608.1 | 1.53 |
| 2015 | 151.65 | 131.41 | 18295 | 0.83 |
| 2016 | 131.06 | 76.03 | 18804.9 | 0.7 |
| 2017 | 161.11 | 110.66 | 19612.1 | 0.82 |
| 2018 | 189.19 | 154.24 | 20656.5 | 0.92 |
| 2019 | 172.79 | 143.35 | 21540 | 0.8 |
| 2020 | 103.99 | 61.48 | 21375.3 | 0.49 |
| 2021 | 225.01 | 147.79 | 23725.6 | 0.95 |
| 2022 | 329.1 | 231.03 | 26054.6 | 1.26 |
| 2023 | 259.92 | 218.02 | 27811.5 | 0.93 |
| 2024 | 252.61 | 195.71 | 29298 | 0.86 |
Texas oil GDP alone outstrips Venezuela

View exact chart values
| state | oil_gas_extraction_gdp_billion |
|---|---|
| Alaska | 5.78 |
| North Dakota | 6.68 |
| Louisiana | 6.75 |
| New Mexico | 13.31 |
| Oklahoma | 17.52 |
| Texas | 163.27 |
The payroll is smaller than the talking points
Jobs are a colder check than GDP, because they do not inflate with the price of crude. Combining three distinct, seasonally adjusted Current Employment Statistics series — oil and gas extraction, drilling oil and gas wells, and support activities for oil and gas operations — the U.S. oilfield complex employed about 368,000 people in June 2026, a preliminary reading. That is 41 percent below the September 2014 peak of about 623,000, and about 0.3 percent of private payrolls.
Extraction itself, the NAICS category that matches the GDP accounts, was 115,100 in June 2026 and 114,600 in the July preliminary. Support work, not extraction, is where most of the heads are. Average hourly earnings in extraction were $52.85 in June, up from $28.84 when the all-employee earnings series begins in 2006. The people who still have these jobs are well paid. There are just a lot fewer of them than during the last boom, and the Venezuelan announcement does not, by itself, hire anyone in Midland or Williston next month.
That is the unglamorous implication of Friday’s news. A 65-billion-barrel claim is a geological inventory. A $100 billion investment claim is a press release. The official books show an oil exporter whose economy is smaller than Texas extraction, an American oilfield payroll that never recaptured 2014, and a gasoline price that will not wait for Venezuelan infrastructure to be rebuilt. If the deal is real, it is a very long game. If it is not, the superlative was doing all the work.
The U.S. oilfield payroll never fully came back from 2014

View exact chart values
| period | combined_thousands |
|---|---|
| 2000-03 | 279.3 |
| 2000-06 | 287.1 |
| 2000-09 | 292.2 |
| 2000-12 | 296.4 |
| 2001-03 | 305.6 |
| 2001-06 | 308.5 |
| 2001-09 | 307.2 |
| 2001-12 | 299.2 |
| 2002-03 | 293.4 |
| 2002-06 | 291.7 |
| 2002-09 | 289.7 |
| 2002-12 | 292.1 |
| 2003-03 | 290.2 |
| 2003-06 | 291.7 |
| 2003-09 | 292 |
| 2003-12 | 294.9 |
| 2004-03 | 303.1 |
| 2004-06 | 308.4 |
| 2004-09 | 314.2 |
| 2004-12 | 318.5 |
| 2005-03 | 329.1 |
| 2005-06 | 336.5 |
| 2005-09 | 345.9 |
| 2005-12 | 358.7 |
| 2006-03 | 370.5 |
| 2006-06 | 386.7 |
| 2006-09 | 396.8 |
| 2006-12 | 407 |
| 2007-03 | 417.7 |
| 2007-06 | 424.1 |
| 2007-09 | 430.2 |
| 2007-12 | 443.7 |
| 2008-03 | 459 |
| 2008-06 | 469 |
| 2008-09 | 483.8 |
| 2008-12 | 475.7 |
| 2009-03 | 447.3 |
| 2009-06 | 416 |
| 2009-09 | 401.8 |
| 2009-12 | 402.6 |
| 2010-03 | 417.1 |
| 2010-06 | 434.5 |
| 2010-09 | 449 |
| 2010-12 | 461.7 |
| 2011-03 | 476.5 |
| 2011-06 | 503.9 |
| 2011-09 | 522.6 |
| 2011-12 | 539.6 |
| 2012-03 | 558.1 |
| 2012-06 | 564.5 |
| 2012-09 | 560.2 |
| 2012-12 | 563.9 |
| 2013-03 | 576.5 |
| 2013-06 | 583.7 |
| 2013-09 | 589.1 |
| 2013-12 | 587.2 |
| 2014-03 | 601.6 |
| 2014-06 | 613.2 |
| 2014-09 | 622.8 |
| 2014-12 | 616.6 |
| 2015-03 | 586 |
| 2015-06 | 548.3 |
| 2015-09 | 517.2 |
| 2015-12 | 490.6 |
| 2016-03 | 442.5 |
| 2016-06 | 414.7 |
| 2016-09 | 403.2 |
| 2016-12 | 402.3 |
| 2017-03 | 413.3 |
| 2017-06 | 428.6 |
| 2017-09 | 433 |
| 2017-12 | 440.2 |
| 2018-03 | 460.1 |
| 2018-06 | 474 |
| 2018-09 | 480.2 |
| 2018-12 | 482.1 |
| 2019-03 | 483.1 |
| 2019-06 | 478.9 |
| 2019-09 | 464.5 |
| 2019-12 | 442.8 |
| 2020-03 | 429.1 |
| 2020-06 | 349.8 |
| 2020-09 | 330.3 |
| 2020-12 | 326.4 |
| 2021-03 | 320.8 |
| 2021-06 | 327.9 |
| 2021-09 | 333 |
| 2021-12 | 341.8 |
| 2022-03 | 350 |
| 2022-06 | 367.7 |
| 2022-09 | 373.8 |
| 2022-12 | 383.2 |
| 2023-03 | 387.8 |
| 2023-06 | 394 |
| 2023-09 | 394 |
| 2023-12 | 390.5 |
| 2024-03 | 386.7 |
| 2024-06 | 377.8 |
| 2024-09 | 380.5 |
| 2024-12 | 379.5 |
| 2025-03 | 375.7 |
| 2025-06 | 374.4 |
| 2025-09 | 367.2 |
| 2025-12 | 365.6 |
| 2026-03 | 365.6 |
| 2026-06 | 368.1 |
Sources and methods
This is retrospective enrichment using pinned catalogue snapshots, not a reconstruction of what was knowable on the 29 August 2026 edition date. Later releases and revisions may be present in the extracts.
Research retrieved 11 September 2026. Edition date 29 August 2026. IMF WEO snapshot created 24 August 2026 (raw run 10 August 2026). BEA annual state GDP snapshot created 31 August 2026 from the 9 April 2026 regional release. CES snapshot created 24 August 2026, observations through July 2026.
IMF WEO years through 2024 are treated as historical in this vintage; 2025 as an IMF estimate; 2026–2027 as projections. Venezuela’s GDP, growth, inflation and current-account series end in 2027; the U.S. GDP series continues to 2030. The total-investment series for Venezuela ends in 2017. Nominal GDP mixes volumes, prices and exchange rates and is not a welfare measure.
BEA oil and gas extraction GDP is NAICS 211 value added in current dollars, not barrels produced. 2025 extraction GDP is missing in this snapshot (null/missing flag, not zero). State figures do not sum to the U.S. total. Petroleum and coal products manufacturing (NAICS 324) is refining and related, not extraction.
CES combined oilfield jobs sum three distinct seasonally adjusted series (extraction, drilling, support). They are not double-counted. June and July 2026 carry preliminary footnotes; drilling and support were not yet published for July, so the latest combined reading is June 2026. Missing is not zero.
The $100 billion investment, $209 billion tax, 65 billion barrel and 55 percent output figures are news claims from 29 August 2026 reporting, not catalogue observations. This article does not estimate gasoline-price effects, recoverable reserves, or causal impacts of the announced deal.
Research completed 2026-09-11, for the August 29, 2026 news edition. This is retrospective analysis, not a reconstruction of information available that day.