Research
A $1.9 billion reactor, in a power sector that already shrank
The loan is huge next to Iowa’s utilities books
Iowa’s pitch this week is a familiar one in the data-center age: restart an old reactor, keep the lights cheap for everyone else, and let a tech company take most of the new megawatts. The Energy Department closed a $1.9 billion loan to NextEra Energy to bring back the 615-megawatt Duane Arnold Energy Center near Cedar Rapids, shuttered in 2020 after a derecho wrecked its cooling towers. Google has a 25-year contract, signed in October 2025, to buy 70 percent of the plant’s output. NextEra still needs Nuclear Regulatory Commission licensing through at least January 2028 and hopes to be online in early 2029. Construction, the company says, could mean almost 1,500 jobs, then more than 450 full-time workers. Sierra Club Iowa called it a public-money gamble “just to satisfy the electricity cravings of massive tech monopolies.”
The official books make the scale of that loan less abstract. Bureau of Economic Analysis annual state GDP puts Iowa’s entire economy at $277.1 billion in 2025. The utilities sector — electric power, natural gas, water and sewage, not nuclear generation by itself — was $4.0 billion, or 1.4 percent of the state. Construction was larger, at $12.2 billion. Data processing, hosting and related information services, the industry Google actually lives in, was $1.8 billion in 2024; the 2025 observation is missing, so it should not be treated as zero. A $1.9 billion federal loan is equal to about 48 percent of one year of Iowa utilities GDP. That is not a rounding error on the power-company ledger. It is also not a new Google-sized industry appearing in the state’s output tables. Iowa still sells a lot more corn-adjacent manufacturing and hospital care than server time.
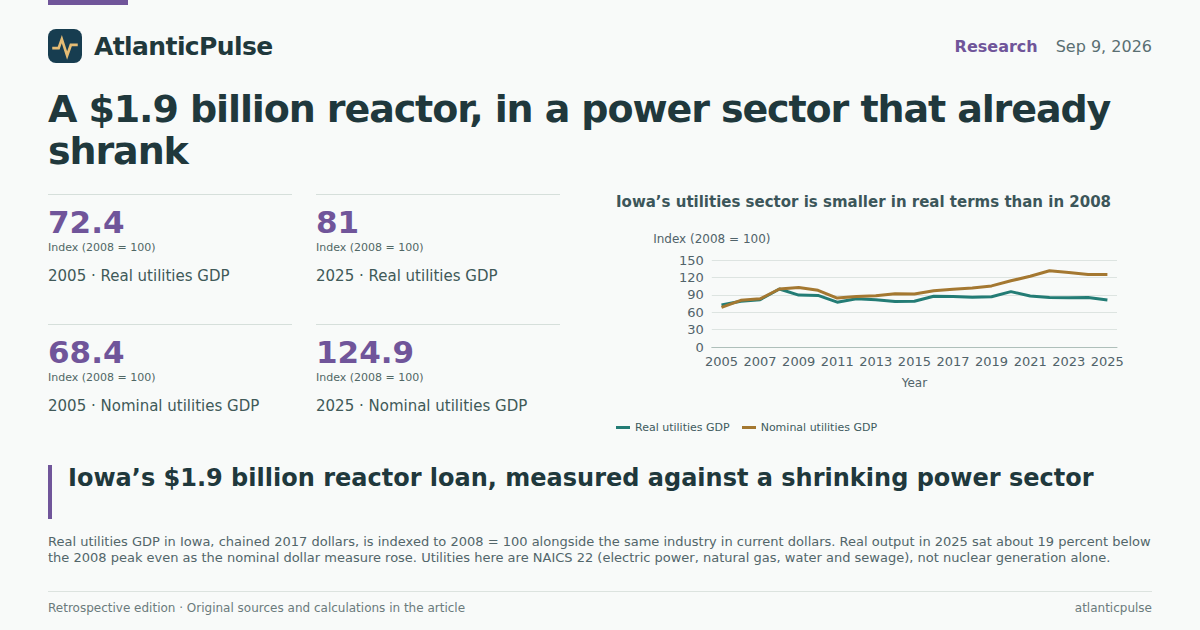
Iowa’s utilities sector is smaller in real terms than in 2008

View exact chart values
| year | real_index_2008 | nominal_index_2008 |
|---|---|---|
| 2005 | 72.4 | 68.4 |
| 2006 | 79 | 80.5 |
| 2007 | 81.6 | 83.1 |
| 2008 | 100 | 100 |
| 2009 | 89.5 | 102.7 |
| 2010 | 89 | 97.7 |
| 2011 | 77.2 | 84.3 |
| 2012 | 83.1 | 87.1 |
| 2013 | 81.5 | 88.2 |
| 2014 | 78.5 | 91.7 |
| 2015 | 78.8 | 91.2 |
| 2016 | 87.5 | 96.9 |
| 2017 | 87.1 | 99.6 |
| 2018 | 85.8 | 101.6 |
| 2019 | 86.8 | 105.3 |
| 2020 | 95.6 | 114.1 |
| 2021 | 87.9 | 122.1 |
| 2022 | 85.2 | 131.3 |
| 2023 | 84.9 | 128.5 |
| 2024 | 85.1 | 125.1 |
| 2025 | 81 | 124.9 |
Real output in utilities went the other way
Nominal dollars flatter the story. In current dollars, Iowa utilities GDP rose about 25 percent from 2008 to 2025. Strip out price changes and the picture reverses. Real utilities GDP, in chained 2017 dollars, peaked at $3.6 billion in 2008 — while Duane Arnold was still running — and was $2.9 billion in 2025, about 19 percent below that peak. Indexed to 2008, real output sits at 81; the nominal series sits at 125. Iowa did not grow a fatter power sector after the plant went dark. It grew a more expensive one.
That is not a finding about whether the restart will work. It is a finding about the industry the restart is being dropped into. A 615-megawatt plant is a lot of steel in a state whose measured utilities output has been drifting down in real terms for a decade and a half. If the plant returns as planned in 2029, the GDP tables will eventually show it. They do not show it yet. And they do not show a data-processing boom large enough to dwarf the rest of Iowa: even in 2024, hosting and related services were well under 1 percent of statewide GDP.
Four hundred fifty jobs, in a 5,600-person trade
The jobs math is even more lopsided, depending on which denominator you pick. State payrolls counted about 5,600 Iowa utilities jobs in July 2026, not seasonally adjusted. NextEra’s promised 450 permanent jobs would be about 8 percent of that small workforce — a real hire, if it happens, in a trade that has been shrinking. The same July snapshot was 6,600 in 2015. Iowa did not replace Duane Arnold’s payroll with other utility work. It let the headcount drift down.
Zoom out and 450 jobs look like a rounding error. Iowa construction employment, seasonally adjusted, was about 87,100 in July 2026; 1,500 construction-period jobs would be under 2 percent of that. Statewide nonfarm employment was 1.58 million. Four hundred fifty jobs are 0.03 percent of the Iowa payroll. The plant is a big deal for the people who would work there, and a small deal for the state’s labor market. Both things can be true. The political temptation is to quote only the construction-period number and skip the utilities headcount that has already gone missing.
450 plant jobs would be a rounding error on Iowa’s payroll — except inside utilities

View exact chart values
| item | jobs | note |
|---|---|---|
| Iowa utilities jobs, latest NSA month | 5600 | 2026-07 |
| Promised permanent plant jobs | 450 | reporting |
| Iowa construction jobs, latest SA month | 87100 | 2026-07 |
| Promised construction-period jobs | 1500 | reporting |
Iowa’s utilities payroll shrank while Michigan’s and Pennsylvania’s held up

View exact chart values
| year | iowa_thousands | michigan_thousands | pennsylvania_thousands |
|---|---|---|---|
| 2015 | 6.6 | 20.3 | 24.3 |
| 2016 | 6.5 | 20.5 | 24.1 |
| 2017 | 6.5 | 20.7 | 23.9 |
| 2018 | 6.5 | 20.7 | 23.7 |
| 2019 | 6.3 | 21.1 | 23.4 |
| 2020 | 6.2 | 20.6 | 22.6 |
| 2021 | 6 | 21.1 | 22.3 |
| 2022 | 5.7 | 22 | 22.2 |
| 2023 | 5.9 | 20.7 | 22.8 |
| 2024 | 5.9 | 19.9 | 22.8 |
| 2025 | 5.6 | 20.1 | 23.1 |
| 2026 | 5.6 | 20.9 | 23 |
The household bill is not screaming
The public argument for dedicated generation is that data centers will otherwise show up on everyone else’s power bill. Iowa households do pay more for electricity than they did, but they are not the country’s hardship case. State personal consumption expenditures on electricity were $2.3 billion in 2024. Divided by Iowa’s 3.23 million residents, that is $716 per person — up from $448 in 2005, a 60 percent increase in current dollars, with a sharp step in 2022. The U.S. figure in 2024 was $745. Iowa sat about 4 percent below the national average. Electricity was 1.4 percent of all Iowa household spending.
Among states now fighting over data-center load, Massachusetts and Texas spent more per person on household electricity in 2024 than Iowa, Michigan or Pennsylvania. Virginia, the country’s data-center capital, was close to Iowa. These are household bills, not industrial load, and they are not a household average — they are statewide spending divided by population. They still puncture the idea that Iowa families already live with outlier power costs that a Google contract would automatically rescue. If rates jump later, that will be a new fact. It is not the 2024 fact.
Iowa households do not have the country’s heavy electricity bills

View exact chart values
| state | dollars_per_person | group |
|---|---|---|
| Massachusetts | 828 | Data-center fight |
| Texas | 810 | Data-center fight |
| Pennsylvania | 774 | Restart state |
| Wisconsin | 746 | Neighbor |
| United States | 745 | National |
| Virginia | 720 | Data-center fight |
| Iowa | 716 | Restart state |
| Nebraska | 716 | Neighbor |
| Michigan | 712 | Restart state |
| California | 711 | Comparison |
| Ohio | 697 | Neighbor |
| Minnesota | 663 | Neighbor |
Iowa’s household electricity bill climbed, then jumped in 2022

View exact chart values
| year | pce_electricity_millions | per_capita_dollars |
|---|---|---|
| 2005 | 1328.5 | 448 |
| 2006 | 1383 | 464 |
| 2007 | 1414.7 | 472 |
| 2008 | 1460.6 | 484 |
| 2009 | 1444.3 | 476 |
| 2010 | 1541.7 | 505 |
| 2011 | 1530 | 498 |
| 2012 | 1522.5 | 494 |
| 2013 | 1665.6 | 537 |
| 2014 | 1811.6 | 580 |
| 2015 | 1743.5 | 556 |
| 2016 | 1767.6 | 561 |
| 2017 | 1790.6 | 566 |
| 2018 | 1931.8 | 609 |
| 2019 | 1987.3 | 624 |
| 2020 | 1933.9 | 606 |
| 2021 | 1933.9 | 605 |
| 2022 | 2315.5 | 723 |
| 2023 | 2214.3 | 689 |
| 2024 | 2314.2 | 716 |
The other zombie plants sit in bigger power economies
The same reporting names two cousins of Duane Arnold: Palisades in Michigan, restarting with a $1.52 billion federal loan, and Three Mile Island Unit 1 in Pennsylvania, tied to Microsoft. Those states already run larger utilities sectors. Michigan’s utilities GDP was $12.6 billion in 2025, 1.7 percent of a $730 billion economy. Pennsylvania’s was $15.9 billion, 1.5 percent of a $1.06 trillion economy. Iowa’s utilities share of GDP, 1.4 percent, is in the same neighborhood. The dollar size is not.
The payroll gap is wider. Michigan had about 20,900 utilities jobs in July 2026; Pennsylvania had 23,000. Iowa had 5,600. Adding 450 jobs in Iowa would be a bigger proportional jolt than the same hire in Harrisburg or Lansing. That is the honest reading of the tables: Duane Arnold is a large bet on a small Iowa industry that has been shrinking in real output and in headcount, sold as protection for household bills that are not unusually high, and aimed at a data-processing sector that is still a sliver of the state’s GDP. Whether Google’s 70 percent of a 615-megawatt plant changes those proportions is a 2029 question. The 2025 books say the starting point is modest.
Sources and methods
This is retrospective enrichment using pinned catalogue snapshots, not a reconstruction of what was knowable on the 2026-09-09 edition date. Later releases and revisions may be present in the snapshots.
Research was compiled on 2026-09-11. The historical edition date is 2026-09-09.
BEA annual state GDP and income (SAGDP/SAINC) uses the bea-regional-state-annual-2026-04-09 release, normalized snapshot created 2026-08-31. Observation years cited are calendar 2005–2025 unless noted. Units are millions of current dollars for nominal GDP and millions of chained 2017 dollars for real utilities GDP.
BEA state personal consumption expenditures use the bea-sapce-2025-09-26 release, snapshot created 2026-08-31, calendar years 2005–2024. Electricity is household PCE on electricity, millions of current dollars. Per-person figures divide that aggregate by BEA SAINC population (persons). That is not a household average and is not industrial or data-center load.
BLS State and Area Employment uses the bls-sm-snapshot-2026-08-24 release. Utilities employment is not seasonally adjusted (statewide NAICS utilities). Construction and total nonfarm are seasonally adjusted. July observations are used in the multi-state employment chart to limit seasonal noise in the NSA utilities series. Latest monthly values in the jobs comparison are July 2026.
Utilities GDP and employment are NAICS 22 (electric power, natural gas, steam, water, sewage), not nuclear generation alone. Data processing, hosting and other information services GDP for Iowa in 2025 is missing in the extract and was not treated as zero; 2024 is used where that series is cited.
The $1.9 billion loan, 615 megawatts, 70 percent Google offtake, 450 permanent jobs and 1,500 construction-period jobs are from contemporaneous reporting, not BEA or BLS. Those reported job counts are compared with official payrolls; the comparison is descriptive, not a forecast or a causal claim.
Missing values were skipped, not recoded as zero. No duplicate years were found in the annual series used. No causal effect of the loan, the data center or the plant restart is inferred from these descriptive comparisons.
Research completed 2026-09-11, for the September 9, 2026 news edition. This is retrospective analysis, not a reconstruction of information available that day.