Research
$54 billion, in a $75 billion state
A pipeline-sized check
President Trump is expected to announce about $54 billion of South Korean investment in an 807-mile natural gas line from Alaska’s North Slope to a liquefied-natural-gas terminal in the south — a project Republican Sen. Dan Sullivan has long championed, in a Senate race Democrats are actually contesting. The White House says it will eventually lower energy costs for Alaskans. That is a political sentence. The accounting sentence is simpler, and ruder. Associated Press
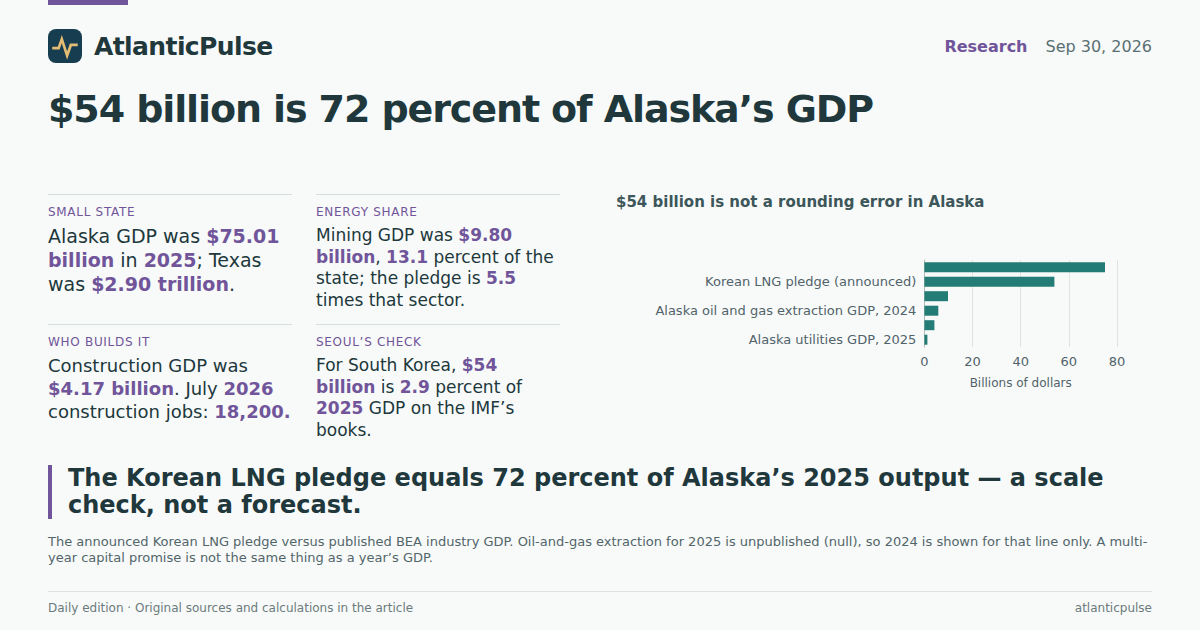
In calendar 2025, Alaska’s entire current-dollar GDP was $75.01 billion, according to the Bureau of Economic Analysis. The announced Korean check is 72 percent of that year’s output. It is not 72 percent of Texas. Texas produced $2.90 trillion in 2025. The United States produced $30.76 trillion. Alaska was 0.24 percent of the national total. A $54 billion capital pledge is a rounding error in Houston and a transformation, if it is real and if it is spent, in Anchorage.
Two caveats, both load-bearing. First, a multi-year construction promise is not the same thing as a year’s GDP. Pipelines are built over a decade; GDP is a flow. Comparing the two is a scale check, not a forecast that Alaska’s output will jump 72 percent next year. Second, announcements are not wire transfers. South Korea’s 2025 trade-deal envelope was $350 billion of U.S. investment in exchange for lower auto tariffs. This $54 billion is one slice of that envelope, timed for a tight Senate map.
$54 billion is not a rounding error in Alaska

View exact chart values
| item | billions |
|---|---|
| Alaska utilities GDP, 2025 | 1.26 |
| Alaska construction GDP, 2025 | 4.173 |
| Alaska oil and gas extraction GDP, 2024 | 5.784 |
| Alaska mining GDP, 2025 | 9.8 |
| Korean LNG pledge (announced) | 54 |
| Alaska GDP, 2025 | 75.01 |
What “energy state” actually means on the books
Alaska is an oil state in the way a small restaurant is a “food business”: the identity is real, and it is not the whole menu. Mining, quarrying, and oil and gas extraction — the BEA sector that includes crude, gas, other minerals and mine-support work — contributed $9.80 billion in 2025, 13.1 percent of statewide GDP. The $54 billion pledge is 5.5 times that sector’s entire annual output. Construction, the industry that would actually grade the right-of-way, was $4.17 billion, 5.6 percent. Utilities, which would someday move the electrons and the gas, were $1.26 billion, 1.7 percent. Everything else — government, health care, trade, the rest of private services — was about 80 percent of the economy.
Narrower oil-and-gas extraction, the line that excludes coal mines and quarry work, is even smaller, and for 2025 BEA has not published a number at all: the cell is null, not zero. In 2024 that line was $5.78 billion. Treat a missing 2025 observation as missing. Do not fill it in with hope.
Current-dollar mining GDP tells a boom-bust story the campaign ads will skip. It peaked at $20.38 billion in 2008, collapsed with oil prices after 2014, bottomed near $5.4 billion in 2020, and has recovered only to about $10 billion. Statewide GDP, padded by other industries and by inflation, kept climbing to a record $75 billion. The energy identity is sticky. The energy share is not.
Energy extraction is important in Alaska. It is not the whole state.

View exact chart values
| category | share | billions |
|---|---|---|
| Mining, quarrying, oil and gas | 13.1 | 9.8 |
| Construction | 5.6 | 4.173 |
| Utilities | 1.7 | 1.26 |
| All other industries | 79.7 | 59.78 |
Alaska’s economy grew in dollars. Mining did not recapture its 2008 peak.

View exact chart values
| year | alaska_gdp_billions | mining_gdp_billions |
|---|---|---|
| 2000 | 26.93 | 4.47 |
| 2001 | 28.66 | 4.03 |
| 2002 | 29.88 | 4.56 |
| 2003 | 32.12 | 5.21 |
| 2004 | 35.39 | 7.24 |
| 2005 | 40.46 | 10.37 |
| 2006 | 44.95 | 13.78 |
| 2007 | 49.46 | 16.46 |
| 2008 | 55.25 | 20.38 |
| 2009 | 50.17 | 14.38 |
| 2010 | 53.65 | 15.71 |
| 2011 | 56.91 | 18.31 |
| 2012 | 58.32 | 18.28 |
| 2013 | 57.53 | 16.35 |
| 2014 | 56.59 | 14.21 |
| 2015 | 51.57 | 7.74 |
| 2016 | 51.12 | 6.32 |
| 2017 | 53.55 | 8.15 |
| 2018 | 54.76 | 8.28 |
| 2019 | 54.55 | 6.82 |
| 2020 | 51.86 | 5.37 |
| 2021 | 59.36 | 9.24 |
| 2022 | 65.68 | 11.16 |
| 2023 | 68.23 | 9.34 |
| 2024 | 71.57 | 9.78 |
| 2025 | 75.01 | 9.8 |
The volume did not vanish. The price did the damage.
Current dollars make Alaska look like a state that shrank whenever oil did. Chained 2017 dollars, which strip out price swings, say something less cinematic. Real statewide GDP rose 50 percent from 2000 to 2025. Real mining GDP rose 58 percent over the same span, with a nasty 2022 trough — the index fell to 104, barely above 2000 — and a rebound to 158 by 2025. In other words, Alaska still takes hydrocarbons out of the ground. What collapsed in the 2010s was the check that came with each barrel, not the entire industrial base.
That matters for a pipeline pitch. An LNG line is a bet that Asian buyers will pay for North Slope gas for decades, not a rescue of a vanished workforce. Quarterly accounts, which run later than the annual file, show the same pattern in a hotter oil year: in 2026 Q1, Alaska’s GDP ran at a $78.83 billion seasonally adjusted annual rate, with mining at $11.76 billion. Those are annualized flows, not a new run-rate that can be added to the $54 billion. They do show an economy that is not, at present, in a 2015-style hole.
In real terms, Alaska’s mining output is larger than in 2000 — after a long dip

View exact chart values
| year | real_gdp_index | real_mining_index |
|---|---|---|
| 2000 | 100 | 100 |
| 2001 | 104.1 | 94.4 |
| 2002 | 109 | 126.5 |
| 2003 | 107.3 | 95 |
| 2004 | 111.6 | 109.3 |
| 2005 | 115.6 | 114 |
| 2006 | 123.7 | 147.5 |
| 2007 | 130.4 | 165.5 |
| 2008 | 129.9 | 153 |
| 2009 | 143 | 200.6 |
| 2010 | 139.6 | 168.4 |
| 2011 | 140.6 | 172.8 |
| 2012 | 148.6 | 198.4 |
| 2013 | 142.2 | 168.9 |
| 2014 | 138.7 | 151.2 |
| 2015 | 139.7 | 148.7 |
| 2016 | 139.1 | 138 |
| 2017 | 139.4 | 142.5 |
| 2018 | 136.6 | 125.5 |
| 2019 | 136.3 | 126.4 |
| 2020 | 132.5 | 142.2 |
| 2021 | 134.7 | 131.8 |
| 2022 | 131.4 | 104.2 |
| 2023 | 141 | 137.6 |
| 2024 | 145.6 | 150.1 |
| 2025 | 149.6 | 158.1 |
The people who would pour the concrete
GDP is an output number. Jobs are a headcount. In July 2026, Alaska construction employment was 18,200, seasonally adjusted, according to the Bureau of Labor Statistics. That is below a 19,900 peak in March 2025 and not wildly different from the mid-2000s building boom. Mining and logging — a broader payroll than oil wells alone, and the series Alaska actually publishes on a seasonally adjusted basis — stood at 13,900, versus an 18,000 peak in November 2014. Statewide nonfarm employment was 339,700 in July 2026, a hair under the March 2015 peak of 340,800.
A project sold as transformational is arriving in a labor market that is already roughly full, with a construction roster smaller than a large Lower 48 high school district. That does not prove the line cannot be built. It does prove that “thousands of jobs” would be a very large claim relative to the payroll that exists, and that most of the $54 billion, if it is spent, would have to show up as steel, pipe, ships and contractors from somewhere else — which is how Arctic megaprojects usually work, and which is not the same as a statewide hiring surge Sullivan can take to a town hall.
The crews who would build a pipeline are a small payroll

View exact chart values
| year | construction_thousands | mining_logging_thousands |
|---|---|---|
| 2000 | 14 | 11.2 |
| 2001 | 15.1 | 11.7 |
| 2002 | 15.8 | 11.1 |
| 2003 | 17.1 | 10 |
| 2004 | 17.9 | 10.1 |
| 2005 | 19.2 | 10.3 |
| 2006 | 18.5 | 11.7 |
| 2007 | 17.6 | 13.8 |
| 2008 | 17.6 | 15 |
| 2009 | 16.5 | 14.7 |
| 2010 | 16.7 | 15.4 |
| 2011 | 16.3 | 15.6 |
| 2012 | 17.2 | 16.6 |
| 2013 | 17.1 | 16.7 |
| 2014 | 17.6 | 17.4 |
| 2015 | 17.5 | 17.4 |
| 2016 | 16.5 | 14 |
| 2017 | 15.1 | 13.2 |
| 2018 | 15.7 | 12.6 |
| 2019 | 16.3 | 13.4 |
| 2020 | 15.2 | 10.2 |
| 2021 | 16.4 | 10.8 |
| 2022 | 16.2 | 11 |
| 2023 | 17.3 | 11.7 |
| 2024 | 18.3 | 12.5 |
| 2025 | 18.9 | 13.2 |
| 2026 | 18.2 | 13.9 |
Korea’s checkbook, and what the pledge is not
South Korea’s economy, on the IMF’s 2025 reading, was about $1.87 trillion. The Alaska pledge is 2.9 percent of that — material for Seoul, not existential. The IMF’s 2026 figure, $1.93 trillion in the August 2026 World Economic Outlook snapshot, is a projection, not a closing print; do not read it as a fact already in the bank. From Seoul’s side, $54 billion is a trade-deal installment. From Juneau’s side, it is three-quarters of a year’s economic output.
None of this says the gas will flow, that prices will fall, or that a Senate race will turn on a groundbreaking. Official books cannot answer those questions. They can answer a smaller one that the announcement invites: if you put a $54 billion sign next to Alaska, you are not pointing at a rounding error. You are pointing at a state whose mining sector is a tenth of its economy, whose construction payroll is 18,000 people, and whose entire annual output would not cover the sign with much left over. That is the scale. The rest is politics.
Sources and methods
BEA annual state GDP (SAGDP2 current dollars; SAGDP9 chained 2017 dollars), 2000–2025, Alaska and, for scale, the United States and Texas. Release identifier bea-regional-state-annual-2026-04-09. Units are millions of dollars; figures convert to billions by dividing by 1,000. Oil-and-gas extraction (NAICS 211) is null for Alaska in 2025; 2024 is used only where that line is cited, and missing is not treated as zero.
BEA quarterly state GDP (SQGDP2), seasonally adjusted annual rates, 2018 Q1–2026 Q1, release bea-regional-state-quarterly-2026-06-25. Quarterly levels are annualized flows and are not added to annual GDP or to the $54 billion pledge.
BLS State and Area Employment, seasonally adjusted, Alaska statewide construction (SMS02000002000000001) and mining and logging (SMS02000001000000001), plus total nonfarm. Snapshot bls-sm-snapshot-2026-08-24, observations through July 2026. Values are thousands of jobs. July snapshots are used for the long jobs chart; peak months may differ from July.
IMF WEO series NGDPD (GDP, current prices, US$), Korea and the United States, snapshot 2026-08-24. 2025 is treated as the latest WEO estimate in that vintage; 2026 is a projection and is labeled as such. IMF dollars are full USD, not millions.
The $54 billion LNG figure is the amount in 2026-09-30 reporting of the White House announcement, not a BEA or IMF observation. Comparing a multi-year capital pledge with annual GDP is a scale illustration only. No causal claim is made about prices, construction, or the Senate race. Provider/refresh lag is normal; these are not current-day prints.
Research completed 2026-10-01, for the September 30, 2026 news edition. The available source data may cover earlier periods; see the observation periods and source vintages above.