Research
What a $5,000 “Dividend” Looks Like Next to Real Paychecks
A round number next to a real paycheck
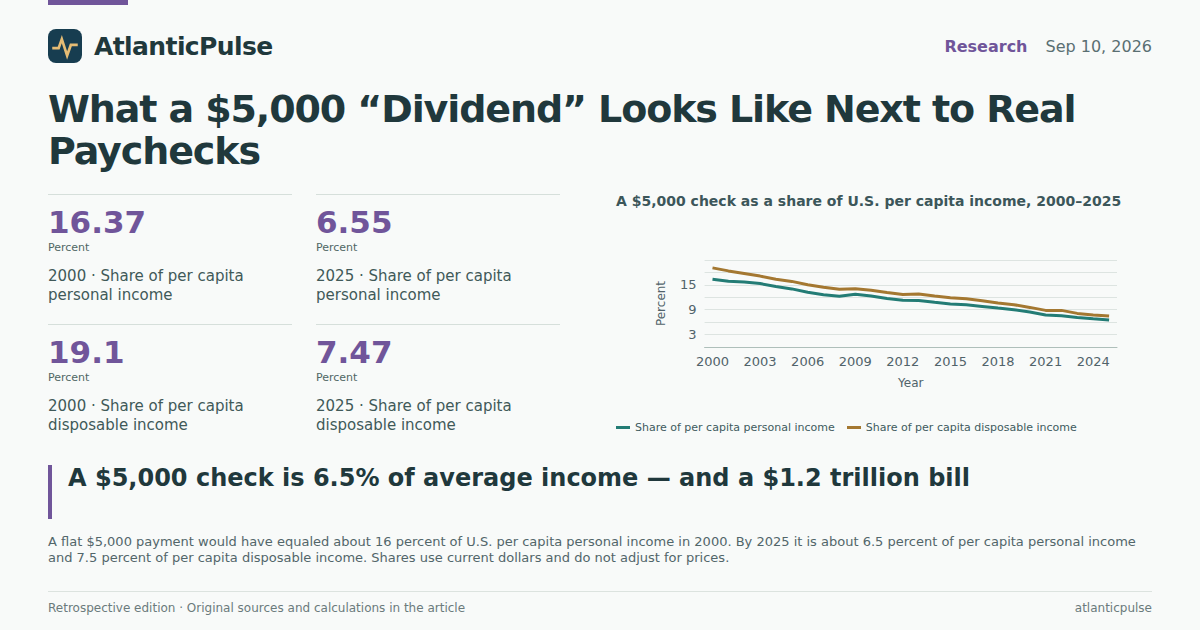
President Donald Trump’s $5,000 “dividend” for adult citizens, pitched in Dallas as a reward if Republicans hold Congress, is the sort of figure that fits on a hat. Measuring it is less glamorous. Using the Bureau of Economic Analysis regional accounts, U.S. per capita personal income was $76,393 in 2025. Per capita disposable personal income — what is left after taxes — was $66,931. A $5,000 check is 6.55 percent of the first and 7.47 percent of the second. That is a fat holiday bonus for many households. It is not a second salary.
Twenty-five years earlier, the same $5,000 would have been a much larger slice of a smaller pie: 16.4 percent of per capita personal income in 2000 and 19.1 percent of disposable income. The proposed check is a constant; incomes are not. In current dollars, the share slides almost every year, with a small uptick when incomes fell in 2009. The pandemic years fattened transfer receipts, not the wage-and-salary core, which is why the income-share lines keep drifting down even as Washington got more generous in 2020 and 2021. A slogan that sounded like a windfall in 2000 still sounds like one. Relative to average receipts, it has been quietly demoted.
Two traps sit next to that chart. Per capita personal income divides all personal income by every resident, including children who would not receive an adult-citizen check. A couple would be looking at $10,000; a single parent, $5,000. And these are national averages in current dollars, not a typical family’s take-home pay and not an inflation-adjusted stipend. The point of the comparison is narrower: if the number on the podium is meant to sound transformative, it should be set beside the $76,000 already attached, on average, to each person in the accounts.
A $5,000 check as a share of U.S. per capita income, 2000–2025

View exact chart values
| year | pcpi | dpi | check | check_share_pcpi_pct | check_share_dpi_pct | transfers_pc | check_share_xfer_pct |
|---|---|---|---|---|---|---|---|
| 2000 | 30551 | 26173 | 5000 | 16.37 | 19.1 | 3853 | 129.77 |
| 2001 | 31548 | 27204 | 5000 | 15.85 | 18.38 | 4185 | 119.47 |
| 2002 | 31801 | 28146 | 5000 | 15.72 | 17.76 | 4468 | 111.91 |
| 2003 | 32659 | 29204 | 5000 | 15.31 | 17.12 | 4644 | 107.67 |
| 2004 | 34183 | 30605 | 5000 | 14.63 | 16.34 | 4854 | 103.01 |
| 2005 | 35669 | 31571 | 5000 | 14.02 | 15.84 | 5132 | 97.43 |
| 2006 | 37843 | 33300 | 5000 | 13.21 | 15.02 | 5409 | 92.44 |
| 2007 | 39588 | 34639 | 5000 | 12.63 | 14.43 | 5737 | 87.15 |
| 2008 | 40854 | 35902 | 5000 | 12.24 | 13.93 | 6429 | 77.77 |
| 2009 | 39307 | 35555 | 5000 | 12.72 | 14.06 | 6998 | 71.45 |
| 2010 | 40557 | 36562 | 5000 | 12.33 | 13.68 | 7515 | 66.53 |
| 2011 | 42650 | 37994 | 5000 | 11.72 | 13.16 | 7564 | 66.1 |
| 2012 | 44238 | 39442 | 5000 | 11.3 | 12.68 | 7517 | 66.52 |
| 2013 | 44402 | 39111 | 5000 | 11.26 | 12.78 | 7654 | 65.33 |
| 2014 | 46289 | 40701 | 5000 | 10.8 | 12.28 | 7961 | 62.81 |
| 2015 | 48062 | 42036 | 5000 | 10.4 | 11.89 | 8344 | 59.92 |
| 2016 | 48974 | 42939 | 5000 | 10.21 | 11.64 | 8562 | 58.4 |
| 2017 | 51006 | 44737 | 5000 | 9.8 | 11.18 | 8743 | 57.19 |
| 2018 | 53311 | 47004 | 5000 | 9.38 | 10.64 | 9059 | 55.19 |
| 2019 | 55567 | 48915 | 5000 | 9 | 10.22 | 9530 | 52.47 |
| 2020 | 59151 | 52377 | 5000 | 8.45 | 9.55 | 12773 | 39.15 |
| 2021 | 64692 | 56575 | 5000 | 7.73 | 8.84 | 14032 | 35.63 |
| 2022 | 66303 | 56601 | 5000 | 7.54 | 8.83 | 12394 | 40.34 |
| 2023 | 70013 | 61600 | 5000 | 7.14 | 8.12 | 12640 | 39.56 |
| 2024 | 73227 | 64446 | 5000 | 6.83 | 7.76 | 13398 | 37.32 |
| 2025 | 76393 | 66931 | 5000 | 6.55 | 7.47 | — | — |
Fifty-one ways to cash $5,000
The national average conceals a wide state spread. Mississippi’s 2025 per capita personal income was $54,531, so $5,000 is 9.17 percent of that yardstick. In the District of Columbia the figure is $116,121, and the check is 4.31 percent. West Virginia (8.63 percent) and Alabama (8.38 percent) sit with Mississippi; Connecticut (5.06 percent) and Massachusetts (5.13 percent) with the high-income coast. Texas lands at 6.91 percent, Florida at 6.54 percent, New York at 5.63 percent, California at 5.49 percent. Wyoming, at $89,806 per person, looks more like California than like its rural neighbors — a reminder that energy rents and sparse population can do what a tech payroll does.
A flat check is a bigger deal where average incomes are lower. That is both the populist feature and the targeting bug. BEA’s state personal income is not a wage, and it is not poverty: it folds in transfers, farms, oil, and capital. Ranking states by the check’s share of per capita income is almost an inverse income ranking, which is the entire design. It does not tell you whether Jackson or Stamford “needs” $5,000. It tells you the slogan is not the same product in both places, and that a national average of 6.5 percent hides a band from roughly nine percent to a little over four.
$5,000 as a share of 2025 per capita personal income, by state

View exact chart values
| state | abbr | pcpi_2025 | check_share_pct |
|---|---|---|---|
| Mississippi | MS | 54531 | 9.17 |
| West Virginia | WV | 57932 | 8.63 |
| Alabama | AL | 59677 | 8.38 |
| Kentucky | KY | 60673 | 8.24 |
| New Mexico | NM | 61645 | 8.11 |
| Arkansas | AR | 61752 | 8.1 |
| South Carolina | SC | 63179 | 7.91 |
| Louisiana | LA | 63940 | 7.82 |
| Idaho | ID | 64846 | 7.71 |
| Georgia | GA | 65382 | 7.65 |
| Indiana | IN | 66292 | 7.54 |
| Michigan | MI | 66556 | 7.51 |
| Oklahoma | OK | 66660 | 7.5 |
| Ohio | OH | 67291 | 7.43 |
| Missouri | MO | 67587 | 7.4 |
| Arizona | AZ | 68283 | 7.32 |
| Iowa | IA | 68326 | 7.32 |
| North Carolina | NC | 68511 | 7.3 |
| Tennessee | TN | 69131 | 7.23 |
| Kansas | KS | 69510 | 7.19 |
| Utah | UT | 69991 | 7.14 |
| Wisconsin | WI | 70570 | 7.09 |
| Delaware | DE | 71357 | 7.01 |
| Maine | ME | 71662 | 6.98 |
| Montana | MT | 72340 | 6.91 |
| Texas | TX | 72364 | 6.91 |
| Nevada | NV | 73156 | 6.83 |
| Oregon | OR | 73678 | 6.79 |
| Rhode Island | RI | 73992 | 6.76 |
| Pennsylvania | PA | 74231 | 6.74 |
| Vermont | VT | 74580 | 6.7 |
| North Dakota | ND | 75157 | 6.65 |
| Nebraska | NE | 75858 | 6.59 |
| Florida | FL | 76440 | 6.54 |
| Hawaii | HI | 76592 | 6.53 |
| Illinois | IL | 77772 | 6.43 |
| Minnesota | MN | 78538 | 6.37 |
| South Dakota | SD | 79297 | 6.31 |
| Alaska | AK | 80175 | 6.24 |
| Virginia | VA | 80291 | 6.23 |
| Maryland | MD | 81834 | 6.11 |
| Colorado | CO | 86181 | 5.8 |
| New Hampshire | NH | 86959 | 5.75 |
| New Jersey | NJ | 88223 | 5.67 |
| New York | NY | 88847 | 5.63 |
| Washington | WA | 89396 | 5.59 |
| Wyoming | WY | 89806 | 5.57 |
| California | CA | 91116 | 5.49 |
| Massachusetts | MA | 97456 | 5.13 |
| Connecticut | CT | 98879 | 5.06 |
| District of Columbia | DC | 116121 | 4.31 |
Three weeks on the clock
Another way to size the check is to ask how long people already work to earn it. Average hourly earnings of all private employees, seasonally adjusted, from the Current Employment Statistics program, were $37.62 in July 2026. At that mean, $5,000 is 132.9 hours — 3.32 weeks at 40 hours. In January 2015, when the average private wage was $24.74, the same $5,000 took 202 hours. Plot January and July of each year and the hours line falls steadily, including through the 2020 jump in measured hourly earnings when lower-wage hours disappeared from the average.
Treat that as a unit of account, not a lifestyle. The CES average is a mean for private payroll jobs, not a median, not take-home pay, and not a wage for people who are retired, unemployed, self-employed, or on a federal salary. A check also does not require a timesheet. The hours math only answers the question the podium invites: is $5,000 a year’s work, a month’s work, or something you could, at the average private wage, earn between Labor Day and Columbus Day? It is the last of those. That still leaves open whether the Treasury should write it.
Private-sector hours needed to earn $5,000, 2015–2026

View exact chart values
| period | ahe | hours_for_5000 |
|---|---|---|
| 2015-01 | 24.74 | 202.1 |
| 2015-07 | 25.01 | 199.9 |
| 2016-01 | 25.37 | 197.1 |
| 2016-07 | 25.69 | 194.6 |
| 2017-01 | 26 | 192.3 |
| 2017-07 | 26.35 | 189.8 |
| 2018-01 | 26.72 | 187.1 |
| 2018-07 | 27.1 | 184.5 |
| 2019-01 | 27.59 | 181.2 |
| 2019-07 | 28.03 | 178.4 |
| 2020-01 | 28.43 | 175.9 |
| 2020-07 | 29.39 | 170.1 |
| 2021-01 | 29.93 | 167.1 |
| 2021-07 | 30.66 | 163.1 |
| 2022-01 | 31.6 | 158.2 |
| 2022-07 | 32.34 | 154.6 |
| 2023-01 | 33.02 | 151.4 |
| 2023-07 | 33.85 | 147.7 |
| 2024-01 | 34.47 | 145.1 |
| 2024-07 | 35.08 | 142.5 |
| 2025-01 | 35.84 | 139.5 |
| 2025-07 | 36.47 | 137.1 |
| 2026-01 | 37.15 | 134.6 |
| 2026-07 | 37.62 | 132.9 |
The transfers already in the mail
Before anyone prints a dividend, it is worth asking what government already sends. Per capita personal current transfer receipts in the BEA economic profile were $13,398 in 2024, the latest year in this snapshot. Social Security, Medicare, Medicaid, unemployment insurance, veterans’ benefits and the rest already move more than two and a half $5,000 checks per resident. The proposed payment is 37.3 percent of that 2024 flow. In 2000, transfers were $3,853 per person and $5,000 would have exceeded them (130 percent). The pandemic spike in 2020–21 pushed transfers to $12,773 and $14,032; the check shrank to 39 percent and 36 percent of those totals, then settled near 37 percent as transfers remained high.
Transfers are not evenly ladled either. Among nine states spanning the income distribution, 2024 per capita transfers ran from $10,704 in Texas to $16,346 in West Virginia. Texas is the interesting cell: mid-range incomes, thin transfers, so $5,000 would cover 47 percent of the existing transfer stack. Mississippi pairs low incomes with heavy transfers ($14,296), so the check is 35 percent of transfers even though it is 9 percent of income. The District of Columbia is richer than Connecticut and still takes in $14,271 per person in transfers — roughly Mississippi’s transfer intensity at more than double the income. A universal adult check would overlay that map rather than replace it.
This is not an argument that $5,000 is redundant. Transfers are concentrated among older and lower-income households; a check for every adult citizen is not. It is an argument that the proposed dividend is smaller than the transfer system already in place, except in states where that system is relatively thin, and that “new money” should be compared with money that already moves.
Incomes and transfers in nine states, 2024

View exact chart values
| state | abbr | pcpi_2024 | transfers_pc_2024 | check_share_pcpi_pct | check_share_xfer_pct |
|---|---|---|---|---|---|
| Mississippi | MS | 51948 | 14296 | 9.63 | 34.97 |
| West Virginia | WV | 55432 | 16346 | 9.02 | 30.59 |
| District of Columbia | DC | 112944 | 14271 | 4.43 | 35.04 |
| Connecticut | CT | 95083 | 13776 | 5.26 | 36.3 |
| California | CA | 86378 | 14477 | 5.79 | 34.54 |
| Texas | TX | 69762 | 10704 | 7.17 | 46.71 |
| Florida | FL | 73340 | 14177 | 6.82 | 35.27 |
| New York | NY | 84978 | 15396 | 5.88 | 32.48 |
| Alabama | AL | 57251 | 13786 | 8.73 | 36.27 |
The line item that is not a rounding error
Campaigns talk in thousands. Budgets talk in trillions. Contemporaneous reporting put adult citizens at about 240 million; $5,000 each is $1.2 trillion. That is the scenario used here, not a BEA headcount. (BEA’s 2025 U.S. population, all ages, was 342 million.) Other tallies of a broader adult payout ran higher. Either figure is large enough to see from orbit.
U.S. personal income in 2025 was $26.11 trillion. GDP was $30.76 trillion in the BEA state accounts, and $30.77 trillion in the IMF World Economic Outlook vintage used here. A $1.2 trillion payout is 4.6 percent of personal income and 3.9 percent of GDP. The same WEO vintage puts general-government revenue at 30.9 percent of GDP, or $9.50 trillion; the payout is 12.6 percent of that revenue. Net lending/borrowing is −6.8 percent of GDP, a gap of about $2.10 trillion. The checks would sit beside that deficit, not inside a surplus, and they would consume a double-digit share of the revenue the IMF attributes to general government.
These ratios do not say whether the dividend is good policy. They do not estimate inflation, interest costs, or take-up, and they do not test the claim that tariff revenue could pay for it. Average hourly earnings are not household budgets; per capita income is not adult income; IMF general-government revenue is not the federal unified budget. What the accounts do say is less mystical than a shareholder metaphor. In a $76,000-per-person economy, $5,000 is a moderate share of average resources, a large share of existing transfers only where the safety net is thin, and a fiscal commitment in the same league as a major tax cut. The check can be both a windfall at the kitchen table and a very large bill at the Treasury. Those facts can be true at the same time. The slogan prefers that you notice only the first.
A $1.2 trillion payout beside income, output, and revenue

View exact chart values
| item | billion_usd |
|---|---|
| Proposed payout, 240 million adults | 1200 |
| U.S. personal income, 2025 | 26109.8 |
| U.S. GDP, 2025 (BEA) | 30762.1 |
| IMF WEO U.S. GDP, 2025 vintage | 30767.1 |
| IMF WEO general-government revenue, 2025 vintage | 9501 |
Sources and methods
This is retrospective enrichment using pinned catalogue snapshots, researched on 11 September 2026 for the 10 September 2026 National edition. It is not a reconstruction of what was known on the edition date; later releases and revisions may be present.
BEA regional annual personal income, disposable personal income, personal current transfer receipts, population, and GDP come from source release bea-regional-state-annual-2026-04-09. National and state per capita personal income and disposable income are observed annually for 2000–2025. Per capita transfers are observed through 2024; 2025 is missing and was not treated as zero. Dollar figures are current dollars, not inflation-adjusted. Per capita series divide totals by resident population of all ages, including children who would not receive an adult-citizen check.
The $1.2 trillion payout scenario multiplies $5,000 by 240 million adult citizens, a headcount taken from contemporaneous reporting rather than a BEA or Census adult-citizen series. BEA U.S. population in 2025 was 341.8 million people of all ages. The calculation does not model income caps, citizenship verification, take-up, or financing.
BLS Current Employment Statistics average hourly earnings of all private employees, seasonally adjusted (CES0500000003), use snapshot bls-ce-snapshot-2026-08-24, with monthly observations from January 2015 through July 2026. Hours required to earn $5,000 are $5,000 divided by that mean wage. The hours history chart uses January and July observations only. The series is a private-payroll mean, not a median and not a wage for people outside private employment.
IMF World Economic Outlook figures use the 24 August 2026 snapshot. 2025 general-government revenue, net lending/borrowing, and GDP may mix outturns and estimates in that vintage. Revenue in dollars is 2025 GDP times the revenue-to-GDP ratio. The deficit dollar figure is the absolute value of net lending as a share of GDP. IMF general government is not the U.S. federal unified budget.
The nine-state transfer scatter (Alabama, California, Connecticut, District of Columbia, Florida, Mississippi, New York, Texas, West Virginia) was selected to span low- and high-income areas and large populations; it is not a complete 51-area transfer panel. Missing observations were dropped. Shares are descriptive ratios only. No causal effect on spending, inflation, or growth is inferred.
Research completed 2026-09-12, for the September 10, 2026 news edition. This is retrospective analysis, not a reconstruction of information available that day.