Research
West Virginia’s nuclear bid is chasing an energy economy that already moved
A campus on paper, a payroll already in motion
West Virginia’s pitch for a Nuclear Lifecycle Innovation Campus is still mostly a seven-page memorandum. Gov. Patrick Morrisey has the state on a six-finalist list with Idaho, Louisiana, Oklahoma, Tennessee and Utah. The document would, if the Energy Department picks the state, put land under federal jurisdiction, hustle permits and defer to DOE or the Nuclear Regulatory Commission when rules collide. A state energy official has been careful to say there is no award yet.
That is the right amount of caution. A nuclear hub is a long-cycle bet. The books West Virginia already keeps are not. State payroll files through July 2026 and BEA state GDP through 2024 show an energy economy that has already changed shape: mining jobs are below their 2011 peak, factories have been shrinking for a generation, and the sector that still throws off a large share of state output is not the one a reactor would most obviously join. The campus, if it arrives, would not be landing on a frozen coal state. It would be landing on one that already swapped some of its coal paycheck for gas wells and a much smaller factory floor.
West Virginia payrolls, July 2000 = 100

View exact chart values
| year | mining_index | manufacturing_index | construction_index | nonfarm_index |
|---|---|---|---|---|
| 2000 | 100 | 100 | 100 | 100 |
| 2001 | 114.2 | 94.9 | 99.7 | 99.6 |
| 2002 | 106.2 | 90.2 | 99.4 | 99.6 |
| 2003 | 103.8 | 85.1 | 97.3 | 98.9 |
| 2004 | 113.7 | 83 | 102.7 | 100.2 |
| 2005 | 123.2 | 82.3 | 108.3 | 101.7 |
| 2006 | 133.6 | 80.2 | 115.3 | 102.3 |
| 2007 | 137 | 78.2 | 113.9 | 102.8 |
| 2008 | 148.8 | 74.7 | 114.2 | 103.7 |
| 2009 | 135.5 | 64.6 | 97.3 | 100.9 |
| 2010 | 145 | 65.2 | 97.3 | 101.9 |
| 2011 | 160.7 | 65.4 | 98.5 | 102.3 |
| 2012 | 156.9 | 64.8 | 104.7 | 103.2 |
| 2013 | 151.7 | 64 | 101.8 | 103.4 |
| 2014 | 143.1 | 63.2 | 100 | 102.3 |
| 2015 | 120.9 | 62.7 | 95.6 | 102.3 |
| 2016 | 92.4 | 62 | 85.8 | 100.6 |
| 2017 | 105.2 | 61.7 | 90.6 | 100.9 |
| 2018 | 109.5 | 61.9 | 126.3 | 103 |
| 2019 | 106.6 | 62.1 | 107.1 | 102 |
| 2020 | 77.3 | 57.4 | 84.7 | 93.4 |
| 2021 | 84.4 | 60.4 | 90.9 | 97.5 |
| 2022 | 94.8 | 61.3 | 92.3 | 99.3 |
| 2023 | 100.9 | 60.9 | 95.9 | 100.7 |
| 2024 | 100.9 | 60.4 | 99.1 | 102.1 |
| 2025 | 96.2 | 59.6 | 103.2 | 102.3 |
| 2026 | 91.9 | 59.6 | 103.5 | 102.5 |
The jobs that left are not mostly in the mines
Start with the employment ledger, because that is what a “high-paying jobs” promise is measured against. In July 2026, West Virginia had 19,400 seasonally adjusted mining-and-logging jobs and 720,200 total nonfarm jobs. Mining and logging was 2.7 percent of the payroll. That is not a rounding error in Charleston. It is also not a majority industry, and it has not been one in this century.
The direction of travel is clearer than the level. Mining and logging employment in July 2000 was 21,100. It rose to a July peak of 33,900 in 2011, then fell. July 2026 is 8 percent below 2000 and 43 percent below that 2011 peak. Construction, at 35,100, is slightly above 2000. Total nonfarm payrolls are only 2.5 percent higher than in July 2000 — a quarter-century in which the United States added a great many jobs that West Virginia did not.
The deeper cut is in factories. Manufacturing employment was 75,800 in July 2000 and 45,200 in July 2026, a 40 percent decline. If the nuclear campus is sold as a manufacturing-and-energy play, it is walking into an industry that has already given up three in every eight factory jobs the state had at the turn of the century. Mining did not do most of that damage. Factories did.
Output still looks like an energy state. The headcount does not.
GDP tells a louder energy story than the job count, which is a reminder not to confuse payrolls with the value of what comes out of the ground. In 2024, the latest full year in the BEA extract, West Virginia’s current-dollar GDP was $106.5 billion. Mining, quarrying and oil-and-gas extraction accounted for $14.2 billion, or 13.4 percent of the economy. Manufacturing, combining durable and nondurable goods, was $8.9 billion, or 8.4 percent. Utilities — electric power, gas distribution, water and sewer — were $2.8 billion, or 2.7 percent.
That mix is the opposite of a simple “coal jobs” postcard. Mining is a fat slice of output and a thin slice of employment. Utilities, the industry a nuclear campus would most obviously sit inside, are a thin slice of both. Real GDP, in chained 2017 dollars, rose 37 percent from 1997 to 2024. The state got richer in inflation-adjusted output. It did not get a much larger payroll.
West Virginia’s $106 billion economy, 2024

View exact chart values
| category | millions | share_pct |
|---|---|---|
| Mining, quarrying, oil and gas | 14241.5 | 13.38 |
| Manufacturing | 8925 | 8.38 |
| Utilities | 2847.3 | 2.67 |
| All other industries | 80461.3 | 75.57 |
The gas wells showed up. The coal line did not vanish.
Inside mining, the composition shifted. BEA’s “mining except oil and gas” line, which includes coal, was $8.8 billion in 2024. Oil and gas extraction was $4.4 billion. Those two do not add to the $14.2 billion mining total because the total also includes mining support activities; treat the gap as support work, not as a missing coal seam. Oil and gas extraction was $154 million in 1997, a rounding error. By 2024 it was 31 percent of the mining total. Coal-and-minerals mining did not disappear: that line was $3.7 billion in 2015 and $8.8 billion in 2024, a current-dollar jump that also tracks energy prices. The point is not that coal left. It is that gas arrived, and the state’s mining GDP is no longer a single-fuel story.
None of that is a forecast for a reactor. Current-dollar mining GDP swings with prices. A hot year for gas can fatten the share without hiring a new shift. The 2022 spike, when mining reached 17.5 percent of state GDP, is the exhibit. By 2024 the share was back to 13.4 percent. Anyone who treats last year’s mining GDP as a permanent industrial base is reading a commodity ticker as if it were a headcount.
West Virginia mining output split: coal-and-minerals vs oil and gas

View exact chart values
| year | mining_except_oil_gas | oil_and_gas_extraction | mining_total |
|---|---|---|---|
| 1997 | 2584 | 154.3 | 2849.4 |
| 1998 | 2931.5 | 116.7 | 3189.9 |
| 1999 | 2556.3 | 113.5 | 2781.7 |
| 2000 | 2518.4 | 252.1 | 2892.3 |
| 2001 | 2726.7 | 282.6 | 3193.2 |
| 2002 | 2549.1 | 200 | 2915.2 |
| 2003 | 2631 | 303.1 | 3149.9 |
| 2004 | 2852.9 | 382.5 | 3556.7 |
| 2005 | 3946 | 604.7 | 4943 |
| 2006 | 4351.2 | 649 | 5607 |
| 2007 | 5152.5 | 712.3 | 6581.1 |
| 2008 | 6003.5 | 1001.7 | 7818.3 |
| 2009 | 6092.6 | 658.3 | 7414.4 |
| 2010 | 6693.7 | 763.3 | 8115.6 |
| 2011 | 7478.2 | 998.4 | 9302.9 |
| 2012 | 6201 | 1155.6 | 8159.6 |
| 2013 | 5317.8 | 2007.3 | 8320.6 |
| 2014 | 4489.7 | 3244.9 | 8908.4 |
| 2015 | 3689.9 | 2092.4 | 6509.6 |
| 2016 | 3244.5 | 1835.3 | 5536.8 |
| 2017 | 4434.2 | 2350.7 | 7448.2 |
| 2018 | 4597.6 | 2481 | 7985.1 |
| 2019 | 4799.3 | 2586.2 | 8203.1 |
| 2020 | 4120.5 | 2213.8 | 6857.4 |
| 2021 | 5624.3 | 5129.4 | 11354.7 |
| 2022 | 8445.4 | 7964.3 | 17295.7 |
| 2023 | 7647.2 | 5274.8 | 13887.5 |
| 2024 | 8778 | 4418 | 14241.5 |
Among the finalists, West Virginia is still the mining outlier
The other finalists did not wait for a nuclear memorandum to build something else. In July 2026, mining and logging was 1.6 percent of Oklahoma’s nonfarm jobs, 1.4 percent of Louisiana’s, 0.6 percent of Utah’s, 0.5 percent of Idaho’s and 0.13 percent of Tennessee’s. West Virginia’s 2.7 percent is the high mark in that group. Oklahoma and Louisiana actually have more mining-and-logging jobs in absolute terms — 28,200 and 27,600 — because they are larger labor markets. Tennessee’s entire mining-and-logging payroll is 4,300 people in a 3.4 million-job economy.
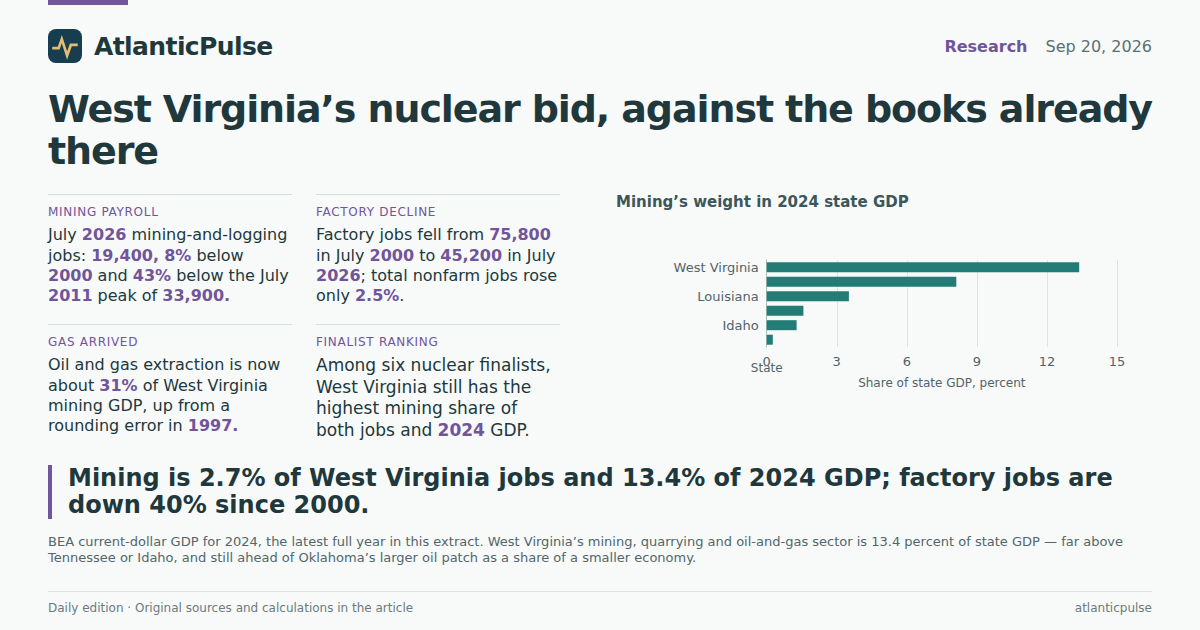
On the output side the ranking is the same and the gaps are wider. Mining, quarrying and oil and gas were 13.4 percent of West Virginia’s 2024 GDP, 8.1 percent of Oklahoma’s, 3.5 percent of Louisiana’s, 1.6 percent of Utah’s, 1.3 percent of Idaho’s and 0.26 percent of Tennessee’s. Tennessee’s economy, at $561 billion, is more than five times West Virginia’s. That is a large, diversified state with a long-standing lab complex. West Virginia is bidding to join that club from a much smaller base, with mining still the sector that moves the state GDP needle and utilities still a 3 percent slice.
A nuclear campus could still matter. A few thousand jobs would not be invisible in a 720,000-job labor market. It would not, on the official books as they stand, replace the factory jobs already gone, and it would not make mining a majority employer that it has not been. The memorandum is a framework. The payroll is the part that is already measurable.
Mining and logging as a share of July 2026 payrolls

View exact chart values
| state | mining_thousands | nonfarm_thousands | mining_share_pct |
|---|---|---|---|
| West Virginia | 19.4 | 720.2 | 2.69 |
| Oklahoma | 28.2 | 1796.1 | 1.57 |
| Louisiana | 27.6 | 2015.9 | 1.37 |
| Utah | 10.8 | 1787.4 | 0.6 |
| Idaho | 4.6 | 886.8 | 0.52 |
| Tennessee | 4.3 | 3385.1 | 0.13 |
Mining’s weight in 2024 state GDP

View exact chart values
| state | mining_gdp_millions | total_gdp_millions | mining_share_pct |
|---|---|---|---|
| West Virginia | 14241.5 | 106475.1 | 13.38 |
| Oklahoma | 21405 | 263695.1 | 8.12 |
| Louisiana | 11576.3 | 329172.8 | 3.52 |
| Utah | 4688.1 | 299471.3 | 1.57 |
| Idaho | 1648 | 129018.2 | 1.28 |
| Tennessee | 1467.6 | 561201.2 | 0.26 |
Sources and methods
Payroll figures are U.S. Bureau of Labor Statistics State and Area Employment series, seasonally adjusted, statewide, in thousands of jobs. Comparisons use July of each year so that 2026 can be aligned with earlier Julys. The mining series is the mining-and-logging supersector, which includes logging and oil and gas as well as coal; it is not a coal-only count. Manufacturing and construction are the matching statewide supersectors. The BLS snapshot used here is dated 24 August 2026 and runs through July 2026.
GDP figures are U.S. Bureau of Economic Analysis annual state estimates in millions of current dollars, except real GDP, which is millions of chained 2017 dollars. The latest complete year in this extract is 2024 (BEA regional release dated 9 April 2026). Mining GDP is NAICS 21 (mining, quarrying, and oil and gas extraction). “Mining except oil and gas” includes coal. Oil and gas extraction is a separate line. Those two lines plus mining support activities make up the mining total; they should not be added as if they were the whole sector. Manufacturing GDP is the sum of durable and nondurable goods. Utilities are NAICS 22. Shares are calculated from current-dollar totals and will move with energy prices.
The six-state comparison is the nuclear-campus finalist list named in West Virginia reporting: West Virginia, Idaho, Louisiana, Oklahoma, Tennessee and Utah. Dictionary presence is not treated as proof of observations; each series-geography pair was extracted. Missing values were not treated as zero. These are descriptive comparisons, not estimates of what a nuclear campus would add or of causal effects from the memorandum of understanding. Provider lag is normal: 2026 payrolls are monthly; 2025 annual GDP is not in this extract.
Research completed 2026-09-21, for the September 20, 2026 news edition. The available source data may cover earlier periods; see the observation periods and source vintages above.