Research
Utah’s data-center revolt is not a jobs boom
The fight is over water and notice, not a hiring hall
Mona, Utah, is a mountain-view town trying to stop a 3-million-square-foot data-center campus that residents say they learned about after a conditional-use permit was already granted. A Utah State University survey found only a quarter of Utahns oppose data centers in the abstract, but 68 percent oppose one within three miles of home. Researchers counted 533 U.S. data-center building permits, 387 of them delayed, canceled or under review. The flashpoint, they said, was water — especially after a hyperscale proposal on the shores of the shrinking Great Salt Lake — and the feeling of being locked out of the decision.
That is a political story. It is not, on the official books, a jobs story. Statewide employment in computing infrastructure, data processing, web hosting and related services — a Bureau of Labor Statistics industry that also covers internet access and search, not just AI halls — was 7,600 in August 2026, not seasonally adjusted. Utah’s seasonally adjusted nonfarm payroll was 1.79 million. The entire data-processing industry was 0.42 percent of it. Construction, by contrast, employed 146,000 people that month, more than eight percent of the state’s payroll. If Mona is the front line of America’s AI backlash, the operators themselves are still a rounding error on the employment report.
Utah’s data-processing payroll never became a boom

View exact chart values
| period | jobs_thousands |
|---|---|
| 2018-01 | 7.6 |
| 2018-02 | 7.6 |
| 2018-03 | 7.7 |
| 2018-04 | 7.5 |
| 2018-05 | 7.6 |
| 2018-06 | 7.7 |
| 2018-07 | 8.1 |
| 2018-08 | 8.4 |
| 2018-09 | 8.2 |
| 2018-10 | 8.2 |
| 2018-11 | 8.3 |
| 2018-12 | 8.3 |
| 2019-01 | 8.4 |
| 2019-02 | 8.5 |
| 2019-03 | 8.5 |
| 2019-04 | 8.5 |
| 2019-05 | 8.6 |
| 2019-06 | 8.6 |
| 2019-07 | 8.7 |
| 2019-08 | 8.6 |
| 2019-09 | 8.5 |
| 2019-10 | 8.6 |
| 2019-11 | 8.7 |
| 2019-12 | 8.7 |
| 2020-01 | 8.7 |
| 2020-02 | 8.7 |
| 2020-03 | 8.8 |
| 2020-04 | 8.8 |
| 2020-05 | 8.8 |
| 2020-06 | 8.8 |
| 2020-07 | 8.8 |
| 2020-08 | 8.8 |
| 2020-09 | 8.7 |
| 2020-10 | 8.8 |
| 2020-11 | 8.8 |
| 2020-12 | 8.9 |
| 2021-01 | 8.8 |
| 2021-02 | 8.8 |
| 2021-03 | 8.9 |
| 2021-04 | 8.8 |
| 2021-05 | 8.9 |
| 2021-06 | 8.9 |
| 2021-07 | 8.9 |
| 2021-08 | 8.8 |
| 2021-09 | 8.9 |
| 2021-10 | 9 |
| 2021-11 | 9.1 |
| 2021-12 | 9.2 |
| 2022-01 | 9 |
| 2022-02 | 9.2 |
| 2022-03 | 9.2 |
| 2022-04 | 9.2 |
| 2022-05 | 9.2 |
| 2022-06 | 9.3 |
| 2022-07 | 9.3 |
| 2022-08 | 9.2 |
| 2022-09 | 9.2 |
| 2022-10 | 9.2 |
| 2022-11 | 9.1 |
| 2022-12 | 9.1 |
| 2023-01 | 8.8 |
| 2023-02 | 8.7 |
| 2023-03 | 8.7 |
| 2023-04 | 8.6 |
| 2023-05 | 8.6 |
| 2023-06 | 8.6 |
| 2023-07 | 8.6 |
| 2023-08 | 8.6 |
| 2023-09 | 8.4 |
| 2023-10 | 8.5 |
| 2023-11 | 8.4 |
| 2023-12 | 8.5 |
| 2024-01 | 8.3 |
| 2024-02 | 8.4 |
| 2024-03 | 8.4 |
| 2024-04 | 8.4 |
| 2024-05 | 8.3 |
| 2024-06 | 8.4 |
| 2024-07 | 8.6 |
| 2024-08 | 8.6 |
| 2024-09 | 8.7 |
| 2024-10 | 8.6 |
| 2024-11 | 8.6 |
| 2024-12 | 8.6 |
| 2025-01 | 8.4 |
| 2025-02 | 8.4 |
| 2025-03 | 8.3 |
| 2025-04 | 8.2 |
| 2025-05 | 8.2 |
| 2025-06 | 8.1 |
| 2025-07 | 8.2 |
| 2025-08 | 8.1 |
| 2025-09 | 8 |
| 2025-10 | 7.9 |
| 2025-11 | 7.9 |
| 2025-12 | 7.7 |
| 2026-01 | 7.7 |
| 2026-02 | 7.7 |
| 2026-03 | 7.9 |
| 2026-04 | 7.8 |
| 2026-05 | 7.8 |
| 2026-06 | 7.8 |
| 2026-07 | 7.8 |
| 2026-08 | 7.6 |
The operator payroll peaked, then slipped back toward 2010
Annual averages make the same point without a single noisy month. Utah’s data-processing industry employed 7,600 people in 2010. It drifted, peaked at 9,200 in 2022, then fell to 8,100 in 2025. August 2026, at 7,600, was back where the decade started. Indexed to 2010, that payroll was 107 in 2025. Construction, using seasonally adjusted monthly averages, was at 217. Utilities jobs, a much smaller series, dipped through the 2010s and only recently turned up, to 5,000 in 2025 from 4,100 in 2010.
That pattern matters because data-center developers sell construction-period hiring and a handful of permanent technicians. The construction boom is real: 66,500 seasonally adjusted construction jobs in January 2010, 146,000 in August 2026. The permanent operator boom is not visible in the industry that would have to show it. None of this proves Mona’s proposed campus would add zero jobs. It does show that whatever hyperscale building Utah has already absorbed has not shown up as a large, lasting data-processing workforce.
Construction payrolls doubled. Data-center operators did not.

View exact chart values
| year | dataproc_index | utilities_index | construction_index |
|---|---|---|---|
| 2010 | 100 | 100 | 100 |
| 2011 | 101.3 | 97.6 | 100.5 |
| 2012 | 106.6 | 97.6 | 106.2 |
| 2013 | 109.2 | 95.1 | 112.8 |
| 2014 | 103.9 | 95.1 | 120.3 |
| 2015 | 101.3 | 95.1 | 129.7 |
| 2016 | 105.3 | 95.1 | 140.2 |
| 2017 | 105.3 | 95.1 | 149.4 |
| 2018 | 103.9 | 95.1 | 159.5 |
| 2019 | 113.2 | 92.7 | 167.6 |
| 2020 | 115.8 | 90.2 | 176.7 |
| 2021 | 117.1 | 87.8 | 187.4 |
| 2022 | 121.1 | 87.8 | 200.8 |
| 2023 | 113.2 | 95.1 | 205.7 |
| 2024 | 111.8 | 107.3 | 212.4 |
| 2025 | 106.6 | 122 | 216.9 |
On the GDP books, servers out-earn farms and still trail the hard hats
Output tells a richer story than headcount, because data centers are capital-intensive. In 2025, Utah’s current-dollar GDP in data processing, hosting and other information services was $4.73 billion, according to the Bureau of Economic Analysis. That was 1.48 percent of the state’s $319.2 billion economy — three times 2010’s $1.56 billion in the same industry, and 3.3 times the $1.43 billion booked by farms. Construction, at $25.0 billion, was still more than five times the data-processing line. Utilities, at $7.33 billion, had grown even faster than hosting, from $1.58 billion in 2010.
So the industry Utahns are fighting is no longer a rounding error on output, even if it remains one on the payroll. It is also not the thing holding up the state’s GDP. Construction’s share of Utah output rose from 4.4 percent in 2010 to 7.8 percent in 2025. Data processing’s share went from 1.3 percent to 1.5 percent. Farms stayed under half a percent. If the argument is that hyperscale campuses will replace the ranch economy, the books already show hosting larger than farms — and still a sliver next to the hard hats pouring slabs for houses, highways and, yes, server halls.
On Utah’s books, construction still dwarfs the server halls

View exact chart values
| industry | gdp_billions |
|---|---|
| Data processing and hosting | 4.73 |
| Utilities | 7.33 |
| Farms | 1.43 |
| Construction | 24.99 |
The household power bill is not the crisis Mona is describing
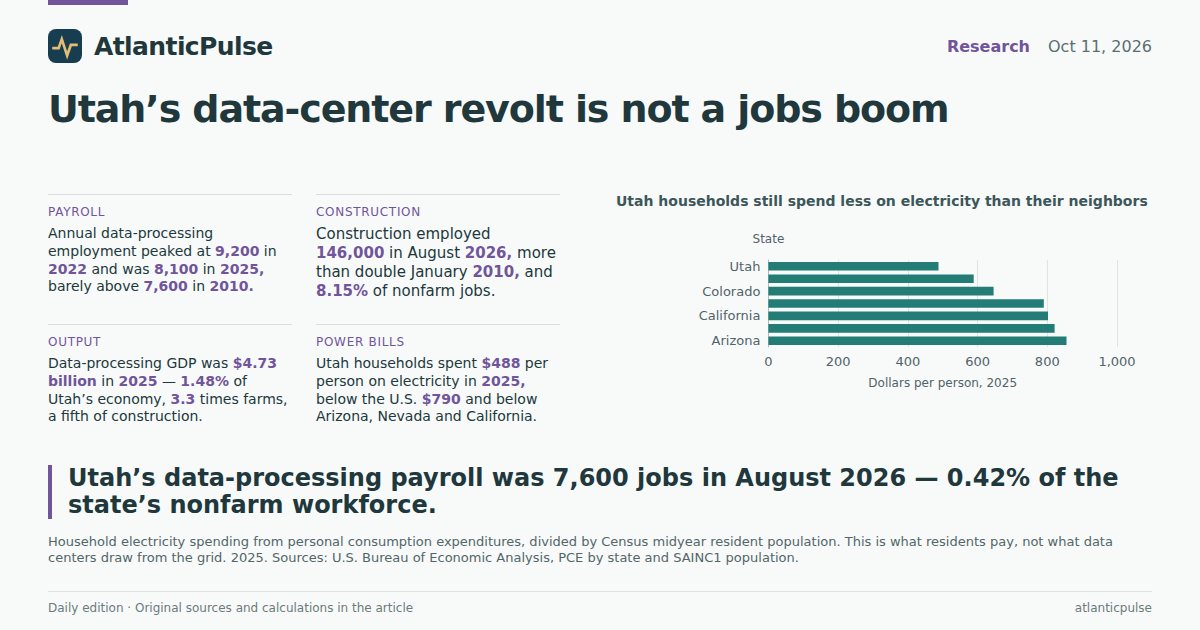
Utah’s opposition, though, is not mainly about GDP shares. It is about water in a desert state that has spent years telling households to cut back. Household spending is the wrong meter for a hyperscale campus — data centers buy industrial power and water, not the residential rate — but it is the bill voters actually see. In 2025, Utah households spent $1.73 billion on electricity, or $488 per person, using BEA consumption divided by Census midyear population. The U.S. figure was $790. Arizona was $855, Nevada $821, California $802. Idaho, another dry neighbor, was $589. Utah was the cheapest of that set.
Water supply and sanitation looks similar. Utah households spent $1.35 billion, or $380 per person, in 2025. The national figure was $409. Arizona was $457, Colorado $454, Nevada $417, Idaho $387. Utah was again at the low end. Those lines have risen: Utah’s electricity spending per person was $306 in 2010 and $488 in 2025; water went from $233 to $380. They have not caught the U.S. averages. A Great Salt Lake campus that used tens of millions of gallons would still be a political problem in a drought. It would not be a problem that is already showing up as America’s most expensive household water bill.
Utah households still spend less on electricity than their neighbors

View exact chart values
| state | dollars_per_person | pce_millions | population |
|---|---|---|---|
| Arizona | 855 | 6518.4 | 7623818 |
| Nevada | 821 | 2693.9 | 3282188 |
| California | 802 | 31572.7 | 39355309 |
| United States | 790 | 269937.8 | 341784857 |
| Colorado | 646 | 3886.8 | 6012561 |
| Idaho | 589 | 1194.6 | 2029733 |
| Utah | 488 | 1727.4 | 3538904 |
The household water and power bills rose. They did not catch the U.S. average.

View exact chart values
| year | elec_pc | water_pc | us_elec_pc | us_water_pc |
|---|---|---|---|---|
| 2010 | 306 | 233 | 539 | 254 |
| 2011 | 303 | 219 | 535 | 261 |
| 2012 | 325 | 232 | 519 | 269 |
| 2013 | 345 | 241 | 534 | 276 |
| 2014 | 341 | 245 | 552 | 284 |
| 2015 | 339 | 245 | 552 | 284 |
| 2016 | 344 | 243 | 546 | 293 |
| 2017 | 347 | 264 | 544 | 309 |
| 2018 | 350 | 277 | 580 | 322 |
| 2019 | 335 | 288 | 567 | 333 |
| 2020 | 360 | 306 | 578 | 343 |
| 2021 | 367 | 298 | 604 | 356 |
| 2022 | 419 | 323 | 697 | 370 |
| 2023 | 417 | 343 | 703 | 384 |
| 2024 | 455 | 358 | 742 | 396 |
| 2025 | 488 | 380 | 790 | 409 |
What the numbers cannot settle
Two caveats do most of the honest work. First, the employment and GDP industries are broader than a single AI campus. Internet access, search and ordinary hosting live in the same lines as a 3-million-square-foot hall in Juab County. A small statewide payroll can hide a very large building. Second, household electricity and water spending are not industrial withdrawals. Developers argue that closed-loop cooling uses little water after the first fill; residents point at 80 million gallons a year at one West Valley facility. Official consumption accounts cannot referee that fight.
What they can do is strip out the campaign adjectives. Utah is not hosting a data-processing jobs boom. It is hosting a construction boom, a utilities industry that has grown faster in dollars than in people, and a household utility bill that is still cheaper than the neighbors’. Mona’s complaint is about process and about water in a basin that cannot spare it. Those are fair fights. They are not the same fight as “the servers already ate the payroll.”
Sources and methods
This is a retrospective reading of sealed official snapshots, not current-day observation. BLS State and Area Employment uses the August 24, 2026 public bulk files (2025 benchmark year). BEA GDP by state and SAINC1 population use the September 30, 2026 regional annual release, with 2025 as the latest full year. BEA personal consumption expenditures by state use the September 30, 2026 SAPCE release, also through 2025.
Data-processing employment is BLS industry 50518000, not seasonally adjusted, statewide. It includes computing infrastructure, data processing, web hosting and related services — broader than hyperscale AI campuses. Construction employment is seasonally adjusted. Utilities employment is not seasonally adjusted annual averages. Do not mix those seasonal treatments as if they were the same series.
GDP figures are current dollars, not chained. Shares are of all-industry state GDP. Farms are crop and animal production (NAICS 111–112), not the broader agriculture, forestry, fishing and hunting sector. Data processing GDP is NAICS 518–519, which includes internet access and search as well as hosting.
Per-person electricity and water figures divide BEA household consumption (millions of current dollars) by SAINC1 Census midyear resident population. They are not industrial power or water use, not household averages from a survey of bills, and not inflation-adjusted. Missing observations were not treated as zero. No causal effect is inferred from the descriptive comparisons.
Research completed 2026-10-12, for the October 11, 2026 news edition. The available source data may cover earlier periods; see the observation periods and source vintages above.