Research
Twelve billion dollars, on a local payroll that already thinned
The $12 billion is not a rounding error on civic Florida
Florida’s Amendment 3 asks voters to do two things at once: make primary homes cheaper to keep, and accept a thinner local tax base to pay for the services those homes still use. The mechanics, as today’s reporting lays them out, are blunt. If the measure wins a 60 percent supermajority, the homestead exemption for non-school local taxes would rise to $150,000 in 2027 and $250,000 in 2028, and the annual assessment cap on non-homestead property would fall from 10 percent to 5 percent. Estimates put the recurring revenue loss at about $12 billion, aimed at counties, cities and special districts — police, EMS, roads, parks — not school boards.
Twelve billion dollars is a campaign number, not a line in the national accounts. It is still large enough to measure against the official books. Florida’s local governments employed 737,500 people in August 2026, seasonally adjusted, according to the Bureau of Labor Statistics. That is 7.3 percent of the state’s 10.05 million nonfarm jobs. The Bureau of Economic Analysis put local-government compensation at $68.9 billion in 2025 and state-and-local government output at $102.6 billion. A $12 billion hole is about 17 percent of that local pay packet and about 12 percent of state-and-local GDP. It is also larger than what Florida households spent on water and sanitation that year. Those comparisons do not prove jobs would vanish. They do show the amendment is sized for the civic machine, not for the housing market’s rounding error.
Twelve billion dollars sits above Florida’s water bill and below local pay

View exact chart values
| item | billions |
|---|---|
| Household water and sanitation, 2025 | 9.6 |
| Reported Amendment 3 revenue hole | 12 |
| Local-government compensation, 2025 | 68.9 |
| State-and-local government GDP, 2025 | 102.6 |
The workforce those taxes support has not grown with the state
The more awkward fact is what that workforce has already done. Florida’s seasonally adjusted local-government payroll in August 2026 was only 4.8 percent above August 2015. Total nonfarm employment rose 23.3 percent over the same stretch. Midyear resident population rose 16.5 percent from 2015 to 2025, to 23.46 million. Index the two series to 2015 and the gap is hard to miss: people kept arriving; the local payroll did not keep pace.
Go back further and the stall looks older than the pandemic. Annual-average local-government employment in 2025, 732,700, was slightly below the 2005 average of 738,100. The August 2026 reading is only 0.8 percent above January 2005. In those two decades Florida added about 5.6 million residents, a 31.5 percent increase. Local-government jobs per 1,000 residents fell from about 41 in 2005 to about 31 in 2025. That is not a one-year dip. It is a long thinning of the payroll that collects garbage, staffs 911 centers and patches roads — the same functions Amendment 3 would still expect counties to fund, with a smaller property-tax base.
Florida’s local-government payroll has not kept up with the people

View exact chart values
| year | local_jobs_index | population_index |
|---|---|---|
| 2015 | 100 | 100 |
| 2016 | 101 | 102 |
| 2017 | 101.4 | 103.6 |
| 2018 | 102.3 | 104.9 |
| 2019 | 103.2 | 106 |
| 2020 | 100.8 | 107.2 |
| 2021 | 100 | 108.4 |
| 2022 | 100.7 | 111.3 |
| 2023 | 103.4 | 113.8 |
| 2024 | 105.3 | 115.5 |
| 2025 | 104.4 | 116.5 |
| 2026 | 104.7 | — |
Among large states, Florida already staffs local government the least
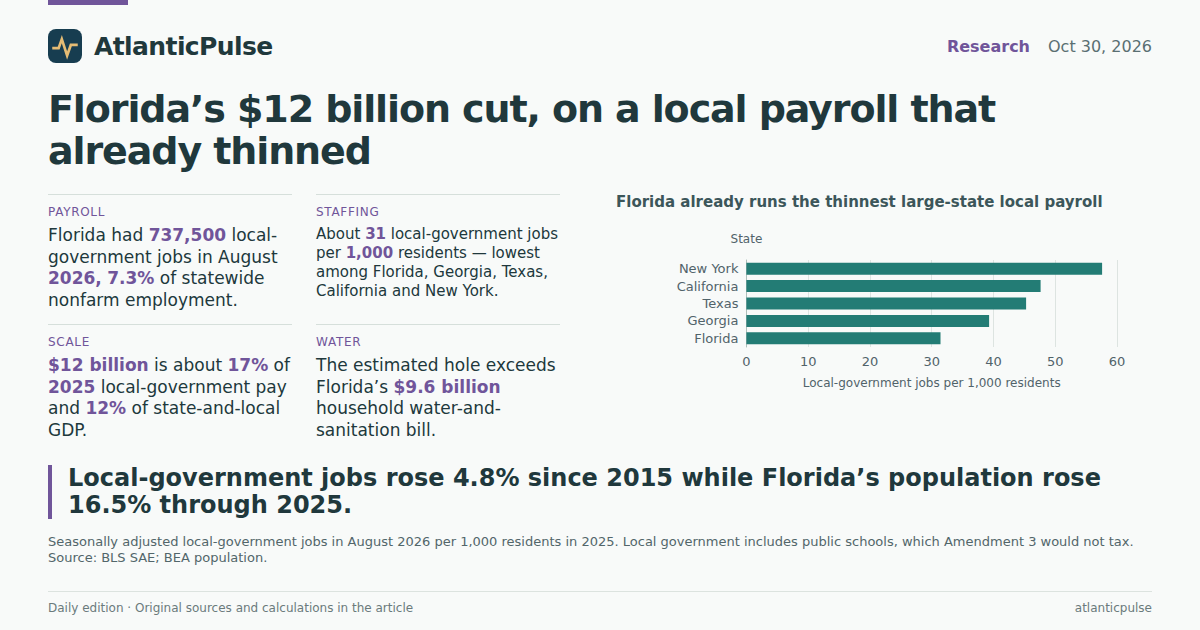
Compare Florida with other big states and the thinness is not a mirage of the 2010s housing bust. In August 2026 Florida had 31.4 local-government jobs per 1,000 residents (using 2025 population, the latest annual count). Georgia had 39.3, Texas 45.3, California 47.6 and New York 57.6. Mix an August 2026 jobs print with a 2025 population figure and you get a small vintage mismatch; it does not move Florida off the bottom of that list.
Other states also failed to match population with local hiring, but they started higher and added more. From August 2015 to August 2026, Texas local-government employment rose 10.6 percent while population rose 15.8 percent. Georgia’s local payroll rose 8.4 percent against 10.9 percent population growth. California added 8.8 percent more local jobs with almost no population gain. Florida added 4.8 percent more local jobs against 16.5 percent more people. New York’s local payroll rose 4.5 percent while population slipped. If Amendment 3 is a bet that local government can absorb a smaller tax base, it is a bet placed on the large state that already employs the fewest local workers relative to its population.
Florida already runs the thinnest large-state local payroll

View exact chart values
| state | local_jobs_thousands | population_2025 | jobs_per_1000 |
|---|---|---|---|
| Florida | 737.5 | 23462518 | 31.43 |
| Georgia | 444.2 | 11302748 | 39.3 |
| Texas | 1435.8 | 31709821 | 45.28 |
| California | 1874.4 | 39355309 | 47.63 |
| New York | 1152 | 20002427 | 57.59 |
Other big states added local jobs faster than Florida

View exact chart values
| year | florida | texas | california | new_york | georgia |
|---|---|---|---|---|---|
| 2015 | 100 | 100 | 100 | 100 | 100 |
| 2016 | 101 | 101.8 | 102.1 | 100.3 | 100.9 |
| 2017 | 101.1 | 102.3 | 102.6 | 100.7 | 101.2 |
| 2018 | 102 | 103.4 | 104 | 101.3 | 102 |
| 2019 | 102.9 | 104 | 105.1 | 101.1 | 102.4 |
| 2020 | 96.7 | 102.2 | 96.3 | 90.3 | 99.2 |
| 2021 | 99.7 | 102.9 | 99.3 | 96 | 99.8 |
| 2022 | 100.7 | 105 | 102 | 98.8 | 101.1 |
| 2023 | 103.4 | 108.1 | 104.8 | 99.1 | 104.7 |
| 2024 | 105.7 | 110.5 | 106.8 | 101 | 107.1 |
| 2025 | 104.2 | 110.6 | 107.8 | 103.4 | 107.3 |
| 2026 | 104.8 | 110.6 | 108.8 | 104.5 | 108.4 |
The amendment misses schools. That is only half the local payroll.
The political brochure has a true sentence in it: Amendment 3 is written as a non-school tax cut. Public-school employment is the other half of local government, and it would not take the direct hit. In March 2026, a school-year month, Florida local education employment (not seasonally adjusted) was 349,100, down 5.8 percent from March 2019. Local government excluding education was 398,900, up 8.9 percent. Non-education jobs were 53 percent of that in-session local total. State government, a different treasury, employed 254,400 in August 2026, seasonally adjusted.
So the $12 billion lands on the half of local government that is not a classroom — sheriffs, firefighters, public works, parks, transit, libraries, clinics. That non-education local payroll is the piece that grew after 2019, and it is still small next to the population boom. A revenue cut of $12 billion is about $511 for every Florida resident in 2025. Relative to household water and sanitation spending of $9.6 billion in 2025, the estimated hole is larger than the entire water bill. Relative to local-government compensation, it is a one-sixth slice of the pay packet, including the school employees the amendment claims to spare. None of that is a forecast of layoffs. It is the scale of the bet.
The housing bill Amendment 3 is trying to shrink is already the country’s fattest
Proponents are not inventing the squeeze. In 2025 Florida households spent $14,278 per person on housing and utilities, according to BEA state consumer accounts — 28 percent above the U.S. average of $11,159, and above California’s $13,333. Texas, the other no-income-tax magnet, spent $10,353. Housing and utilities were 21.6 percent of Florida’s $66,061 in per-person consumption. The housing line in those accounts is mostly tenant rent and an imputed rent for owner-occupied homes. It is not the property-tax bill Amendment 3 would cut. The direction is still the same: shelter is the expensive part of living in Florida, and it has pulled away from the national average since 2020.
That is why a $12 billion property-tax cut can look small next to $304 billion in housing consumption and enormous next to the agencies that pick up the trash. The two comparisons are both true. Amendment 3 would not rewrite the imputed-rent account. It would rewrite the millage math for the governments that already employ fewer people, relative to population, than they did a decade ago. Voters can decide that homeowners have been taxed out of their own boom. The official books say the civic payroll did not share in that boom. A thinner tax base on a thinner workforce is the choice, not a side effect someone forgot to model.
Florida’s housing-and-utilities bill already outruns the country

View exact chart values
| year | florida | united_states | texas | california |
|---|---|---|---|---|
| 2010 | 7407 | 6296 | 5657 | 7264 |
| 2011 | 7462 | 6360 | 5733 | 7281 |
| 2012 | 7477 | 6409 | 5699 | 7365 |
| 2013 | 7538 | 6585 | 5889 | 7542 |
| 2014 | 7676 | 6722 | 6109 | 7698 |
| 2015 | 7861 | 6824 | 6252 | 7836 |
| 2016 | 8025 | 6996 | 6419 | 8123 |
| 2017 | 8255 | 7196 | 6531 | 8490 |
| 2018 | 8566 | 7486 | 6775 | 8878 |
| 2019 | 8938 | 7758 | 7064 | 9306 |
| 2020 | 9533 | 8106 | 7408 | 9836 |
| 2021 | 9911 | 8560 | 7855 | 10482 |
| 2022 | 11104 | 9325 | 8710 | 11308 |
| 2023 | 12401 | 10017 | 9363 | 12195 |
| 2024 | 13153 | 10585 | 9781 | 12760 |
| 2025 | 14278 | 11159 | 10353 | 13333 |
Sources and methods
BLS State and Area Employment figures are statewide payroll jobs, not full-time-equivalent counts or budgeted positions. Seasonally adjusted series are used for Florida local government, state government, total nonfarm and the five-state August comparison. Local education and local government excluding education are available only not seasonally adjusted; March is used as an in-session school-year month. Those NSA splits are not mixed into the seasonally adjusted totals.
Jobs-per-1,000 ratios divide August 2026 seasonally adjusted local-government employment by 2025 midyear resident population, the latest annual BEA/Census figure. That mixes a 2026 jobs month with a 2025 population year. Annual-average local jobs per 1,000 using matched years show the same thinning (about 41 in 2005, 31 in 2025).
The $12 billion Amendment 3 figure is a reporting estimate of recurring local (non-school) revenue loss, not a BEA or Census tax collection. It is compared with 2025 current-dollar BEA series: local-government compensation (includes public schools), state-and-local government GDP (output, not tax receipts), household housing PCE (mostly imputed rent, not property tax) and water-and-sanitation PCE. Those are scale checks, not causal estimates of job or service cuts.
BEA population is Census midyear resident population. Personal income, GDP and compensation are annual calendar-year flows. PCE per capita is spending divided by resident population. Observation vintages follow the pinned snapshots: BLS SAE through August 2026 (release snapshot 2026-08-24) and BEA annual accounts through 2025 (regional release 2026-09-30). Provider lag is normal; these are not same-day 2026-10-30 observations.
Where duplicate SAE series existed in metadata, the calculation used the documented seasonally adjusted statewide local-government series (BLS SMS12000009093000001 and peers) and the NSA education/excluding-education pair. Nulls were not treated as zeros. No row was counted twice.
Research completed 2026-10-31, for the October 30, 2026 news edition. The available source data may cover earlier periods; see the observation periods and source vintages above.