Research
The White House fight is over a news payroll that already shrank
Three outlets, and a much smaller industry
The legal fight that ran through Thursday was about hard passes, due process and whether a president may lock three newsrooms out of the White House because he dislikes the coverage. A Trump-appointed judge said the ban on CNN, MS NOW and Politico was likely unlawful, then spent hours watching the Secret Service still turn reporters away. That is a First Amendment story. It is also an industry story, and the industry on the official books is already a sliver of the labour market it once was.
The Current Employment Statistics survey does not count bylines. It counts payroll jobs at establishments. Newspaper publishers, television broadcasting stations and radio broadcasting stations are three separate NAICS industries. They are not a complete census of American journalism: digital-only newsrooms, many cable and network news workers, freelancers and Politico-style web operations often sit in other codes. They are still the closest official payrolls for the businesses a White House press fight is about. In June 2026, the latest month those series share, newspaper publishers employed 74,900 seasonally adjusted jobs. Television stations employed 59,800. Radio stations employed 47,700. Together that is 182,400 jobs — about 0.12% of U.S. nonfarm payrolls.
Newspapers fell off the table. Stations declined more slowly.
Newspaper publisher employment has been in a long, almost uninterrupted slide. The seasonally adjusted series peaked at 458,400 jobs in June 1990. By January 2007, before the financial crisis, it was already down to 354,500. By December 2019 it was 131,700. In January 2025, as the second Trump term began, it was 87,700. June 2026’s 74,900 is 84% below the 1990 peak and 79% below January 2007. The annual average for 2025 was 83,400 jobs, so the 2026 monthly figures are still falling, not bouncing.
Television stations never had a newspaper-scale collapse, and they never had a newspaper-scale payroll. They peaked at 75,000 jobs in December 2000, drifted, then lost ground after 2019: 73,000 in December 2019, 59,800 in June 2026, an 18% drop from that pre-pandemic month and 14% below January 2007. Radio stations peaked way back in February 1990 at 93,200 and were 47,700 in June 2026, 45% below January 2007. Add the three and the “traditional” station-plus-newspaper total is 70% below January 1990 and 64% below January 2007. That is the workforce a president can try to freeze out of the briefing room: smaller every year, and not because of one Truth Social post.
Newspaper, TV and radio station jobs, 1990–2025

View exact chart values
| year | newspapers | tv_stations | radio_stations | broadcast_content | information | software | traditional_news |
|---|---|---|---|---|---|---|---|
| 1990 | 456.2 | 62.2 | 92.7 | 299.5 | 2688 | 98.2 | 611.1 |
| 1991 | 441.3 | 61.6 | 90.9 | 297 | 2677.4 | 108.3 | 593.8 |
| 1992 | 433.9 | 62.2 | 88.2 | 295.6 | 2641.2 | 113.7 | 584.3 |
| 1993 | 433.3 | 63 | 88.5 | 299.6 | 2667.8 | 125.8 | 584.8 |
| 1994 | 431 | 64.4 | 88.6 | 306.5 | 2739 | 136.8 | 584 |
| 1995 | 430.2 | 66.6 | 88.2 | 316.8 | 2843.9 | 157.2 | 585 |
| 1996 | 424.1 | 69.2 | 88.4 | 330.1 | 2940 | 175 | 581.7 |
| 1997 | 424.3 | 70.1 | 88.9 | 336.5 | 3083.1 | 195.3 | 583.3 |
| 1998 | 426.3 | 71.2 | 90.3 | 348.1 | 3218.4 | 214.8 | 587.8 |
| 1999 | 425.8 | 72.1 | 90.8 | 365.8 | 3418.3 | 234.8 | 588.7 |
| 2000 | 424.3 | 74.4 | 91.5 | 392.3 | 3630.4 | 260.6 | 590.2 |
| 2001 | 408.3 | 73.5 | 89.8 | 389.4 | 3629 | 269 | 571.6 |
| 2002 | 390.1 | 71.1 | 87.1 | 370.2 | 3394.4 | 253.4 | 548.3 |
| 2003 | 382.5 | 69.8 | 86.8 | 357.2 | 3188.3 | 238.9 | 539.1 |
| 2004 | 376.7 | 69.9 | 87.5 | 357.9 | 3117.4 | 235.8 | 534.1 |
| 2005 | 371.1 | 69.7 | 87.3 | 361 | 3060.9 | 237.9 | 528.1 |
| 2006 | 360.9 | 69.2 | 87.6 | 362.5 | 3038.2 | 243.9 | 517.7 |
| 2007 | 348 | 69 | 86.5 | 361 | 3031.8 | 255.2 | 503.5 |
| 2008 | 325.5 | 68.7 | 84.2 | 357.3 | 2983.5 | 263.5 | 478.4 |
| 2009 | 278 | 64.7 | 76 | 340.1 | 2803.5 | 257.8 | 418.7 |
| 2010 | 255.1 | 64.1 | 72.7 | 332.9 | 2707.1 | 261 | 391.9 |
| 2011 | 242.6 | 63.9 | 72.7 | 332.4 | 2672.9 | 271.5 | 379.2 |
| 2012 | 226.9 | 66 | 71.3 | 340.2 | 2674.9 | 287.1 | 364.2 |
| 2013 | 215.6 | 67.9 | 70.8 | 345.4 | 2704.8 | 299.5 | 354.3 |
| 2014 | 204.8 | 71.2 | 70.4 | 352.7 | 2726.5 | 315.5 | 346.4 |
| 2015 | 193.8 | 71.3 | 68.2 | 354.7 | 2750 | 334.5 | 333.3 |
| 2016 | 179.9 | 72 | 66.7 | 356.1 | 2793.8 | 358.7 | 318.6 |
| 2017 | 165 | 72.1 | 65.3 | 361.5 | 2812.2 | 381.4 | 302.4 |
| 2018 | 149.6 | 73.2 | 64.5 | 371.2 | 2837.4 | 416.2 | 287.3 |
| 2019 | 136.2 | 72.5 | 63.9 | 378.5 | 2863.8 | 465.8 | 272.6 |
| 2020 | 116.5 | 69.1 | 56.8 | 365.8 | 2719.7 | 504.5 | 242.4 |
| 2021 | 108.3 | 67.6 | 53 | 359.3 | 2856.7 | 559.4 | 228.9 |
| 2022 | 102.9 | 66.1 | 53.2 | 355.1 | 3062.7 | 640.1 | 222.2 |
| 2023 | 95.7 | 67.5 | 52.8 | 347.9 | 3007.4 | 653.1 | 216 |
| 2024 | 89.1 | 66.8 | 51.7 | 342.8 | 2922.3 | 644 | 207.6 |
| 2025 | 83.4 | 63.5 | 49.4 | 341.5 | 2861.2 | 654.3 | 196.3 |
Software ate the information supersector
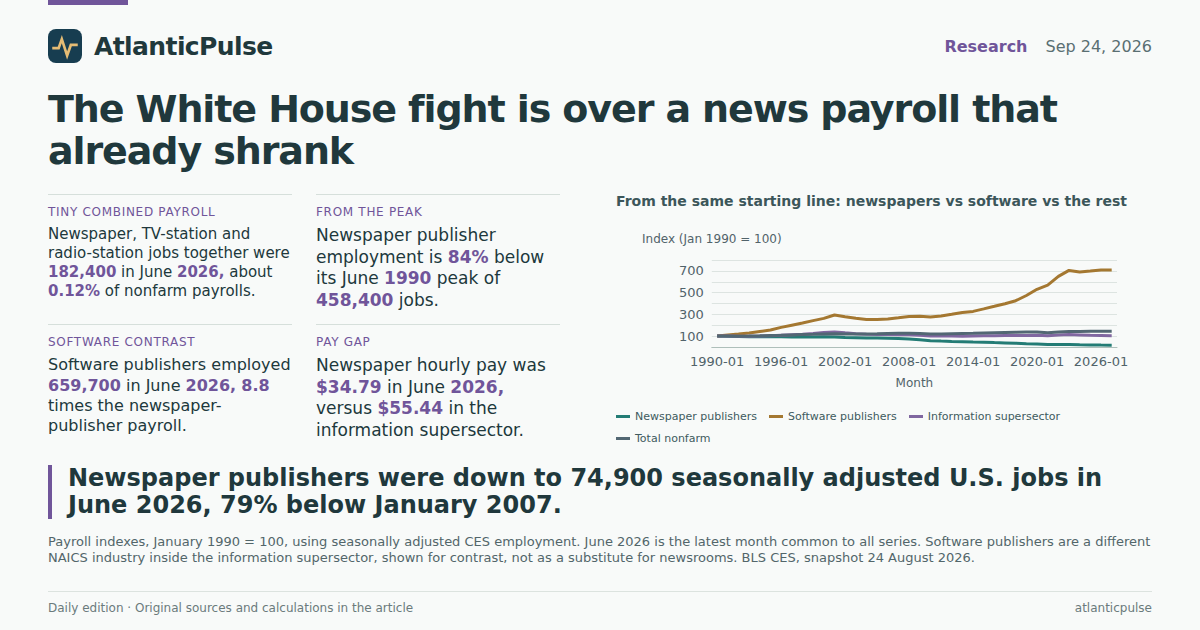
Zoom out to the information supersector — newspapers, broadcasting, software, telecoms, data processing, movies — and the picture is not a general collapse of “the media.” It is a substitution. Index January 1990 to 100 and newspaper publisher jobs sit at 16 in June 2026. Total nonfarm employment is at 145. The information supersector as a whole is only at 104, barely above where it started, because the losses in newsprint and some other old codes were offset elsewhere. Software publishers, a different NAICS industry inside the same supersector, are at 709 on that index.
In levels, software publishers employed 659,700 people in June 2026, 8.8 times the newspaper-publisher payroll and 164% above January 2007. They are not a stand-in for newsrooms, and they are not who got their hard passes pulled. They are the reminder that “information” on a BLS table is no longer a synonym for the press. Since December 2019, newspaper publisher jobs are down 43%; software publisher jobs are up 35%. Since January 2025 the newspaper line is down another 15%, while software is slightly up. The White House fight is happening after most of the shrinkage, not at the beginning of it.
From the same starting line: newspapers vs software vs the rest

View exact chart values
| period | newspapers_index | tv_index | radio_index | broadcast_index | information_index | software_index | nonfarm_index | newspapers_thousands | tv_thousands | radio_thousands | software_thousands | information_thousands |
|---|---|---|---|---|---|---|---|---|---|---|---|---|
| 1990-01 | 100 | 100 | 100 | 100 | 100 | 100 | 100 | 455.4 | 61.8 | 93.1 | 93.1 | 2671 |
| 1991-01 | 98.8 | 100.3 | 99.5 | 100.7 | 101 | 111.7 | 99.9 | 450 | 62 | 92.6 | 104 | 2697 |
| 1992-01 | 95.5 | 99.8 | 95.3 | 99.1 | 98.8 | 119.7 | 99.2 | 434.8 | 61.7 | 88.7 | 111.4 | 2638 |
| 1993-01 | 95 | 101.6 | 94.5 | 100 | 99.4 | 128.7 | 100.5 | 432.5 | 62.8 | 88 | 119.8 | 2655 |
| 1994-01 | 94.8 | 102.9 | 95.1 | 101.6 | 101.1 | 142.2 | 103.1 | 431.6 | 63.6 | 88.5 | 132.4 | 2700 |
| 1995-01 | 94.8 | 105.5 | 95 | 104.6 | 104.3 | 156.6 | 106.7 | 431.8 | 65.2 | 88.4 | 145.8 | 2785 |
| 1996-01 | 93.4 | 110.5 | 95 | 109.2 | 108.1 | 180.3 | 108.4 | 425.5 | 68.3 | 88.4 | 167.9 | 2888 |
| 1997-01 | 92.6 | 113.3 | 94.6 | 112.3 | 112.7 | 200.3 | 111.1 | 421.9 | 70 | 88.1 | 186.5 | 3009 |
| 1998-01 | 93.7 | 114.2 | 96.3 | 114.4 | 118.1 | 221.1 | 114.3 | 426.8 | 70.6 | 89.7 | 205.8 | 3155 |
| 1999-01 | 93.3 | 115.2 | 98 | 119.5 | 123.7 | 242.3 | 116.9 | 424.8 | 71.2 | 91.2 | 225.6 | 3303 |
| 2000-01 | 93.6 | 119.9 | 98.3 | 129 | 133 | 262.6 | 120 | 426.3 | 74.1 | 91.5 | 244.5 | 3552 |
| 2001-01 | 92.4 | 121.2 | 96.5 | 133.2 | 138.9 | 294.6 | 121.5 | 420.9 | 74.9 | 89.8 | 274.3 | 3711 |
| 2002-01 | 86.7 | 117.6 | 95 | 127.3 | 130.8 | 278.7 | 119.8 | 395 | 72.7 | 88.4 | 259.5 | 3495 |
| 2003-01 | 84.8 | 113.3 | 94.7 | 121.9 | 122.2 | 263.9 | 119.6 | 386.4 | 70 | 88.2 | 245.7 | 3264 |
| 2004-01 | 83.2 | 112.8 | 93 | 119.3 | 117.6 | 252.5 | 119.7 | 379 | 69.7 | 86.6 | 235.1 | 3141 |
| 2005-01 | 81.5 | 112.5 | 96.1 | 121.6 | 115 | 253.3 | 121.6 | 371.3 | 69.5 | 89.5 | 235.8 | 3071 |
| 2006-01 | 80.4 | 111.8 | 93.6 | 121.4 | 114.3 | 258.3 | 124 | 366.3 | 69.1 | 87.1 | 240.5 | 3054 |
| 2007-01 | 77.8 | 112.6 | 93.2 | 121.5 | 113.4 | 268.4 | 125.9 | 354.5 | 69.6 | 86.8 | 249.9 | 3030 |
| 2008-01 | 74.9 | 111.5 | 92.1 | 120.3 | 113.3 | 279.3 | 126.7 | 340.9 | 68.9 | 85.7 | 260 | 3026 |
| 2009-01 | 65.9 | 108.7 | 86.8 | 118.7 | 108.2 | 282.9 | 122.8 | 300.1 | 67.2 | 80.8 | 263.4 | 2891 |
| 2010-01 | 57.6 | 103.1 | 78.4 | 112.3 | 102.5 | 275.3 | 118.9 | 262.5 | 63.7 | 73 | 256.3 | 2739 |
| 2011-01 | 54.6 | 103.7 | 78.2 | 110.9 | 100.3 | 285.9 | 119.8 | 248.5 | 64.1 | 72.8 | 266.2 | 2678 |
| 2012-01 | 51.1 | 105.2 | 77.4 | 113.3 | 99.8 | 300.6 | 122 | 232.6 | 65 | 72.1 | 279.9 | 2665 |
| 2013-01 | 48.4 | 107.8 | 76.4 | 115.6 | 99.7 | 316.3 | 123.9 | 220.4 | 66.6 | 71.1 | 294.5 | 2662 |
| 2014-01 | 46.1 | 113.4 | 76 | 116.9 | 102 | 327.8 | 126 | 209.8 | 70.1 | 70.8 | 305.2 | 2724 |
| 2015-01 | 43.8 | 115.4 | 74.1 | 119.6 | 102.6 | 350.5 | 128.7 | 199.5 | 71.3 | 69 | 326.3 | 2740 |
| 2016-01 | 40.9 | 115.7 | 71.6 | 118.9 | 103.4 | 373.8 | 131.1 | 186.2 | 71.5 | 66.7 | 348 | 2762 |
| 2017-01 | 37.8 | 116.5 | 71.3 | 120.7 | 105.6 | 398.3 | 133.4 | 172 | 72 | 66.4 | 370.8 | 2821 |
| 2018-01 | 34.7 | 117.5 | 69.8 | 123.3 | 105.5 | 425.8 | 135.2 | 157.9 | 72.6 | 65 | 396.4 | 2817 |
| 2019-01 | 30.8 | 118.1 | 69 | 126.6 | 106.4 | 473.6 | 137.4 | 140.4 | 73 | 64.2 | 440.9 | 2842 |
| 2020-01 | 28.4 | 118.1 | 67.3 | 127.8 | 108.6 | 530.2 | 139.2 | 129.3 | 73 | 62.7 | 493.6 | 2901 |
| 2021-01 | 24.1 | 112.6 | 58.6 | 123.3 | 102.8 | 568.7 | 130.8 | 109.8 | 69.6 | 54.6 | 529.5 | 2747 |
| 2022-01 | 23.4 | 107.3 | 56.2 | 118.7 | 111.7 | 648.9 | 137.4 | 106.7 | 66.3 | 52.3 | 604.1 | 2984 |
| 2023-01 | 21.8 | 109.1 | 57.4 | 118.9 | 114.6 | 704.3 | 141.7 | 99.2 | 67.4 | 53.4 | 655.7 | 3061 |
| 2024-01 | 20.1 | 109.1 | 56.2 | 115.8 | 110.9 | 689.5 | 143.8 | 91.6 | 67.4 | 52.3 | 641.9 | 2963 |
| 2025-01 | 19.3 | 103.9 | 53.3 | 113.9 | 107.7 | 698.3 | 144.9 | 87.7 | 64.2 | 49.6 | 650.1 | 2877 |
| 2026-01 | 17.2 | 94.3 | 52.5 | 112.6 | 105.4 | 706.7 | 145.2 | 78.4 | 58.3 | 48.9 | 657.9 | 2815 |
| 2026-06 | 16.4 | 96.8 | 51.2 | 113.4 | 103.7 | 708.6 | 145.5 | 74.9 | 59.8 | 47.7 | 659.7 | 2769 |
Job change since January 2007

View exact chart values
| industry | pct_since_2007 | pct_since_2019 | pct_since_jan2025 | level_now_thousands | level_2007_thousands | level_2019_thousands |
|---|---|---|---|---|---|---|
| Newspaper publishers | -78.9 | -43.1 | -14.6 | 74.9 | 354.5 | 131.7 |
| Radio stations | -45 | -24.4 | -3.8 | 47.7 | 86.8 | 63.1 |
| Television stations | -14.1 | -18.1 | -6.9 | 59.8 | 69.6 | 73 |
| Information supersector | -8.6 | -4.2 | -3.8 | 2769 | 3030 | 2891 |
| Broadcasting and content | -6.7 | -11.3 | -0.4 | 337.3 | 361.4 | 380.4 |
| Software publishers | 164 | 35.1 | 1.5 | 659.7 | 249.9 | 488.3 |
What “information” still means on a payroll
In June 2026 the information supersector had 2.77 million jobs, 8.6% below January 2007 even as the whole nonfarm economy grew 16%. Newspaper publishers were 2.7% of that supersector. Broadcasting and content providers — a parent industry that includes radio and television stations plus cable and other content, and must not be added on top of the station totals — were 12%. Software publishers were 24%. The rest of information, 61%, is telecoms, data processing, motion pictures and the other codes that make “information” a poor nickname for journalism.
That composition is why a boom in AI and a bust in newsrooms can live on the same spreadsheet. It is also why restoring three hard passes, or taking them away, does not show up as a CES blip. The survey is a national establishment sample. It cannot see a White House driveway. It can tell you that the employers most associated with daily reporting already field fewer people than a single large software company.
What is left inside “information” jobs

View exact chart values
| category | thousands | share |
|---|---|---|
| Newspaper publishers | 74.9 | 2.7 |
| Broadcasting and content providers | 337.3 | 12.2 |
| Software publishers | 659.7 | 23.8 |
| Rest of information | 1697.1 | 61.3 |
The remaining news jobs are not the high-pay ones
Pay moved the other way from headcount, and not evenly. Average hourly earnings for all employees at newspaper publishers were $34.79 in June 2026. The information supersector paid $55.44. All private jobs paid $37.60. From March 2006, the first month these three earnings series share, newspaper pay is up 72% in current dollars, private pay 88%, information 107%. The gap between information and newspapers is now about $21 an hour. That is not an inflation-adjusted living-standards claim, and it is not a claim that White House reporters are poorly paid. It is a claim about the establishment average: the surviving newspaper payroll is smaller, and it has not kept up with the rest of “information.”
None of this measures the constitutional harm of a viewpoint-based lockout, and none of it says the ban caused the job losses. The losses were decades in the making. What the books say, as a judge orders CNN, MS NOW and Politico back through the gate, is simpler and colder. The official news-adjacent payroll is already tiny, still shrinking, and no longer what the information supersector is for.
Hourly pay: newspapers, information, and all private jobs

View exact chart values
| period | newspaper_ahe | information_ahe | private_ahe |
|---|---|---|---|
| 2007-01 | 20.81 | 27.95 | 20.59 |
| 2008-01 | 20.91 | 28.37 | 21.19 |
| 2009-01 | 21.15 | 28.82 | 21.96 |
| 2010-01 | 21.89 | 29.89 | 22.4 |
| 2011-01 | 22.15 | 31.49 | 22.87 |
| 2012-01 | 22.05 | 31.64 | 23.26 |
| 2013-01 | 22.43 | 32.47 | 23.74 |
| 2014-01 | 21.71 | 33.4 | 24.22 |
| 2015-01 | 21.99 | 34.53 | 24.74 |
| 2016-01 | 22.78 | 36.05 | 25.37 |
| 2017-01 | 23.04 | 37.54 | 26 |
| 2018-01 | 23.17 | 38.95 | 26.72 |
| 2019-01 | 22.73 | 41.71 | 27.59 |
| 2020-01 | 23.18 | 42.86 | 28.43 |
| 2021-01 | 24.36 | 44.38 | 29.93 |
| 2022-01 | 27.07 | 45.09 | 31.6 |
| 2023-01 | 29.64 | 47.75 | 33.02 |
| 2024-01 | 31.38 | 49.1 | 34.47 |
| 2025-01 | 33.24 | 51.56 | 35.84 |
| 2026-01 | 35.5 | 53.95 | 37.15 |
| 2026-06 | 34.79 | 55.44 | 37.6 |
Sources and methods
Payroll figures are seasonally adjusted all-employee counts from the U.S. Bureau of Labor Statistics Current Employment Statistics, national CES, using the catalogue snapshot dated 24 August 2026 (release identifier bls-ce-snapshot-2026-08-24). Observation dates are not release dates and are not current-day readings.
Newspaper publishers (CES5051311001), television broadcasting stations (CES5051612001), radio broadcasting stations (CES5051611001) and software publishers (CES5051320001) last share a month in June 2026 (438 monthly observations from January 1990). The information supersector and total nonfarm series have a July 2026 observation; those series were cut back to June 2026 so comparisons use a common month. Annual averages are shown only for calendar years with all 12 months, so 2026 does not appear in the annual table.
Employment is in thousands of jobs. Average hourly earnings are all-employee, seasonally adjusted, current dollars (newspaper CES5051311003, information CES5000000003, total private CES0500000003), from March 2006 through June 2026. No series in the extracts had null values or duplicate period keys; missing is not treated as zero.
Newspaper, radio-station and television-station jobs are distinct NAICS industries and are summed only as a labelled “traditional” total. Broadcasting and content providers (CES5051600001) is a parent that includes those stations plus cable and other content; it is never added to the station totals. CES establishment codes do not capture all journalists (digital-only newsrooms, many network/cable news jobs, freelancers). No causal effect is inferred from the White House access fight or from software-publisher growth.
Research completed 2026-09-25, for the September 24, 2026 news edition. The available source data may cover earlier periods; see the observation periods and source vintages above.