Research
The quiet border: what official encounter counts show while the immigration fight moves indoors
The immigration war moved indoors
Look at where this month's immigration stories actually happened. The State Department announced it has revoked more than 250,000 visas since January, up from about 175,000 in August, citing overstays, fraud, crime and national-security flags (Streamline Feed). The Supreme Court agreed to decide whether immigrants living in the United States can be jailed without a bond hearing while they fight deportation (Fortune). The family of Renee Good, shot by an ICE officer in Minneapolis in January, filed federal suits naming the officer, Stephen Miller and Kristi Noem (NBC News). And a second federal judge blocked the $100,000 fee on new H-1B visas (Reuters). Consulates, courtrooms, city streets: the border itself is almost never in the frame.
That is a striking reversal from two years ago, when monthly encounter totals at the southwest border were the single most cited number in American immigration politics. The border made the emergency; the emergency made the politics. So it is worth asking, with the fight now fought over visa files and detention beds: what do the official border counts actually show now? For the two nationalities that defined the 2023–24 surge — Venezuelans and Mexicans — the published CBP data give an unusually precise answer, and it is more lopsided than most of this month's coverage implies.
What the counts measure
The numbers below come from CBP's official border-encounters bulk files (release cbp-encounters-2026-07), monthly from October 2019 through July 2026, for the four southwest border states: Texas, Arizona, California and New Mexico. For each of two citizenships — Venezuela and Mexico — and two demographics — family-unit members (FMUA) and single adults — we summed the Title 8 series (Border Patrol apprehensions plus port-of-entry inadmissibles) across the four states. Where CBP publishes the same month in overlapping snapshot files, the latest file is used; the snapshots agreed everywhere they overlapped. CBP omits zero-count rows, so an absent state-month is treated as zero within sums. Two honest limits: Title 42 expulsions, which ended in May 2023, are excluded, so 2020-to-early-2023 totals are understated; and recent months are preliminary and revisable. This is a description of published counts — two nationalities, four states — not a national total, and nothing here argues cause.
The Venezuelan surge that ended
Start with the surge's signature nationality. Venezuelan citizens encountered under Title 8 across the four border states peaked at 65,860 in a single month — September 2023 — after climbing almost vertically for two years. The last month the combined total reached even 1,000 was January 2025 (11,510). Since then the line has effectively flatlined: 893 Venezuelans in total from January through July 2026, with May, June and July averaging 133 encounters a month. That is 0.2 percent of the peak month, and about 7 percent of the same three months a year earlier. Venezuelans did not slow down; they disappeared from the count.
The annual view is just as blunt. Calendar-year totals ran 104,677 (2021), 147,819 (2022), 335,590 (2023), 177,222 (2024), 13,331 (2025) and 893 through July of 2026. The bar that towered over every immigration fight of 2023–24 has been replaced by a sliver one-three-hundredth its size.
The collapse shows up in every border state, and its geography moved before it vanished. Texas — the epicenter — went from 25,444 Venezuelan family-unit members in September 2023 to 10 in July 2026. Arizona peaked earlier, 4,629 in December 2021, and recorded 5 this July. California and New Mexico, interestingly, peaked late — 2,204 and 95 in December 2024, when the San Diego corridor had become the main route — and stood at 0 and 1 this July. When a flow that once filled 25,000 rows in a Texas month is counted in single digits, the border story about that nationality is over, whatever the cable panels are still arguing about.
Venezuelans at the southwest border: the surge and the afterlife

View exact chart values
| month | ven_fmua | ven_sa | ven_total | mex_fmua | mex_sa | mex_total |
|---|---|---|---|---|---|---|
| 2019-10 | 454 | 265 | 719 | 3851 | 18138 | 21989 |
| 2019-11 | 397 | 185 | 582 | 4324 | 16634 | 20958 |
| 2019-12 | 511 | 180 | 691 | 4091 | 14739 | 18830 |
| 2020-01 | 173 | 66 | 239 | 3323 | 17179 | 20502 |
| 2020-02 | 149 | 52 | 201 | 2809 | 17825 | 20634 |
| 2020-03 | 113 | 50 | 163 | 1280 | 14258 | 15538 |
| 2020-04 | 5 | 2 | 7 | 25 | 768 | 793 |
| 2020-05 | 2 | 6 | 8 | 64 | 1436 | 1500 |
| 2020-06 | 9 | 4 | 13 | 86 | 1933 | 2019 |
| 2020-07 | 14 | 11 | 25 | 72 | 2306 | 2378 |
| 2020-08 | 17 | 13 | 30 | 98 | 2838 | 2936 |
| 2020-09 | 12 | 20 | 32 | 119 | 3243 | 3362 |
| 2020-10 | 66 | 31 | 97 | 103 | 2978 | 3081 |
| 2020-11 | 74 | 70 | 144 | 88 | 2969 | 3057 |
| 2020-12 | 104 | 75 | 179 | 119 | 2865 | 2984 |
| 2021-01 | 126 | 117 | 243 | 230 | 2841 | 3071 |
| 2021-02 | 426 | 407 | 833 | 373 | 2316 | 2689 |
| 2021-03 | 1169 | 1320 | 2489 | 830 | 2586 | 3416 |
| 2021-04 | 2571 | 3057 | 5628 | 1091 | 2908 | 3999 |
| 2021-05 | 3185 | 4034 | 7219 | 1864 | 3371 | 5235 |
| 2021-06 | 3306 | 4048 | 7354 | 2610 | 3338 | 5948 |
| 2021-07 | 2888 | 3118 | 6006 | 3388 | 3489 | 6877 |
| 2021-08 | 2868 | 3348 | 6216 | 3222 | 3108 | 6330 |
| 2021-09 | 5182 | 5499 | 10681 | 752 | 2962 | 3714 |
| 2021-10 | 6153 | 7089 | 13242 | 313 | 3045 | 3358 |
| 2021-11 | 9235 | 10932 | 20167 | 587 | 3832 | 4419 |
| 2021-12 | 11506 | 13093 | 24599 | 614 | 3567 | 4181 |
| 2022-01 | 9187 | 13367 | 22554 | 501 | 3960 | 4461 |
| 2022-02 | 1117 | 1907 | 3024 | 472 | 4514 | 4986 |
| 2022-03 | 1314 | 2704 | 4018 | 592 | 6739 | 7331 |
| 2022-04 | 1334 | 2731 | 4065 | 1471 | 7525 | 8996 |
| 2022-05 | 1618 | 3414 | 5032 | 2507 | 7391 | 9898 |
| 2022-06 | 3559 | 9513 | 13072 | 2060 | 6831 | 8891 |
| 2022-07 | 5333 | 12126 | 17459 | 2916 | 6560 | 9476 |
| 2022-08 | 7054 | 18098 | 25152 | 3693 | 6847 | 10540 |
| 2022-09 | 8751 | 24768 | 33519 | 3511 | 7273 | 10784 |
| 2022-10 | 5540 | 9751 | 15291 | 5306 | 5779 | 11085 |
| 2022-11 | 987 | 1021 | 2008 | 6516 | 6031 | 12547 |
| 2022-12 | 1658 | 967 | 2625 | 8145 | 11510 | 19655 |
| 2023-01 | 2897 | 3997 | 6894 | 7139 | 12582 | 19721 |
| 2023-02 | 1140 | 3113 | 4253 | 4681 | 7204 | 11885 |
| 2023-03 | 2184 | 3483 | 5667 | 7138 | 7139 | 14277 |
| 2023-04 | 12956 | 12017 | 24973 | 6195 | 6153 | 12348 |
| 2023-05 | 8427 | 18452 | 26879 | 10970 | 24515 | 35485 |
| 2023-06 | 9497 | 10650 | 20147 | 16373 | 30958 | 47331 |
| 2023-07 | 8948 | 9752 | 18700 | 21699 | 29822 | 51521 |
| 2023-08 | 15152 | 15842 | 30994 | 21048 | 31712 | 52760 |
| 2023-09 | 26379 | 39481 | 65860 | 22832 | 27906 | 50738 |
| 2023-10 | 17338 | 23040 | 40378 | 29655 | 30518 | 60173 |
| 2023-11 | 15446 | 18164 | 33610 | 31940 | 29608 | 61548 |
| 2023-12 | 22831 | 34404 | 57235 | 37285 | 28292 | 65577 |
| 2024-01 | 4126 | 7355 | 11481 | 26780 | 30349 | 57129 |
| 2024-02 | 3570 | 5092 | 8662 | 26591 | 33130 | 59721 |
| 2024-03 | 6845 | 9393 | 16238 | 26629 | 35898 | 62527 |
| 2024-04 | 7396 | 10718 | 18114 | 23084 | 33561 | 56645 |
| 2024-05 | 7158 | 9711 | 16869 | 27498 | 28969 | 56467 |
| 2024-06 | 5340 | 7026 | 12366 | 17791 | 22407 | 40198 |
| 2024-07 | 5292 | 7451 | 12743 | 11127 | 19771 | 30898 |
| 2024-08 | 6260 | 8769 | 15029 | 11696 | 23287 | 34983 |
| 2024-09 | 6367 | 8676 | 15043 | 10401 | 23171 | 33572 |
| 2024-10 | 6921 | 9273 | 16194 | 11135 | 22659 | 33794 |
| 2024-11 | 6734 | 8791 | 15525 | 9407 | 19623 | 29030 |
| 2024-12 | 8579 | 10379 | 18958 | 8067 | 15976 | 24043 |
| 2025-01 | 5193 | 6317 | 11510 | 4934 | 13645 | 18579 |
| 2025-02 | 40 | 82 | 122 | 416 | 6417 | 6833 |
| 2025-03 | 37 | 115 | 152 | 451 | 7374 | 7825 |
| 2025-04 | 35 | 129 | 164 | 602 | 8276 | 8878 |
| 2025-05 | 50 | 141 | 191 | 507 | 8468 | 8975 |
| 2025-06 | 33 | 105 | 138 | 506 | 6117 | 6623 |
| 2025-07 | 54 | 99 | 153 | 614 | 5086 | 5700 |
| 2025-08 | 27 | 160 | 187 | 759 | 6324 | 7083 |
| 2025-09 | 48 | 157 | 205 | 947 | 7262 | 8209 |
| 2025-10 | 52 | 146 | 198 | 719 | 7630 | 8349 |
| 2025-11 | 22 | 111 | 133 | 570 | 7214 | 7784 |
| 2025-12 | 26 | 152 | 178 | 565 | 6398 | 6963 |
| 2026-01 | 16 | 95 | 111 | 383 | 7015 | 7398 |
| 2026-02 | 8 | 96 | 104 | 327 | 6684 | 7011 |
| 2026-03 | 4 | 135 | 139 | 411 | 8488 | 8899 |
| 2026-04 | 15 | 125 | 140 | 425 | 9278 | 9703 |
| 2026-05 | 17 | 116 | 133 | 400 | 9159 | 9559 |
| 2026-06 | 12 | 112 | 124 | 330 | 8403 | 8733 |
| 2026-07 | 16 | 126 | 142 | 501 | 7985 | 8486 |
Two nationalities, two trajectories: annual totals

View exact chart values
| year | venezuelans | mexicans |
|---|---|---|
| 2021 | 104677 | 53237 |
| 2022 | 147819 | 118650 |
| 2023 | 335590 | 483364 |
| 2024 | 177222 | 519007 |
| 2025 | 13331 | 101801 |
| 2026 (Jan-Jul) | 893 | 59789 |
Peak month versus July 2026, state by state

View exact chart values
| state | peak_month | peak_value | jul2026 |
|---|---|---|---|
| Texas | 2023-09 | 25444 | 10 |
| Arizona | 2021-12 | 4629 | 5 |
| California | 2024-12 | 2204 | 0 |
| New Mexico | 2024-12 | 95 | 1 |
The Mexican exception
Mexicans are the counter-story, and the useful one. Mexican encounters peaked at 65,577 in December 2023 — nearly identical to the Venezuelan peak — and the totals have fallen hard since. But they have not vanished. May through July 2026 averaged 8,926 encounters a month, 13.6 percent of the peak, and July's count was 8,486. The composition, though, has completely changed. Mexican family-unit encounters, 37,285 at the December 2023 peak, averaged just 410 a month this spring — 1.1 percent of peak. What persists is the oldest pattern in the book: single Mexican adults, 7,985 in July 2026.
Two nuances keep this honest. First, the single-adult flow is not still falling — it is recovering off its 2025 lows. April 2026's 9,278 was the highest monthly count since January 2025, and the 2026 spring months ran well above the July 2025 trough of 5,086. Second, even this recovered level sits far below both the surge peak and the pre-pandemic baseline: 7,985 in July 2026 against 18,138 in October 2019, roughly 44 percent of the level from before COVID, before the 2023–24 crisis, and before this enforcement era. And the annual totals held up longer than the monthly line suggests: Mexican encounters in calendar 2024 — 519,007 — actually exceeded the 2023 figure of 483,364, before collapsing to 101,801 in 2025 and 59,789 in the first seven months of 2026, slightly below the same stretch of 2025. The surge nationalities' flow ended; the historically largest one shrank, plateaued, and ticked back up.
Mexicans at the southwest border: far below peak, but still flowing

View exact chart values
| month | ven_fmua | ven_sa | ven_total | mex_fmua | mex_sa | mex_total |
|---|---|---|---|---|---|---|
| 2019-10 | 454 | 265 | 719 | 3851 | 18138 | 21989 |
| 2019-11 | 397 | 185 | 582 | 4324 | 16634 | 20958 |
| 2019-12 | 511 | 180 | 691 | 4091 | 14739 | 18830 |
| 2020-01 | 173 | 66 | 239 | 3323 | 17179 | 20502 |
| 2020-02 | 149 | 52 | 201 | 2809 | 17825 | 20634 |
| 2020-03 | 113 | 50 | 163 | 1280 | 14258 | 15538 |
| 2020-04 | 5 | 2 | 7 | 25 | 768 | 793 |
| 2020-05 | 2 | 6 | 8 | 64 | 1436 | 1500 |
| 2020-06 | 9 | 4 | 13 | 86 | 1933 | 2019 |
| 2020-07 | 14 | 11 | 25 | 72 | 2306 | 2378 |
| 2020-08 | 17 | 13 | 30 | 98 | 2838 | 2936 |
| 2020-09 | 12 | 20 | 32 | 119 | 3243 | 3362 |
| 2020-10 | 66 | 31 | 97 | 103 | 2978 | 3081 |
| 2020-11 | 74 | 70 | 144 | 88 | 2969 | 3057 |
| 2020-12 | 104 | 75 | 179 | 119 | 2865 | 2984 |
| 2021-01 | 126 | 117 | 243 | 230 | 2841 | 3071 |
| 2021-02 | 426 | 407 | 833 | 373 | 2316 | 2689 |
| 2021-03 | 1169 | 1320 | 2489 | 830 | 2586 | 3416 |
| 2021-04 | 2571 | 3057 | 5628 | 1091 | 2908 | 3999 |
| 2021-05 | 3185 | 4034 | 7219 | 1864 | 3371 | 5235 |
| 2021-06 | 3306 | 4048 | 7354 | 2610 | 3338 | 5948 |
| 2021-07 | 2888 | 3118 | 6006 | 3388 | 3489 | 6877 |
| 2021-08 | 2868 | 3348 | 6216 | 3222 | 3108 | 6330 |
| 2021-09 | 5182 | 5499 | 10681 | 752 | 2962 | 3714 |
| 2021-10 | 6153 | 7089 | 13242 | 313 | 3045 | 3358 |
| 2021-11 | 9235 | 10932 | 20167 | 587 | 3832 | 4419 |
| 2021-12 | 11506 | 13093 | 24599 | 614 | 3567 | 4181 |
| 2022-01 | 9187 | 13367 | 22554 | 501 | 3960 | 4461 |
| 2022-02 | 1117 | 1907 | 3024 | 472 | 4514 | 4986 |
| 2022-03 | 1314 | 2704 | 4018 | 592 | 6739 | 7331 |
| 2022-04 | 1334 | 2731 | 4065 | 1471 | 7525 | 8996 |
| 2022-05 | 1618 | 3414 | 5032 | 2507 | 7391 | 9898 |
| 2022-06 | 3559 | 9513 | 13072 | 2060 | 6831 | 8891 |
| 2022-07 | 5333 | 12126 | 17459 | 2916 | 6560 | 9476 |
| 2022-08 | 7054 | 18098 | 25152 | 3693 | 6847 | 10540 |
| 2022-09 | 8751 | 24768 | 33519 | 3511 | 7273 | 10784 |
| 2022-10 | 5540 | 9751 | 15291 | 5306 | 5779 | 11085 |
| 2022-11 | 987 | 1021 | 2008 | 6516 | 6031 | 12547 |
| 2022-12 | 1658 | 967 | 2625 | 8145 | 11510 | 19655 |
| 2023-01 | 2897 | 3997 | 6894 | 7139 | 12582 | 19721 |
| 2023-02 | 1140 | 3113 | 4253 | 4681 | 7204 | 11885 |
| 2023-03 | 2184 | 3483 | 5667 | 7138 | 7139 | 14277 |
| 2023-04 | 12956 | 12017 | 24973 | 6195 | 6153 | 12348 |
| 2023-05 | 8427 | 18452 | 26879 | 10970 | 24515 | 35485 |
| 2023-06 | 9497 | 10650 | 20147 | 16373 | 30958 | 47331 |
| 2023-07 | 8948 | 9752 | 18700 | 21699 | 29822 | 51521 |
| 2023-08 | 15152 | 15842 | 30994 | 21048 | 31712 | 52760 |
| 2023-09 | 26379 | 39481 | 65860 | 22832 | 27906 | 50738 |
| 2023-10 | 17338 | 23040 | 40378 | 29655 | 30518 | 60173 |
| 2023-11 | 15446 | 18164 | 33610 | 31940 | 29608 | 61548 |
| 2023-12 | 22831 | 34404 | 57235 | 37285 | 28292 | 65577 |
| 2024-01 | 4126 | 7355 | 11481 | 26780 | 30349 | 57129 |
| 2024-02 | 3570 | 5092 | 8662 | 26591 | 33130 | 59721 |
| 2024-03 | 6845 | 9393 | 16238 | 26629 | 35898 | 62527 |
| 2024-04 | 7396 | 10718 | 18114 | 23084 | 33561 | 56645 |
| 2024-05 | 7158 | 9711 | 16869 | 27498 | 28969 | 56467 |
| 2024-06 | 5340 | 7026 | 12366 | 17791 | 22407 | 40198 |
| 2024-07 | 5292 | 7451 | 12743 | 11127 | 19771 | 30898 |
| 2024-08 | 6260 | 8769 | 15029 | 11696 | 23287 | 34983 |
| 2024-09 | 6367 | 8676 | 15043 | 10401 | 23171 | 33572 |
| 2024-10 | 6921 | 9273 | 16194 | 11135 | 22659 | 33794 |
| 2024-11 | 6734 | 8791 | 15525 | 9407 | 19623 | 29030 |
| 2024-12 | 8579 | 10379 | 18958 | 8067 | 15976 | 24043 |
| 2025-01 | 5193 | 6317 | 11510 | 4934 | 13645 | 18579 |
| 2025-02 | 40 | 82 | 122 | 416 | 6417 | 6833 |
| 2025-03 | 37 | 115 | 152 | 451 | 7374 | 7825 |
| 2025-04 | 35 | 129 | 164 | 602 | 8276 | 8878 |
| 2025-05 | 50 | 141 | 191 | 507 | 8468 | 8975 |
| 2025-06 | 33 | 105 | 138 | 506 | 6117 | 6623 |
| 2025-07 | 54 | 99 | 153 | 614 | 5086 | 5700 |
| 2025-08 | 27 | 160 | 187 | 759 | 6324 | 7083 |
| 2025-09 | 48 | 157 | 205 | 947 | 7262 | 8209 |
| 2025-10 | 52 | 146 | 198 | 719 | 7630 | 8349 |
| 2025-11 | 22 | 111 | 133 | 570 | 7214 | 7784 |
| 2025-12 | 26 | 152 | 178 | 565 | 6398 | 6963 |
| 2026-01 | 16 | 95 | 111 | 383 | 7015 | 7398 |
| 2026-02 | 8 | 96 | 104 | 327 | 6684 | 7011 |
| 2026-03 | 4 | 135 | 139 | 411 | 8488 | 8899 |
| 2026-04 | 15 | 125 | 140 | 425 | 9278 | 9703 |
| 2026-05 | 17 | 116 | 133 | 400 | 9159 | 9559 |
| 2026-06 | 12 | 112 | 124 | 330 | 8403 | 8733 |
| 2026-07 | 16 | 126 | 142 | 501 | 7985 | 8486 |
The scoreboard — and what these numbers cannot say
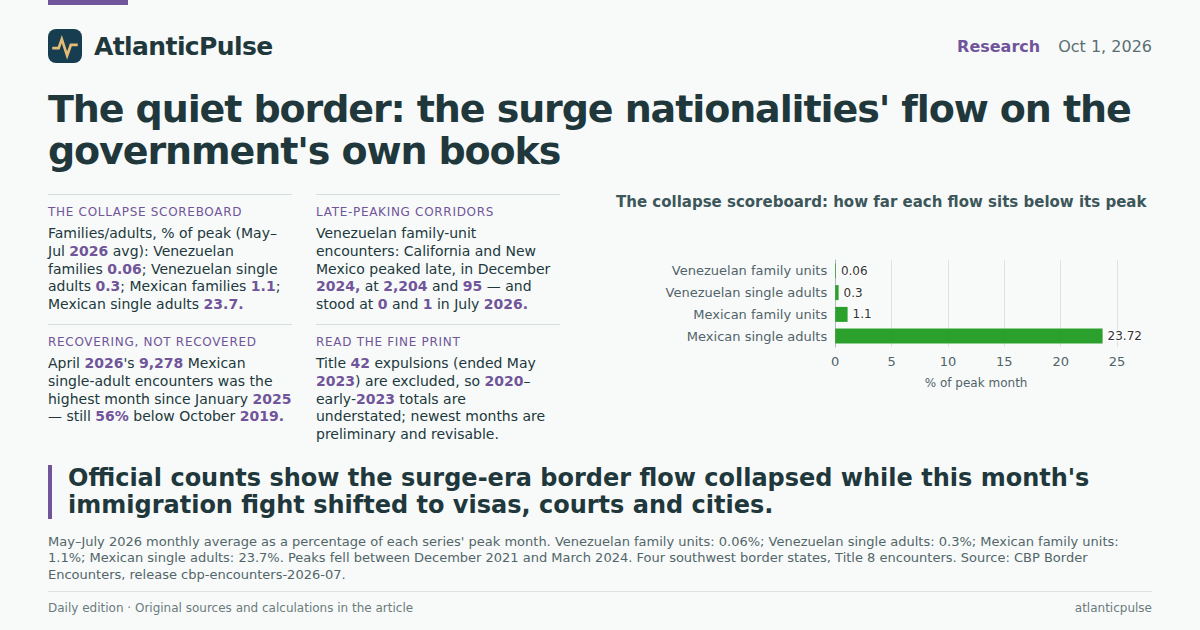
Put the four flows on one scoreboard, measuring each against its own peak. Venezuelan family units: 0.06 percent of peak. Venezuelan single adults: 0.3 percent. Mexican family units: 1.1 percent. Mexican single adults: 23.7 percent. Every line is far below its worst month; only one is still a live, sizable flow at all.
What these numbers cannot say matters as much. They cover two citizenships in four border states, not the whole border; they exclude Title 42 expulsions from the pre-2023 record; they count encounters, not unique people; they are not seasonally adjusted; and the newest months are preliminary. Nothing here identifies why any line moved — policy, conditions in origin countries, smuggling economics and enforcement all interact, and this descriptive panel cannot separate them. What it can say is narrower and, this month, more useful: the numbers that once supplied the emergency have thinned to near zero for the surge's signature nationality, and to a fraction of peak for the perennial one.
That is the context in which this month's enforcement stories should be read. A fight conducted through 250,000 visa revocations, mandatory-detention litigation, H-1B fee blocks and lawsuits over an ICE shooting in Minneapolis is not being driven by what is happening at the Texas line — the official counts there are rounding errors for the groups that used to make headlines. The border emergency that structured two years of American immigration politics has, on the government's own books, mostly stopped supplying itself. What remains is a smaller, older, steadier flow of Mexican single adults — and a political system still fighting the last emergency indoors.
The collapse scoreboard: how far each flow sits below its peak

View exact chart values
| label | pct_of_peak | peak_month | peak_value | recent3_avg | jul2026 |
|---|---|---|---|---|---|
| Venezuelan family units | 0.06 | 2023-09 | 26379 | 15 | 16 |
| Venezuelan single adults | 0.3 | 2023-09 | 39481 | 118 | 126 |
| Mexican family units | 1.1 | 2023-12 | 37285 | 410.3 | 501 |
| Mexican single adults | 23.72 | 2024-03 | 35898 | 8515.7 | 7985 |
Sources and methods
Extracts: 16 bounded extracts from the pinned cbp_encounters product (release cbp-encounters-2026-07; snapshot created 2026-08-23), monthly periods October 2019–July 2026, four component-total series (citizenship VENEZUELA/MEXICO × demographic FMUA/Single Adults × Southwest Land Border × Title 8) at state geographies TX, AZ, CA, NM.
Deduplication: CBP publishes overlapping multi-year snapshot files (fy20-fy23, fy21-fy24, fy22-fy25, fy23-fy26-jul). Where the same series-month appears in several files, the latest snapshot's value is used; the snapshots had zero conflicting duplicate values in these extracts.
Zero handling: CBP omits zero-count rows from its state tables, so an absent state-month is treated as zero when summing the four states; this is a convention for omitted zeros, not an assumption about unreported data. Null-valued rows are excluded, never counted as zero implicitly.
Scope exclusions: Title 42 expulsions (in force March 2020–May 2023) are excluded, so totals for 2020 through early 2023 understate all encounters for these groups; the 2023–2026 comparisons are essentially Title 8-only by then. Coverage is two citizenships in four states — not a nationwide or all-nationality total.
Vintage and revisions: latest available month is July 2026; recent months in CBP's overlapping snapshots are preliminary and subject to revision. Counts are encounters (persons processed), not unique individuals; series are not seasonally adjusted.
Interpretation limits: all comparisons are descriptive (peak versus current levels, year-over-year sums); no causal effect is inferred from these counts, and the panel cannot attribute changes to any policy, conditions, or enforcement action.
Research completed 2026-10-02, for the October 1, 2026 news edition. The available source data may cover earlier periods; see the observation periods and source vintages above.