Research
The poverty line is moving. The nursing-home payroll is not.
A poverty rate, and a care industry that has to staff it
New census reporting this week put a hard number on a quiet slide. After pandemic-era aid rolled off, the supplemental poverty rate for Americans 65 and older rose from 9.4 percent in 2020 to 15.4 percent in 2025 — steeper than the rise for the country as a whole — with medical bills pushing about 2.5 million older people under the line, according to Business Insider’s account of the figures. Rebecca Reed, 88, works two jobs in New Orleans and would like a grocery discount. That is the human end of a ledger that also includes Social Security, Medicare premiums, and the median private nursing-home room, which the same reporting put at $130,000 a year in 2025.
Those poverty rates are not in the statistical catalogue used here. What the catalogue can answer is the question the poverty numbers raise: is the country actually getting older in the ages that fill nursing homes, has the workforce that staffs those buildings kept up, and have the household bills that shove people under the line — health care and housing — already been climbing? The short version is uncomfortable. In the Census Bureau’s 2023 middle-series national projections, the next surge is not at 65. It is at 80, 85 and 90. In the Bureau of Labor Statistics payroll, skilled-nursing jobs in July 2026 were still a hair below July 2019. Home health, the cheaper substitute, has boomed. Per-person spending on health care and on housing and utilities, in BEA consumption accounts that cover all ages, is far above 2020. None of that proves why any one 88-year-old is poor. It does show that the care system the poverty story depends on is not scaling with the oldest ages.
The Census file’s punchline is 80, not 65
Every population figure that follows is a projection from the Census Bureau’s 2023 middle-series D1 file — both sexes, all races, total Hispanic origin — and the file labels 2022 through 2050 that way, including years that have already elapsed. They are not later census counts. They are also single years of age, not a 65-and-older total. Adding the six birthdays charted here would still miss everyone who is 66, 67, 68 and so on.
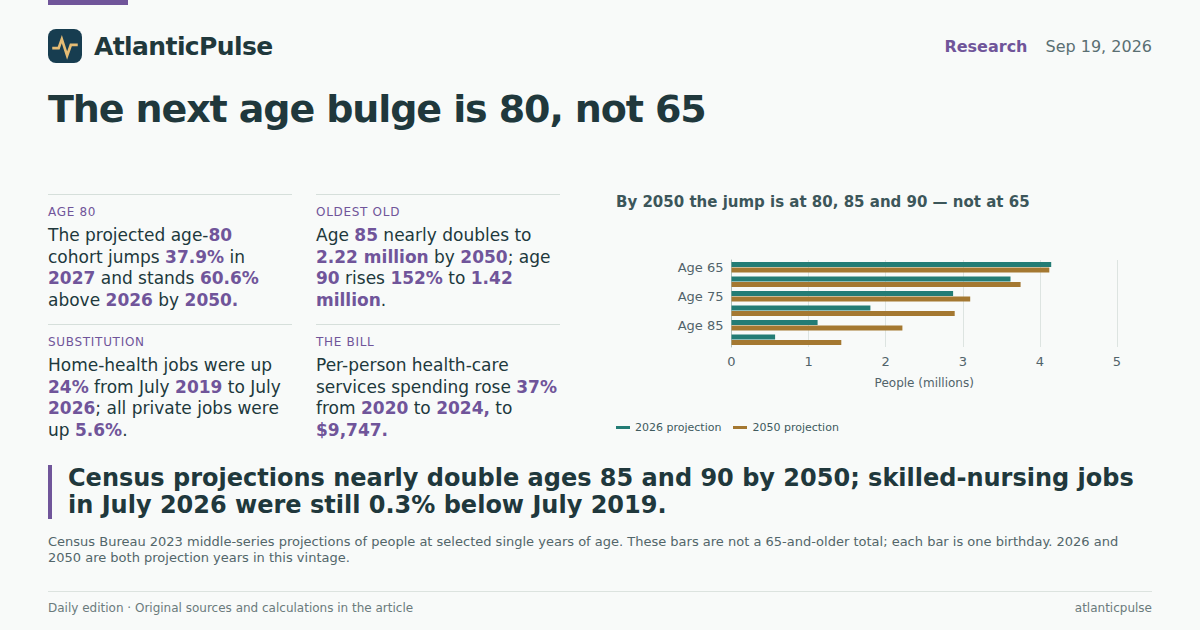
On that basis, the United States is projected at 339.5 million people in 2026 and 360.6 million in 2050, a 6.2 percent rise. The age-65 cohort barely moves: 4.15 million in 2026 and 4.12 million in 2050. The age-80 cohort is another matter. It is projected at 1.80 million in 2026, then 2.49 million in 2027 — a 37.9 percent jump in a single projection year, as the late-1940s baby boom turns 80 — and 2.90 million in 2050, 60.6 percent above 2026. Age 85 nearly doubles, from 1.12 million to 2.22 million. Age 90 more than doubles, from 565,000 to 1.42 million. Indexed to 2022, total population is 108 by 2050; age 80 is 178; age 85 is 230; age 90 is 272.
That is the opposite of the usual “silver tsunami at 65” slide. The people who are 65 in this vintage are not the bulge. The people heading into the ages that use the most paid care are. A poverty rate that is already rising among Americans 65 and older is arriving just as the official projection file loads more people into 80, 85 and 90 — the ages where a fall, a stroke, or a month in a skilled-nursing bed stops being hypothetical.
The oldest ages grow far faster than the population

View exact chart values
| year | total_index | age65_index | age80_index | age85_index | age90_index |
|---|---|---|---|---|---|
| 2022 | 100 | 100 | 100 | 100 | 100 |
| 2023 | 100.5 | 100.9 | 113.1 | 105.7 | 101.2 |
| 2024 | 101 | 100.9 | 108.8 | 107.4 | 101 |
| 2025 | 101.4 | 102 | 109.1 | 110.5 | 108.4 |
| 2026 | 101.9 | 103.1 | 111 | 115.9 | 107.8 |
| 2027 | 102.3 | 102.7 | 153.1 | 124.6 | 109.8 |
| 2028 | 102.7 | 101.7 | 142.6 | 141.1 | 116.3 |
| 2029 | 103.1 | 101.2 | 143.3 | 136 | 118.5 |
| 2030 | 103.5 | 98.5 | 144.8 | 136.5 | 122.2 |
| 2031 | 103.9 | 94.5 | 149.5 | 139.2 | 128.5 |
| 2032 | 104.3 | 92.9 | 154.8 | 192.1 | 138.5 |
| 2033 | 104.6 | 92.3 | 158.8 | 179.3 | 157 |
| 2034 | 105 | 94 | 163.9 | 180.5 | 151.9 |
| 2035 | 105.3 | 97.3 | 168.1 | 182.7 | 152.9 |
| 2036 | 105.6 | 98.6 | 170.6 | 189 | 156.3 |
| 2037 | 105.9 | 93 | 177.1 | 196 | 215.8 |
| 2038 | 106.1 | 88.7 | 179.1 | 201.4 | 202.2 |
| 2039 | 106.4 | 87.5 | 179.5 | 208.2 | 204.1 |
| 2040 | 106.6 | 89 | 182 | 214 | 207.2 |
| 2041 | 106.8 | 88.1 | 184.4 | 217.5 | 214.9 |
| 2042 | 107 | 91.1 | 184.2 | 226.1 | 223.5 |
| 2043 | 107.2 | 92.4 | 183 | 229 | 230.2 |
| 2044 | 107.4 | 94.5 | 182.5 | 229.9 | 238.6 |
| 2045 | 107.5 | 98.5 | 178.1 | 233.5 | 245.8 |
| 2046 | 107.7 | 99.2 | 171.4 | 237 | 250.5 |
| 2047 | 107.8 | 100.7 | 168.9 | 237.1 | 261 |
| 2048 | 108 | 101.1 | 168.3 | 235.9 | 265 |
| 2049 | 108.1 | 100.1 | 171.9 | 235.7 | 266.7 |
| 2050 | 108.2 | 102.5 | 178.3 | 230.3 | 271.5 |
By 2050 the jump is at 80, 85 and 90 — not at 65

View exact chart values
| age | millions_2026 | millions_2050 | pct_change_2026_2050 |
|---|---|---|---|
| Age 65 | 4.146 | 4.122 | -0.6 |
| Age 70 | 3.619 | 3.75 | 3.6 |
| Age 75 | 2.874 | 3.096 | 7.7 |
| Age 80 | 1.802 | 2.895 | 60.6 |
| Age 85 | 1.116 | 2.217 | 98.7 |
| Age 90 | 0.565 | 1.424 | 151.9 |
The buildings are filling. The nursing-home payroll is not.
Skilled-nursing care is the industry that sits closest to that 80-and-up bulge. In the BLS Current Employment Statistics, seasonally adjusted, skilled-nursing facilities employed 1,592,900 people in July 2026, the last month in this snapshot. That is 0.3 percent below July 2019 (1,597,200) and only 5.8 percent above January 2000 (1,505,700). Over the same 26 years, all private employment rose 22.8 percent, from 110.4 million to 135.6 million. Home-health jobs, the work that happens in living rooms rather than wings, rose 197.8 percent, from 633,300 to 1,886,100. Nursing and residential care as a whole — which includes assisted living as well as skilled nursing — was 3.6 percent above July 2019.
The pandemic hole is still visible in the July-to-July index. Skilled nursing fell to 84.8 percent of its July 2019 level by July 2022 and had only just climbed back to 99.7 by July 2026. Home health was already above 2019 by 2022 and stood 24 percent higher in July 2026. Total private jobs were 5.6 percent above July 2019. The substitution is in the open: the country added home-health aides and did not restore the nursing-home floor. Annual averages tell the same story at a slightly different altitude — skilled nursing’s yearly mean bottomed at 1.36 million in 2022, versus 1.60 million in 2019 — but 2026’s annual mean in this file covers only January through July and should not be treated as a full year.
None of this says the poverty rate rose because nursing homes could not hire. It says the payroll that would have to expand if more 80- and 85-year-olds need round-the-clock care has been the weak leg of the health-care boom. Home health can keep someone in a house. It does not staff a 3 a.m. wing.
Nursing-home jobs have not recouped 2019. Home health has.

View exact chart values
| year | nursing_residential_index | skilled_nursing_index | home_health_index | total_private_index |
|---|---|---|---|---|
| 2000 | 76.5 | 94.8 | 41.9 | 86.8 |
| 2001 | 79.4 | 97 | 42 | 86.5 |
| 2002 | 81.1 | 98.5 | 44.4 | 84.9 |
| 2003 | 82.4 | 98.9 | 48.5 | 84.6 |
| 2004 | 83.4 | 98.8 | 51.2 | 85.9 |
| 2005 | 84.6 | 98.8 | 54.2 | 87.6 |
| 2006 | 85.8 | 99.3 | 56.9 | 89.2 |
| 2007 | 87.6 | 100.4 | 60.4 | 90.3 |
| 2008 | 89.2 | 101.2 | 63.6 | 89.5 |
| 2009 | 91.4 | 103.1 | 67.7 | 84.2 |
| 2010 | 92.5 | 103.8 | 71.6 | 84 |
| 2011 | 93.9 | 104.7 | 75.2 | 85.6 |
| 2012 | 94.7 | 104.1 | 77.9 | 87.4 |
| 2013 | 95.5 | 103.3 | 81 | 89.3 |
| 2014 | 96.3 | 103.3 | 83 | 91.3 |
| 2015 | 97.4 | 103.2 | 86.7 | 93.4 |
| 2016 | 98.5 | 103.2 | 89.8 | 95.2 |
| 2017 | 99.2 | 101.9 | 94 | 96.9 |
| 2018 | 99.2 | 100.2 | 96.6 | 98.6 |
| 2019 | 100 | 100 | 100 | 100 |
| 2020 | 93.6 | 92.1 | 96.8 | 91.7 |
| 2021 | 89.3 | 85.9 | 98.8 | 97.2 |
| 2022 | 89.1 | 84.8 | 101 | 101.9 |
| 2023 | 93.9 | 89.4 | 106.8 | 103.8 |
| 2024 | 98.3 | 93.6 | 115.2 | 104.7 |
| 2025 | 101.4 | 97.2 | 118.3 | 105.1 |
| 2026 | 103.6 | 99.7 | 124 | 105.6 |
The bills that shove people under the line
The BEA’s state consumption accounts stop in 2024 and are per-person figures for the whole resident population, not for people 65 and older. They still map the two bills that the poverty reporting names: medical care and housing. Per capita spending on health-care services — outpatient, hospital and nursing-home care, not a full pharmacy bill — was $7,100 in 2020 and $9,747 in 2024, up 37.3 percent. Housing and utilities, which mix tenant rent with an imputed rent for owner-occupied homes, went from $8,106 to $10,595, up 30.7 percent. Total per capita consumption rose 36.3 percent, from $42,920 to $58,499. In 2024 those two categories were 16.7 percent and 18.1 percent of the per-person basket. From 1997, health-care services are up 236 percent in current dollars, from $2,901.
Two caveats belong next to those percentages. First, 2020 was a distorted base for health spending: the series fell from $7,487 in 2019 to $7,100 in 2020 as postponed care dropped out of the accounts, then rebounded. Measuring from 2019, health-care services are still up 30.2 percent by 2024. Second, an all-ages per-capita average understates what an 85-year-old household actually faces, and the housing series credits homeowners with rent they do not write a cheque for. Even so, the direction is not subtle. The categories that the new poverty tables blame have been taking a larger current-dollar bite for a generation, and they did not pause after 2020.
Health-care and housing bills both outran 2020

View exact chart values
| year | pc_total_dollars | pc_health_dollars | pc_housing_utilities_dollars | health_share_pct | housing_share_pct | health_plus_housing_share_pct |
|---|---|---|---|---|---|---|
| 1997 | 20308 | 2901 | 3704 | 14.3 | 18.2 | 32.5 |
| 1998 | 21306 | 3016 | 3862 | 14.2 | 18.1 | 32.3 |
| 1999 | 22519 | 3095 | 4025 | 13.7 | 17.9 | 31.6 |
| 2000 | 23983 | 3255 | 4248 | 13.6 | 17.7 | 31.3 |
| 2001 | 24823 | 3497 | 4518 | 14.1 | 18.2 | 32.3 |
| 2002 | 25550 | 3765 | 4622 | 14.7 | 18.1 | 32.8 |
| 2003 | 26682 | 3978 | 4795 | 14.9 | 18 | 32.9 |
| 2004 | 28114 | 4231 | 5009 | 15 | 17.8 | 32.9 |
| 2005 | 29674 | 4469 | 5347 | 15.1 | 18 | 33.1 |
| 2006 | 31092 | 4665 | 5583 | 15 | 18 | 33 |
| 2007 | 32356 | 4907 | 5841 | 15.2 | 18.1 | 33.2 |
| 2008 | 33049 | 5115 | 6158 | 15.5 | 18.6 | 34.1 |
| 2009 | 32243 | 5322 | 6194 | 16.5 | 19.2 | 35.7 |
| 2010 | 33164 | 5493 | 6296 | 16.6 | 19 | 35.5 |
| 2011 | 34309 | 5635 | 6360 | 16.4 | 18.5 | 35 |
| 2012 | 35145 | 5794 | 6409 | 16.5 | 18.2 | 34.7 |
| 2013 | 35956 | 5884 | 6585 | 16.4 | 18.3 | 34.7 |
| 2014 | 37194 | 6094 | 6722 | 16.4 | 18.1 | 34.5 |
| 2015 | 38213 | 6400 | 6824 | 16.7 | 17.9 | 34.6 |
| 2016 | 39238 | 6674 | 6996 | 17 | 17.8 | 34.8 |
| 2017 | 40693 | 6875 | 7196 | 16.9 | 17.7 | 34.6 |
| 2018 | 42415 | 7137 | 7486 | 16.8 | 17.6 | 34.5 |
| 2019 | 43720 | 7487 | 7758 | 17.1 | 17.7 | 34.9 |
| 2020 | 42920 | 7100 | 8106 | 16.5 | 18.9 | 35.4 |
| 2021 | 48539 | 7956 | 8560 | 16.4 | 17.6 | 34 |
| 2022 | 52961 | 8440 | 9324 | 15.9 | 17.6 | 33.5 |
| 2023 | 55917 | 9087 | 10022 | 16.3 | 17.9 | 34.2 |
| 2024 | 58499 | 9747 | 10595 | 16.7 | 18.1 | 34.8 |
The paycheque inside the building
If skilled-nursing employment is the sticky payroll, the wage is not frozen. Average hourly earnings for all employees in skilled nursing, seasonally adjusted, averaged $15.28 in 2007 and $28.20 in July 2026. All private jobs paid $37.62 an hour that July. Nursing-home pay was 75 percent of the private average — higher than the 70 percent gap of the mid-2010s, still a discount. In 1982–84 dollars, skilled-nursing hourly pay rose from a 2007 average of $7.37 to $8.48 in July 2026, a 15.1 percent real gain over two decades. That is not nothing. It is also not a bidding war large enough to have pulled the headcount back through the 2019 door, let alone to staff a projected near-doubling at age 85.
Read together, the three official books say something narrower than a morality play and sharper than a vibe. The Census projection file loads millions more people into the ages that use paid long-term care. The CES file shows the nursing-home workforce still one step short of where it stood the summer before covid, while home health absorbed the growth. The BEA file shows health-care and housing outlays, for the whole population, far above 2020. A poverty rate that has already jumped among older Americans is arriving in that landscape. The catalogue cannot say the missing nursing-home jobs caused the extra poverty. It can say the country is not hiring for the birthday the projection file is about to celebrate.
Nursing-home pay rose. It is still about three-quarters of private pay.

View exact chart values
| year | snf_ahe_dollars | private_ahe_dollars | snf_real_ahe_1982_84 | snf_as_pct_of_private |
|---|---|---|---|---|
| 2007 | 15.28 | 20.91 | 7.37 | 73.1 |
| 2008 | 15.83 | 21.57 | 7.36 | 73.4 |
| 2009 | 16.31 | 22.17 | 7.6 | 73.6 |
| 2010 | 16.71 | 22.58 | 7.66 | 74 |
| 2011 | 16.97 | 23.03 | 7.55 | 73.7 |
| 2012 | 16.96 | 23.47 | 7.39 | 72.3 |
| 2013 | 17.15 | 23.96 | 7.36 | 71.6 |
| 2014 | 17.2 | 24.46 | 7.27 | 70.3 |
| 2015 | 17.52 | 25.01 | 7.39 | 70 |
| 2016 | 18.1 | 25.65 | 7.54 | 70.5 |
| 2017 | 18.6 | 26.31 | 7.59 | 70.7 |
| 2018 | 19.03 | 27.1 | 7.58 | 70.2 |
| 2019 | 19.75 | 28 | 7.73 | 70.5 |
| 2020 | 21.08 | 29.36 | 8.14 | 71.8 |
| 2021 | 22.49 | 30.61 | 8.3 | 73.5 |
| 2022 | 24.52 | 32.26 | 8.38 | 76 |
| 2023 | 25.57 | 33.7 | 8.39 | 75.9 |
| 2024 | 26.49 | 35.06 | 8.45 | 75.6 |
| 2025 | 27.46 | 36.44 | 8.52 | 75.4 |
| 2026 | 28.17 | 37.41 | 8.53 | 75.3 |
Sources and methods
All catalogue figures are from saved extracts and one calculation, aging-care-v4. Null observations were skipped, not treated as zero. Where a period appeared more than once, the first row was kept.
Population series are the Census Bureau 2023 national projections, middle series, D1 file, both sexes (sex=0), all races (race=0), total origin (origin=0). The extract labels every year 2022–2050 as status=projection. They are not later census counts and should not be read as 2026 observations. Each age series is a single year of age, not an age-group total; this package does not sum a 65-and-older population.
Employment and earnings are BLS Current Employment Statistics, seasonally adjusted, national, CES snapshot dated 24 August 2026, last month July 2026. July-to-July comparisons use July of each year. Annual averages for 2026 cover January–July only and are not used as full-year levels in the claims. Skilled nursing (CES6562310001) is a subset of nursing and residential care (CES6562300001). Home health is CES6562160001. Total private is CES0500000001. Average hourly earnings are all-employee series; real skilled-nursing earnings are in 1982–84 dollars (CES6562310013).
Personal consumption is BEA SAPCE per capita, current dollars, United States, annual 1997–2024, vintage bea-sapce-2025-09-26. Health care is outpatient, hospital and nursing-home services and excludes most prescription drugs. Housing and utilities include tenant rent and imputed owner-occupied rent. These are all-ages per-person averages, not 65-and-older household averages, and are not adjusted for inflation.
Supplemental poverty rates, the $130,000 nursing-home figure, and other details from 19 September 2026 news reporting are motive from that reporting. They are not observations in the catalogue and are not bound as derived claims. No causal effect is inferred from the descriptive comparisons.
Research completed 2026-09-20, for the September 19, 2026 news edition. The available source data may cover earlier periods; see the observation periods and source vintages above.