Research
The payroll test of “American workers first”
A claim that can be checked
President Trump sold a simple labour-market story in 2024: remove immigrants “taking jobs from American workers and driving down their wages,” and the American Dream comes back. By mid-August 2026 that story was on the defensive. A Fortune report quoted Moody’s Mark Zandi arguing that native-born unemployment had risen even as the immigrant labour force shrank, because the jobs immigrants had filled — construction, trucking, care work — are hard, poorly paid by native-born standards, and not about to be staffed at current wages. The White House insisted otherwise. Spokesman Kush Desai told Fortune that real wages in construction, manufacturing, transportation and warehousing were “growing by leaps and bounds compared to overall wage growth.”
Payrolls cannot settle the nativity argument. The Bureau of Labor Statistics Current Employment Statistics survey counts jobs on employer books, not the birthplace of the people holding them. It also cannot say why a warehouse closed or a data-centre crew got hired. What it can do, with a monthly series that runs through July 2026 in the official CES files, is test the narrower claim that the industries the administration keeps naming are booming in jobs and in pay. That is a useful test. If construction, factories and freight were adding workers at a clip and paying them far more than everyone else, the White House would have a ledger. If they are not, the “leaps and bounds” line is doing more work than the numbers.
The jobs ledger is mixed, and small
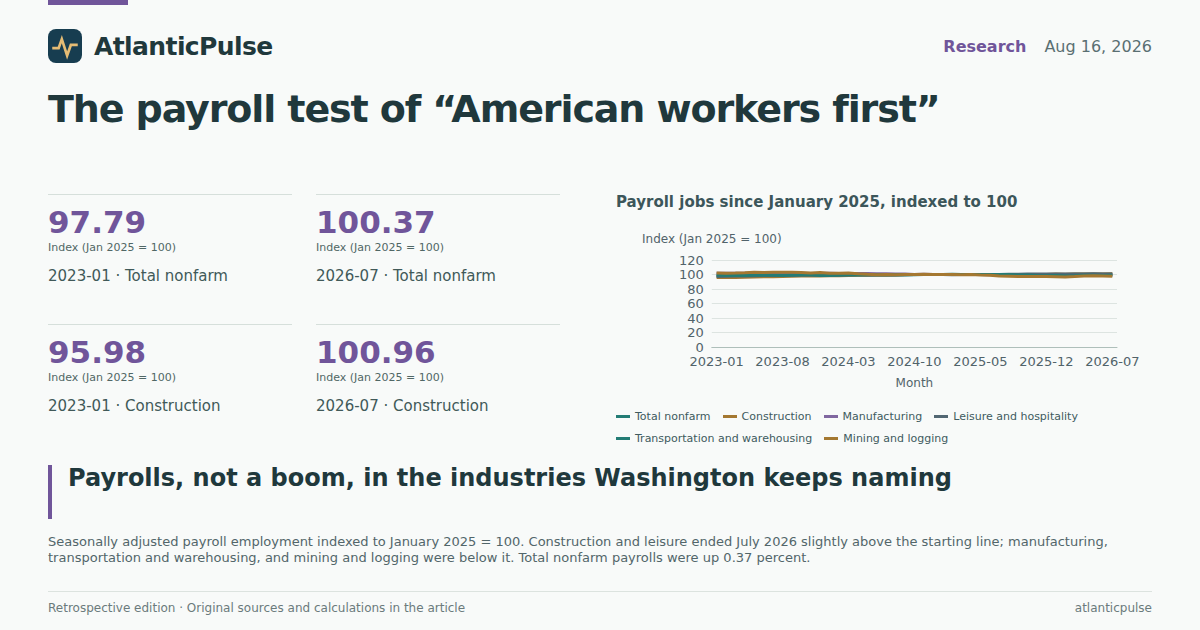
From January 2025, the first month of the second Trump term in these seasonally adjusted series, to July 2026, total nonfarm payrolls rose from 158.268 million to 158.858 million — 590,000 jobs, or 0.37 percent. That is not a stall, but it is a crawl. July itself subtracted 23,000 jobs, matching the Commerce-side weakness in retail sales reported the same weekend. Over the same 18 months construction added 79,000 jobs (0.96 percent) and leisure and hospitality added 99,000 (0.59 percent). Manufacturing lost 62,000 jobs. Transportation and warehousing lost 68,800. Mining and logging, a much smaller sector that still employs a disproportionate share of foreign-born workers in extraction, lost 15,000, a 2.4 percent drop.
Index the same series to January 2025 and the split is obvious. Construction finished July 2026 at 100.96. Leisure was at 100.59. Manufacturing sat at 99.51, transportation at 98.97, mining at 97.59. Year over year, construction payrolls were up 0.99 percent in July after a stretch in late 2025 when they had actually dipped below year-earlier levels. Manufacturing has been below its year-earlier reading since October 2023. None of this looks like a labour-market boom in the industries that were supposed to be liberated by a closed border. It looks like a slow economy in which construction is the least-weak of a weak group — consistent with the New York Fed’s observation, cited in the Fortune piece, that public administration and construction have seen some wage support from AI data-centre building, not from a sudden native-born rush into roofing.
Payroll jobs since January 2025, indexed to 100

View exact chart values
| period | nonfarm_emp | construction_emp | mfg_emp | leisure_emp | transp_emp | mining_emp |
|---|---|---|---|---|---|---|
| 2023-01 | 97.79 | 95.98 | 101.81 | 97.15 | 99.24 | 101.93 |
| 2023-02 | 97.98 | 96.12 | 101.78 | 97.62 | 98.8 | 101.77 |
| 2023-03 | 98.02 | 95.91 | 101.7 | 97.73 | 98.64 | 101.93 |
| 2023-04 | 98.17 | 96.26 | 101.66 | 97.95 | 98.68 | 102.41 |
| 2023-05 | 98.35 | 96.38 | 101.55 | 98.22 | 99.04 | 103.22 |
| 2023-06 | 98.49 | 96.88 | 101.59 | 98.59 | 98.87 | 102.89 |
| 2023-07 | 98.59 | 97 | 101.49 | 98.72 | 98.87 | 103.22 |
| 2023-08 | 98.73 | 97.31 | 101.48 | 98.92 | 98.64 | 103.05 |
| 2023-09 | 98.83 | 97.45 | 101.57 | 98.88 | 98.96 | 103.05 |
| 2023-10 | 98.93 | 97.77 | 101.29 | 99.15 | 99.21 | 102.73 |
| 2023-11 | 99.01 | 97.87 | 101.47 | 99.18 | 99.19 | 102.25 |
| 2023-12 | 99.11 | 98.02 | 101.57 | 99.24 | 98.44 | 102.57 |
| 2024-01 | 99.22 | 98.29 | 101.59 | 99.31 | 98.46 | 101.77 |
| 2024-02 | 99.35 | 98.4 | 101.41 | 99.48 | 99.03 | 101.77 |
| 2024-03 | 99.49 | 98.79 | 101.29 | 99.69 | 99.18 | 102.25 |
| 2024-04 | 99.53 | 98.86 | 101.26 | 99.58 | 99.5 | 100.96 |
| 2024-05 | 99.58 | 98.94 | 101.2 | 99.4 | 99.7 | 100.32 |
| 2024-06 | 99.64 | 99.18 | 101.11 | 99.48 | 99.73 | 99.68 |
| 2024-07 | 99.67 | 99.32 | 101.05 | 99.52 | 99.72 | 100 |
| 2024-08 | 99.68 | 99.66 | 100.78 | 99.49 | 99.67 | 99.68 |
| 2024-09 | 99.78 | 99.88 | 100.67 | 99.67 | 99.92 | 100 |
| 2024-10 | 99.8 | 99.98 | 100.19 | 99.8 | 99.78 | 100 |
| 2024-11 | 99.88 | 100.04 | 100.3 | 99.95 | 99.92 | 100.32 |
| 2024-12 | 100.03 | 100.15 | 100.16 | 100.18 | 99.97 | 100 |
| 2025-01 | 100 | 100 | 100 | 100 | 100 | 100 |
| 2025-02 | 100.03 | 100.04 | 99.98 | 99.79 | 100.36 | 100 |
| 2025-03 | 100.07 | 100.11 | 99.94 | 99.95 | 100.1 | 99.68 |
| 2025-04 | 100.14 | 100.08 | 99.91 | 100.02 | 99.86 | 100 |
| 2025-05 | 100.15 | 100.06 | 99.83 | 100.04 | 99.86 | 99.36 |
| 2025-06 | 100.13 | 100.04 | 99.71 | 100.03 | 99.86 | 99.04 |
| 2025-07 | 100.17 | 99.96 | 99.62 | 100.1 | 99.92 | 98.07 |
| 2025-08 | 100.13 | 99.7 | 99.54 | 100.23 | 99.89 | 97.59 |
| 2025-09 | 100.18 | 99.89 | 99.52 | 100.45 | 99.3 | 97.27 |
| 2025-10 | 100.09 | 99.75 | 99.45 | 100.69 | 99.31 | 97.43 |
| 2025-11 | 100.11 | 100.18 | 99.37 | 100.62 | 98.43 | 97.27 |
| 2025-12 | 100.1 | 100.1 | 99.27 | 100.77 | 98.36 | 97.11 |
| 2026-01 | 100.2 | 100.64 | 99.28 | 100.8 | 98.7 | 96.78 |
| 2026-02 | 100.11 | 100.39 | 99.29 | 100.61 | 98.01 | 96.62 |
| 2026-03 | 100.24 | 100.57 | 99.41 | 100.87 | 98.39 | 97.11 |
| 2026-04 | 100.33 | 100.61 | 99.4 | 100.83 | 98.98 | 97.75 |
| 2026-05 | 100.37 | 100.63 | 99.38 | 101.08 | 98.99 | 98.23 |
| 2026-06 | 100.39 | 100.69 | 99.47 | 100.83 | 98.82 | 97.91 |
| 2026-07 | 100.37 | 100.96 | 99.51 | 100.59 | 98.97 | 97.59 |
Payroll change from January 2025 to July 2026

View exact chart values
| industry | jan2025_thousands | jul2026_thousands | change_thousands | pct_change | jul2025_thousands | yoy_jul_change_thousands | yoy_jul_pct | sort_key |
|---|---|---|---|---|---|---|---|---|
| Transportation and warehousing | 6664.9 | 6596.1 | -68.8 | -1.03 | 6659.4 | -63.3 | -0.95 | -68.8 |
| Manufacturing | 12673 | 12611 | -62 | -0.49 | 12625 | -14 | -0.11 | -62 |
| Mining and logging | 622 | 607 | -15 | -2.41 | 610 | -3 | -0.49 | -15 |
| Construction | 8264 | 8343 | 79 | 0.96 | 8261 | 82 | 0.99 | 79 |
| Leisure and hospitality | 16832 | 16931 | 99 | 0.59 | 16848 | 83 | 0.49 | 99 |
| Total nonfarm | 158268 | 158858 | 590 | 0.37 | 158542 | 316 | 0.2 | 590 |
Year-over-year payroll growth by industry

View exact chart values
| period | nonfarm_emp | construction_emp | mfg_emp | leisure_emp | transp_emp |
|---|---|---|---|---|---|
| 2022-01 | 5 | 3.16 | 3.48 | 19.75 | 10.23 |
| 2022-02 | 5.19 | 5.13 | 3.52 | 17.65 | 10.73 |
| 2022-03 | 4.91 | 3.96 | 3.64 | 16.73 | 9.6 |
| 2022-04 | 4.87 | 4.03 | 4.37 | 15.17 | 10.11 |
| 2022-05 | 4.73 | 4.69 | 4.25 | 13.78 | 10.04 |
| 2022-06 | 4.48 | 4.98 | 4.25 | 12.13 | 9.12 |
| 2022-07 | 4.3 | 4.94 | 4.02 | 9.91 | 8.2 |
| 2022-08 | 4.11 | 4.97 | 3.88 | 9.36 | 7.11 |
| 2022-09 | 3.93 | 4.65 | 3.68 | 8.86 | 6.06 |
| 2022-10 | 3.61 | 4.38 | 3.45 | 7.98 | 5.06 |
| 2022-11 | 3.36 | 3.98 | 3.18 | 7.38 | 3.44 |
| 2022-12 | 3.02 | 3.82 | 2.86 | 6.55 | 2.19 |
| 2023-01 | 3.18 | 4.44 | 2.7 | 6.67 | 1.96 |
| 2023-02 | 2.81 | 3.82 | 2.36 | 6.27 | 0.34 |
| 2023-03 | 2.52 | 3.04 | 1.69 | 5.97 | -0.25 |
| 2023-04 | 2.47 | 3.34 | 1.24 | 5.51 | -0.46 |
| 2023-05 | 2.46 | 2.93 | 1.05 | 5.28 | -0.4 |
| 2023-06 | 2.31 | 3.16 | 0.85 | 5.07 | -0.71 |
| 2023-07 | 1.94 | 2.87 | 0.48 | 4.3 | -0.89 |
| 2023-08 | 1.89 | 3.09 | 0.23 | 4.13 | -0.96 |
| 2023-09 | 1.85 | 2.82 | 0.18 | 3.68 | -0.47 |
| 2023-10 | 1.71 | 2.97 | -0.36 | 3.39 | -0.4 |
| 2023-11 | 1.6 | 2.86 | -0.29 | 3.16 | -0.08 |
| 2023-12 | 1.63 | 2.73 | -0.18 | 2.83 | -0.69 |
| 2024-01 | 1.46 | 2.41 | -0.22 | 2.23 | -0.78 |
| 2024-02 | 1.4 | 2.38 | -0.36 | 1.9 | 0.23 |
| 2024-03 | 1.5 | 3 | -0.4 | 2.01 | 0.54 |
| 2024-04 | 1.39 | 2.7 | -0.4 | 1.67 | 0.82 |
| 2024-05 | 1.25 | 2.65 | -0.34 | 1.2 | 0.67 |
| 2024-06 | 1.16 | 2.37 | -0.47 | 0.9 | 0.88 |
| 2024-07 | 1.09 | 2.4 | -0.44 | 0.81 | 0.86 |
| 2024-08 | 0.96 | 2.41 | -0.69 | 0.57 | 1.04 |
| 2024-09 | 0.96 | 2.5 | -0.89 | 0.8 | 0.97 |
| 2024-10 | 0.87 | 2.25 | -1.09 | 0.66 | 0.57 |
| 2024-11 | 0.88 | 2.21 | -1.15 | 0.77 | 0.74 |
| 2024-12 | 0.93 | 2.17 | -1.39 | 0.95 | 1.56 |
| 2025-01 | 0.79 | 1.74 | -1.57 | 0.69 | 1.56 |
| 2025-02 | 0.68 | 1.66 | -1.41 | 0.31 | 1.35 |
| 2025-03 | 0.58 | 1.34 | -1.32 | 0.26 | 0.93 |
| 2025-04 | 0.61 | 1.24 | -1.33 | 0.44 | 0.36 |
| 2025-05 | 0.56 | 1.14 | -1.36 | 0.65 | 0.16 |
| 2025-06 | 0.5 | 0.87 | -1.39 | 0.56 | 0.12 |
| 2025-07 | 0.5 | 0.65 | -1.41 | 0.58 | 0.2 |
| 2025-08 | 0.45 | 0.04 | -1.23 | 0.74 | 0.22 |
| 2025-09 | 0.4 | 0.01 | -1.14 | 0.78 | -0.61 |
| 2025-10 | 0.29 | -0.23 | -0.74 | 0.89 | -0.47 |
| 2025-11 | 0.23 | 0.15 | -0.93 | 0.67 | -1.49 |
| 2025-12 | 0.07 | -0.05 | -0.89 | 0.59 | -1.62 |
| 2026-01 | 0.2 | 0.64 | -0.72 | 0.8 | -1.3 |
| 2026-02 | 0.08 | 0.35 | -0.69 | 0.83 | -2.34 |
| 2026-03 | 0.17 | 0.46 | -0.54 | 0.93 | -1.71 |
| 2026-04 | 0.2 | 0.52 | -0.51 | 0.81 | -0.88 |
| 2026-05 | 0.23 | 0.57 | -0.44 | 1.04 | -0.87 |
| 2026-06 | 0.25 | 0.65 | -0.24 | 0.8 | -1.04 |
| 2026-07 | 0.2 | 0.99 | -0.11 | 0.49 | -0.95 |
Pay is up. “Leaps and bounds” is a stretch.
Average hourly earnings of all employees, seasonally adjusted, did rise in the industries the White House named. Construction pay went from $39.07 an hour in January 2025 to $41.46 in July 2026, a 6.12 percent gain. Manufacturing rose 6.16 percent, to $36.87. Transportation and warehousing rose 5.12 percent. Leisure and hospitality, the other large immigrant-heavy service sector, rose 5.02 percent. The private-sector average rose 4.97 percent, from $35.84 to $37.62. So construction and factory pay did outrun the average. The gap is about one percentage point over 18 months.
On a year-over-year basis the picture is even less dramatic. In July 2026 construction hourly earnings were 4.35 percent above a year earlier, against 3.15 percent for all private employees, 3.83 percent in manufacturing and 3.52 percent in transportation. That is faster, not “leaps and bounds.” Inflation-adjusted private hourly earnings, expressed in 1982–84 dollars, went from $11.24 in January 2025 to $11.30 in July 2026 and were 0.18 percent lower than a year earlier. One month, October 2025, is missing from that real series in this extract; neighbouring months do not change the story. Nominal pay is still drifting up. The raise you can spend is not.
Year-over-year growth in average hourly earnings

View exact chart values
| period | private_ahe | construction_ahe | mfg_ahe | leisure_ahe | transp_ahe | private_real_ahe |
|---|---|---|---|---|---|---|
| 2022-01 | 5.58 | 5.23 | 5.13 | 13.14 | 6.6 | -1.84 |
| 2022-02 | 5.29 | 5.2 | 4.49 | 11.86 | 6.62 | -2.46 |
| 2022-03 | 5.89 | 5.89 | 4.87 | 12.14 | 6.98 | -2.47 |
| 2022-04 | 5.76 | 5.44 | 4.98 | 11.4 | 6.14 | -2.21 |
| 2022-05 | 5.56 | 5.56 | 4.41 | 10.66 | 6.99 | -2.74 |
| 2022-06 | 5.4 | 5.76 | 4.09 | 9.02 | 4.84 | -3.28 |
| 2022-07 | 5.48 | 5.77 | 4 | 8.89 | 4.7 | -2.75 |
| 2022-08 | 5.39 | 5.59 | 4.06 | 8.25 | 5.58 | -2.66 |
| 2022-09 | 5.13 | 5.53 | 3.84 | 7.7 | 6.02 | -2.83 |
| 2022-10 | 5.01 | 5.63 | 3.92 | 6.6 | 5.89 | -2.58 |
| 2022-11 | 5.09 | 5.95 | 3.94 | 6.62 | 4.46 | -1.96 |
| 2022-12 | 4.94 | 6.01 | 3.76 | 6.94 | 3.88 | -1.43 |
| 2023-01 | 4.49 | 5.23 | 3.7 | 6.89 | 4.06 | -1.7 |
| 2023-02 | 4.77 | 5.65 | 3.94 | 6.66 | 4.53 | -1.08 |
| 2023-03 | 4.62 | 5.45 | 4.09 | 6.1 | 4.85 | -0.27 |
| 2023-04 | 4.6 | 5.27 | 4.03 | 5.8 | 5.46 | -0.36 |
| 2023-05 | 4.36 | 5.04 | 4.32 | 5.19 | 4.63 | 0.18 |
| 2023-06 | 4.66 | 4.72 | 5.1 | 5.78 | 5.78 | 1.56 |
| 2023-07 | 4.67 | 5.46 | 5.3 | 5.29 | 5.71 | 1.28 |
| 2023-08 | 4.47 | 5.35 | 5.06 | 4.77 | 5.32 | 0.73 |
| 2023-09 | 4.42 | 5.01 | 5.27 | 4.55 | 5.21 | 0.73 |
| 2023-10 | 4.22 | 4.96 | 4.98 | 4.68 | 5.6 | 1 |
| 2023-11 | 4.11 | 4.94 | 5.36 | 4.46 | 5.65 | 1 |
| 2023-12 | 4.1 | 4.54 | 5.56 | 3.8 | 6.35 | 0.82 |
| 2024-01 | 4.39 | 5.37 | 5.27 | 4.18 | 6.79 | 1.27 |
| 2024-02 | 4.13 | 4.63 | 5.46 | 4.42 | 6.22 | 0.91 |
| 2024-03 | 4.15 | 4.92 | 5.43 | 4.41 | 5.91 | 0.64 |
| 2024-04 | 3.98 | 5.15 | 4.97 | 4.1 | 5.07 | 0.54 |
| 2024-05 | 4.15 | 4.85 | 5.13 | 3.98 | 4.91 | 0.91 |
| 2024-06 | 3.92 | 4.81 | 4.97 | 3.53 | 4.54 | 0.9 |
| 2024-07 | 3.63 | 4.28 | 4.67 | 3.71 | 4.18 | 0.72 |
| 2024-08 | 3.92 | 4.18 | 4.94 | 3.94 | 4.2 | 1.26 |
| 2024-09 | 3.91 | 4.56 | 4.64 | 3.84 | 3.78 | 1.45 |
| 2024-10 | 4.05 | 4.51 | 4.66 | 3.63 | 3.42 | 1.35 |
| 2024-11 | 4.18 | 4.22 | 4.42 | 3.71 | 3.28 | 1.44 |
| 2024-12 | 4.08 | 4.48 | 4 | 3.89 | 2.62 | 1.17 |
| 2025-01 | 3.97 | 4.16 | 4.2 | 3.83 | 2.27 | 0.99 |
| 2025-02 | 4.11 | 4.26 | 4.4 | 3.82 | 2.24 | 1.26 |
| 2025-03 | 4.21 | 3.84 | 5 | 4.31 | 2.46 | 1.8 |
| 2025-04 | 3.91 | 3.53 | 4.52 | 3.84 | 2.89 | 1.62 |
| 2025-05 | 3.98 | 3.76 | 4.5 | 3.47 | 2.65 | 1.62 |
| 2025-06 | 3.86 | 4.04 | 4.06 | 3.46 | 2.64 | 1.16 |
| 2025-07 | 3.96 | 3.76 | 4.2 | 3.35 | 2.8 | 1.16 |
| 2025-08 | 3.98 | 4.28 | 4 | 3.52 | 2.96 | 1.07 |
| 2025-09 | 3.85 | 3.79 | 4.11 | 3.7 | 3.28 | 0.8 |
| 2025-10 | 3.92 | 3.75 | 4.3 | 3.42 | 3.57 | — |
| 2025-11 | 3.93 | 3.87 | 4.29 | 3.72 | 3.85 | 1.16 |
| 2025-12 | 3.73 | 3.85 | 4.4 | 3.7 | 3.81 | 0.98 |
| 2026-01 | 3.66 | 3.74 | 4.23 | 3.56 | 3.9 | 1.25 |
| 2026-02 | 3.7 | 3.99 | 4.33 | 3.63 | 4.02 | 1.25 |
| 2026-03 | 3.43 | 4.33 | 3.63 | 3.26 | 3.65 | 0.18 |
| 2026-04 | 3.57 | 4.27 | 4.3 | 3.66 | 3.32 | -0.27 |
| 2026-05 | 3.34 | 4.41 | 3.96 | 4.01 | 3.41 | -0.8 |
| 2026-06 | 3.41 | 4.34 | 3.87 | 3.96 | 3.53 | 0 |
| 2026-07 | 3.15 | 4.35 | 3.83 | 3.59 | 3.52 | -0.18 |
Jobs versus pay since January 2025

View exact chart values
| industry | jobs_pct_since_jan2025 | wages_pct_since_jan2025 |
|---|---|---|
| Construction | 0.96 | 6.12 |
| Manufacturing | -0.49 | 6.16 |
| Leisure and hospitality | 0.59 | 5.02 |
| Transportation and warehousing | -1.03 | 5.12 |
| Total (nonfarm jobs / private wages) | 0.37 | 4.97 |
What these numbers cannot do
Three caveats belong next to the findings, not in a footnote. First, these are establishment payrolls. They do not identify native-born versus foreign-born workers, so they cannot confirm or refute Zandi’s claim that native-born unemployment has risen relative to immigrant unemployment. They also do not measure the self-employed, farm labour, or people who left the labour force. Second, average hourly earnings mix new hires, overtime and occupational mix. If a sector loses lower-paid jobs faster than higher-paid ones, average pay can rise while the typical worker is no better off. Manufacturing’s combination of falling headcount and rising hourly pay is exactly the pattern that invites that reading, and the data here cannot rule it in or out. Third, nothing in a payroll print is a causal estimate of immigration policy. Tariffs, the Iran war, high interest rates and a cooling consumer are all in the same 18 months. The Fortune piece itself called those “three massive, policy-induced supply-side shocks,” with AI the only thing keeping the economy from “complete shambles.”
CES figures are also revised. This analysis uses the Bureau’s all-history extract in a 24 August 2026 snapshot, covering January 2019 through July 2026, seasonally adjusted, with no duplicate months and a single missing real-earnings observation. Later annual benchmark revisions can move the 2025 and 2026 levels. The direction of the recent story — slow jobs, modest nominal pay, flat real pay — would have to be rewritten wholesale to rescue “leaps and bounds.”
The midterm arithmetic
The political argument was never really about tenths of a percent on a BLS print. It was about whether a voter in a hard hat, a warehouse, or a hotel kitchen would feel richer because the border was quieter. Payrolls say construction has added a little work and a little extra pay relative to everyone else. Factories and freight have not added work. Real private hourly earnings have gone nowhere. July’s 23,000-job decline arrived in the same week that retail sales fell 0.6 percent and consumer sentiment slumped to 51. If the administration wants credit for a labour-market transformation, it will need a different dataset, or a different 18 months.
That does not make the White House line a fabrication so much as a rounding error with a press secretary. Construction wages have outpaced the average. Data centres are real. A smaller immigrant labour force can raise pay in a specific occupation even as it leaves shifts unfilled. The CES ledger simply refuses to turn that into a boom. For readers trying to square a MAGA voter watching ICE take his wife off a Burbank jetway with a spokesman talking about leaping wages, the honest summary is narrower: the industries Washington keeps naming are not collapsing, they are not taking off, and the raise, once prices are in the picture, is the kind you notice only if you live inside a spreadsheet.
Sources and methods
This is retrospective enrichment using a pinned Current Employment Statistics snapshot dated 24 August 2026, not a reconstruction of what was knowable on the 16 August 2026 edition date. Later revisions may be present.
Series are national, monthly, and seasonally adjusted. They cover total nonfarm employment; construction, manufacturing, leisure and hospitality, transportation and warehousing, and mining and logging employment; average hourly earnings of all employees for total private and those industries; and inflation-adjusted private hourly earnings in 1982–84 dollars.
The observation window is January 2019 through July 2026. Employment is in thousands of jobs; earnings are in dollars per hour. Nulls were not treated as zero. No duplicate months appeared in the employment or nominal-earnings extracts. The real private earnings series has one missing month (October 2025); year-over-year calculations skip pairs that lack a prior-year value.
Index charts use January 2025 = 100. Job and wage changes compare January 2025 with July 2026. Year-over-year percent changes compare each month with the same month a year earlier. These payrolls cannot identify workers by nativity or citizenship, and average hourly earnings can rise when lower-paid jobs disappear. No causal effect of immigration, tariffs or the Iran war is inferred from these descriptive comparisons.
Official CES documentation is linked in the sources list. Figures take values only from the saved calculation tables.
Research completed 2026-09-11, for the August 16, 2026 news edition. This is retrospective analysis, not a reconstruction of information available that day.