Research
The maternity wards vanished. Missouri’s hospital payroll did not.
A desert on the map, not a collapse on the payroll
Today’s reporting from the Missouri Ozarks is about distance. Doula Melanie Pierce’s clients in Mansfield call when contractions start and ask a question that would sound odd in St. Louis: is it time to leave? March of Dimes now counts more than half of Missouri counties as maternity-care deserts — no labor-and-delivery unit, no obstetric doctor — against 35 percent of counties nationwide. Nearly 140,000 women of childbearing age live in those counties. In Reynolds and Douglas counties the drive can exceed an hour.
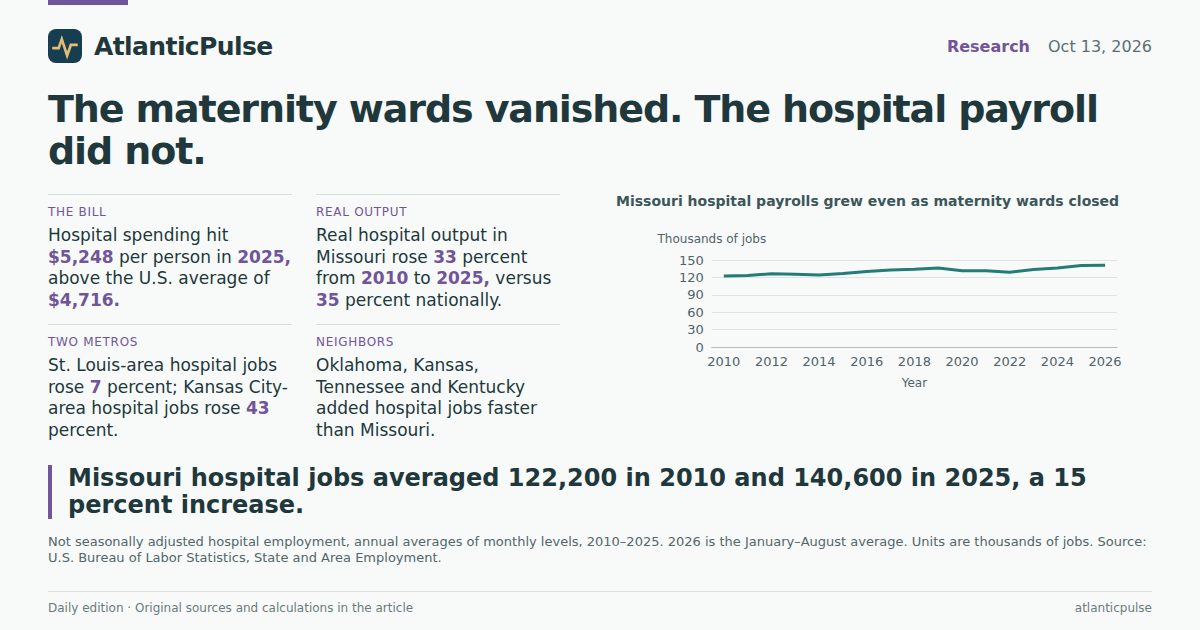
That geography is real. It is not the same thing as a hospital industry in retreat. On the official payroll, Missouri hospitals employed an annual average of 122,200 people in 2010 and 140,600 in 2025, a 15 percent increase, according to not seasonally adjusted figures from the U.S. Bureau of Labor Statistics. August 2026, the latest month in the snapshot, stood at 141,300, versus 121,500 in August 2010. The first eight months of 2026 averaged 140,900. If you are looking for the vanished maternity ward in those statewide totals, you will not find it. You will find a larger hospital workforce, not a smaller one.
The broader health-care and social-assistance payroll, which is seasonally adjusted and includes clinics, nursing homes and social services, grew faster still: 365,100 jobs in 2010 to 468,900 in 2025, or 28 percent. Total nonfarm employment in Missouri rose 12 percent over the same span. Closing a labor unit in a county that never had 200 births a year — the viability threshold rural administrators cited to University of Minnesota researchers — can happen while the rest of the hospital keeps hiring.
Missouri hospital payrolls grew even as maternity wards closed

View exact chart values
| year | missouri_hospitals_thousands |
|---|---|
| 2010 | 122.2 |
| 2011 | 123.3 |
| 2012 | 126.4 |
| 2013 | 125.6 |
| 2014 | 124.2 |
| 2015 | 126.6 |
| 2016 | 130 |
| 2017 | 132.7 |
| 2018 | 134.2 |
| 2019 | 136 |
| 2020 | 131.6 |
| 2021 | 131.3 |
| 2022 | 129 |
| 2023 | 133.8 |
| 2024 | 136.2 |
| 2025 | 140.6 |
| 2026 | 140.9 |
The bill rose much faster than the headcount
Households, meanwhile, have been paying a different kind of premium. Missouri residents spent $17.5 billion on hospital services in 2010 and $32.9 billion in 2025, an 88 percent increase in current dollars, according to Bureau of Economic Analysis personal consumption expenditures. That is spending by households on hospital care, not a hospital’s internal budget and not a claim about who is delivering babies. Per person, the hospital line went from $2,922 in 2010 to $5,248 in 2025. The U.S. average in 2025 was $4,716. Missouri sits above the national figure and above Kansas, Iowa, Arkansas, Oklahoma and Tennessee among the neighboring states that publish the same series.
Population cannot explain the gap. Missouri’s midyear population rose 4.6 percent from 2010 to 2025, from 5.996 million to 6.270 million. The hospital bill per person nearly doubled. Broader household health-care spending, which also includes outpatient and nursing-home services, climbed from $5,603 per person in 2010 to $10,742 in 2025, a 92 percent increase, versus $10,442 for the United States. The official books say Missourians are consuming more hospital care, or paying more for it, or both. They do not say rural women are getting closer to an obstetrician.
Inflation-adjusted hospital output tells a quieter story. Real GDP in Missouri hospitals, in chained 2017 dollars, rose 33 percent from 2010 to 2025, according to BEA industry accounts. The U.S. hospital industry rose 35 percent. Nominal hospital GDP in Missouri almost doubled, from $8.9 billion to $17.3 billion. In other words: the price of hospital care did a lot of the work. Real activity grew. It did not grow like a boom.
Missouri’s hospital bill per person sits above the U.S. average

View exact chart values
| state | dollars_per_person |
|---|---|
| Tennessee | 4002 |
| Arkansas | 4430 |
| United States | 4716 |
| Kansas | 4764 |
| Iowa | 4859 |
| Oklahoma | 5104 |
| Missouri | 5248 |
| Illinois | 5287 |
| Nebraska | 5447 |
| Kentucky | 5766 |
Inflation-adjusted hospital output rose, but not faster than the country

View exact chart values
| year | missouri | united_states |
|---|---|---|
| 2010 | 100 | 100 |
| 2011 | 98.9 | 101.9 |
| 2012 | 102.5 | 103.7 |
| 2013 | 102.9 | 104.7 |
| 2014 | 100.9 | 107 |
| 2015 | 106.8 | 112 |
| 2016 | 108.7 | 113.9 |
| 2017 | 112.8 | 116.6 |
| 2018 | 115.6 | 119.2 |
| 2019 | 118.8 | 120.9 |
| 2020 | 115.4 | 121.6 |
| 2021 | 119.6 | 124.9 |
| 2022 | 121.6 | 126.3 |
| 2023 | 126.8 | 127.3 |
| 2024 | 129 | 131.5 |
| 2025 | 132.5 | 134.9 |
Neighbors hired faster. The two big metros did not move as one.
Compared with states that share a border or a labor market, Missouri’s hospital hiring looks middle-of-the-pack, and a little slow. From 2010 to 2025, hospital employment rose 25 percent in Oklahoma, 24 percent in Kansas and Tennessee, and 23 percent in Kentucky. Illinois, whose St. Louis suburbs sit inside the same metro series, rose 13 percent. Nebraska rose 12 percent. Missouri’s 15 percent gain is not a collapse. It is also not the hiring surge a reader might imagine if the only number in the story were a statewide health-care boom.
The metro maps are messier, and they have to be read with a warning label. The St. Louis and Kansas City hospital series cover multi-state metros; they are not slices of the Missouri statewide total and cannot be added together without double-counting other states. With that caveat: St. Louis hospital jobs rose 7 percent from 2010 to 2025, from 73,100 to 78,000. Kansas City hospital jobs rose 43 percent, from 34,500 to 49,200. Springfield, a Missouri-only metro that sits on the edge of the Ozarks maternity-desert belt, does not publish a hospital series in this snapshot, but its broader health-care and social-assistance payroll rose 45 percent, from 32,200 to 46,900. Joplin, another Ozarks gateway, rose 23 percent on that same broader measure, from 12,500 to 15,300.
None of those series counts obstetricians in Reynolds County. They do show that the places with hospitals have not been emptying out. Kansas City and Springfield have been adding health jobs at a clip the statewide hospital line conceals. St. Louis has not. If maternity care is concentrating, the official employment record is at least consistent with a world in which the remaining units sit in larger metros — and in which even some of those metros are not hiring hospital workers very fast.
Missouri added hospital jobs slower than several neighbors

View exact chart values
| year | missouri | kansas | illinois | oklahoma |
|---|---|---|---|---|
| 2010 | 100 | 100 | 100 | 100 |
| 2011 | 100.8 | 102 | 100.6 | 99.2 |
| 2012 | 103.4 | 103.1 | 101.1 | 101.4 |
| 2013 | 102.8 | 104.6 | 100.3 | 102.8 |
| 2014 | 101.6 | 104.8 | 100.1 | 101.2 |
| 2015 | 103.6 | 107.2 | 100.8 | 101.4 |
| 2016 | 106.3 | 108.9 | 103.2 | 101.2 |
| 2017 | 108.6 | 110.3 | 104.7 | 101.8 |
| 2018 | 109.8 | 110.9 | 105.5 | 103.2 |
| 2019 | 111.2 | 113.3 | 105.3 | 105 |
| 2020 | 107.7 | 112.6 | 102 | 102.3 |
| 2021 | 107.4 | 112.6 | 100.8 | 102.2 |
| 2022 | 105.5 | 115 | 101.3 | 104.5 |
| 2023 | 109.5 | 117.1 | 105.9 | 110.3 |
| 2024 | 111.5 | 121.2 | 109.5 | 117.4 |
| 2025 | 115 | 123.6 | 113 | 124.8 |
Kansas City hospital jobs ran ahead of St. Louis

View exact chart values
| year | missouri_hospitals | st_louis_hospitals | kansas_city_hospitals | springfield_hcsa | joplin_hcsa |
|---|---|---|---|---|---|
| 2010 | 100 | 100 | 100 | 100 | 100 |
| 2011 | 100.8 | 100.4 | 102.4 | 100.3 | 99.7 |
| 2012 | 103.4 | 102 | 105.4 | 102.7 | 98.9 |
| 2013 | 102.8 | 100.8 | 108.2 | 103.4 | 101 |
| 2014 | 101.6 | 98.8 | 111 | 105.4 | 99.7 |
| 2015 | 103.6 | 100.9 | 115.2 | 106.2 | 102.5 |
| 2016 | 106.3 | 104 | 119.5 | 106.8 | 103.7 |
| 2017 | 108.6 | 105.8 | 122.6 | 109.7 | 105.9 |
| 2018 | 109.8 | 106.8 | 123.7 | 111.7 | 106.8 |
| 2019 | 111.2 | 107.8 | 125.2 | 116.3 | 108.5 |
| 2020 | 107.7 | 103.5 | 122.5 | 117 | 105.5 |
| 2021 | 107.4 | 103.7 | 122.2 | 117.9 | 105.2 |
| 2022 | 105.5 | 100.2 | 124.5 | 120.3 | 106.6 |
| 2023 | 109.5 | 102.8 | 128.7 | 127.9 | 112.2 |
| 2024 | 111.5 | 104.4 | 136.1 | 138.6 | 119.5 |
| 2025 | 115 | 106.7 | 142.5 | 145.3 | 122.6 |
What the books cannot see
The honest limit of this evidence is the thing the reporting is actually about. BLS hospital employment is NAICS 622: inpatient facilities. It does not isolate labor-and-delivery nurses, obstetricians, or rural versus urban hospitals. BEA hospital spending is what households consume, not what a county hospital needs to keep a maternity ward open. Real GDP in hospitals is an industry total, chain-weighted and not additive across sectors. A 15 percent rise in statewide hospital jobs can coexist with nine counties losing obstetric services between 2010 and 2024, which is what University of Minnesota researchers found, and with the earlier disappearances that predated their dataset.
Seasonal adjustment also differs across series. The hospital payroll used here is not seasonally adjusted; the statewide health-care and total-nonfarm figures are. Annual averages of twelve monthly observations dampen that problem for 2010–2025. The 2026 hospital average is eight months, not a full year. Metro caveats are material: St. Louis includes Illinois, Kansas City and Joplin include Kansas. Dictionary presence of a state in BEA tables is not a substitute for a county obstetric count, and this catalogue does not have one.
The payoff for readers is narrower, and still useful. Missouri’s maternity-care desert is not showing up as a vanishing hospital industry. The hospital payroll grew. The hospital bill grew faster. Several neighboring states hired hospital workers faster still. The smallest counties can lose the one service that has to exist on the night a woman goes into labor while the official books, written at the state and metro level, keep adding health jobs somewhere else. Pierce can still be right about the drive. The statewide payroll can still be larger than it was in 2010. Both things are in the record.
Sources and methods
Figures use a BLS State and Area Employment snapshot dated 2026-08-24 and BEA state PCE, GDP and population releases dated 2026-09-30. Observation years are calendar years in those vintages, not current-day readings, and provider lag is normal.
Hospital jobs are not seasonally adjusted (NAICS 622). Annual averages use twelve monthly observations for 2010–2025. The 2026 average uses January–August only and is labeled as year-to-date. Duplicate period rows were dropped by keeping the first observation per period.
Missouri health-care and social-assistance and total-nonfarm payrolls are seasonally adjusted and are not mixed with hospital NSA levels except as separately identified comparisons. St. Louis (MO-IL) and Kansas City (MO-KS) hospital series cover multi-state metros and are not subsets of Missouri statewide hospital employment. Springfield and Joplin series are health care and social assistance, not hospitals.
Hospital personal consumption expenditures are household spending on hospital services in current dollars. Per-person figures divide those totals by BEA midyear resident population. They are not household averages of out-of-pocket bills and are not hospital operating budgets.
Real hospital GDP is in millions of chained 2017 dollars. Chain-weighted industry values are not additive. Nominal hospital GDP is a separate current-dollar series. No causal claim is made that maternity-ward closures caused, or were caused by, statewide job or spending changes. County-level obstetric counts are not in this catalogue.
Research completed 2026-10-14, for the October 13, 2026 news edition. The available source data may cover earlier periods; see the observation periods and source vintages above.