Research
The last time confidence was this low, real incomes were a quarter smaller
A 12-year low that is not a 2014 paycheck
The Conference Board said Tuesday that its consumer-confidence index had fallen 6.7 points to 81.9 in September, the weakest reading since 2014. Present conditions were the worst since 2021. Dana Peterson, the board’s chief economist, said write-in complaints about prices — especially oil and petrol — “rose to new heights.” AAA put regular gasoline near $4.48 a gallon, up from $3.13 a year earlier, after President Donald Trump rejected an Iranian offer to reopen the Strait of Hormuz. A separate Credit One survey found 57% of adults now routinely finish the month with less money than they expected.
That pairing — a 12-year confidence low and a kitchen-table squeeze — invites a simple question the polls cannot answer. Was 2014 also a year of thin pay, or have official living standards moved even as the mood collapsed? The Bureau of Economic Analysis publishes real per capita personal income in constant 2017 dollars, which strips out price changes and divides by population. It is an average, not a median household, and it stops at 2024, before this year’s oil shock. It is still the cleanest official ruler for the last time confidence looked like this.
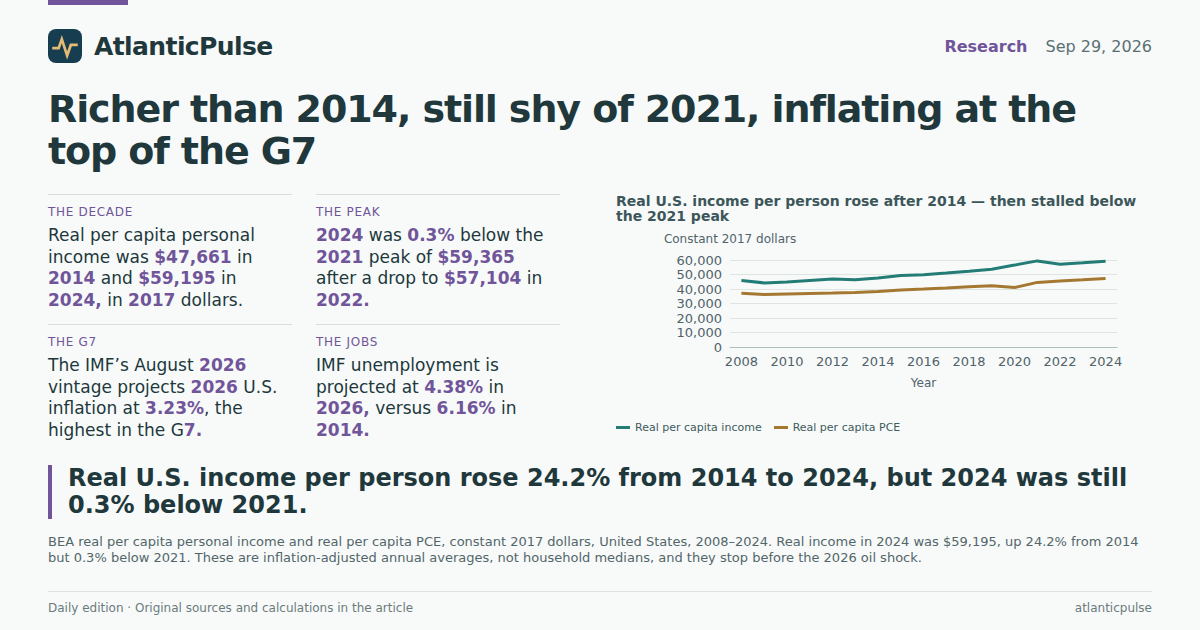
On that ruler, Americans were not stuck. Real income per person was $47,661 in 2014 and $59,195 in 2024, a 24.2% gain. Real per capita consumer spending rose 23.5%, from $38,296 to $47,304. The 2014 confidence trough was a much poorer country, in inflation-adjusted terms, than the 2026 one. Unemployment tells a similar story: the IMF’s annual U.S. jobless rate was 6.16% in 2014 and is projected at 4.38% in 2026 — worse than 2023’s 3.62%, but nowhere near the 2014 labour market.
Real U.S. income per person rose after 2014 — then stalled below the 2021 peak

View exact chart values
| year | real_pc_income | real_pc_pce |
|---|---|---|
| 2008 | 45816 | 37063 |
| 2009 | 44204 | 36260 |
| 2010 | 44808 | 36640 |
| 2011 | 45957 | 36969 |
| 2012 | 46796 | 37177 |
| 2013 | 46358 | 37540 |
| 2014 | 47661 | 38296 |
| 2015 | 49396 | 39273 |
| 2016 | 49828 | 39923 |
| 2017 | 51006 | 40693 |
| 2018 | 52242 | 41564 |
| 2019 | 53683 | 42238 |
| 2020 | 56514 | 41007 |
| 2021 | 59365 | 44542 |
| 2022 | 57104 | 45617 |
| 2023 | 58088 | 46400 |
| 2024 | 59195 | 47304 |
The raise that peaked in 2021
The same books show why the raise does not feel like a raise. Real income per person peaked at $59,365 in 2021, when pandemic transfers were still washing through the accounts, then dropped to $57,104 in 2022 as inflation took a bite. By 2024 it had recovered to $59,195 — still 0.3% below that 2021 high-water mark. Real spending kept climbing after 2021; real income did not quite get back.
That national average hides a spread. Among eight large states, California’s real income per person rose 32.8% from 2014 to 2024. Florida rose 30.4%. Pennsylvania rose only 16.4%; Texas 18.9%; Ohio 20.0%. Measured against 2021, several of those states are still underwater: Pennsylvania 4.2% lower, Michigan 3.8% lower, Ohio 1.9% lower, California 0.5% lower. Florida and Iowa were slightly above their 2021 levels. A country can be richer than 2014 and poorer than its own recent peak at the same time, depending on which year a household uses as the baseline.
Current-dollar spending on gasoline and other energy goods, a different BEA series that does not strip out prices, was $1,287 per person in 2014 and $1,295 in 2024 — almost unchanged, after a 2022 spike to $1,541. Grocery and off-premises beverage spending, by contrast, jumped 52.5%, from $2,852 to $4,350. Those 2024 figures are the last full official year. They do not include $4.48 gasoline in September 2026. The implication is awkward for anyone hoping the pump is a rerun of 2014: the last published year had already put the gasoline bill back near 2014 levels. The Hormuz war reopened a tab that the 2024 books had closed.
Since the last confidence trough, real income gains were real — and uneven

View exact chart values
| state | real_pc_income_2014 | real_pc_income_2024 | pct_change_2014_2024 | real_pc_income_2021 | pct_change_2021_2024 |
|---|---|---|---|---|---|
| Pennsylvania | 50343 | 58620 | 16.4 | 61217 | -4.2 |
| Texas | 48959 | 58219 | 18.9 | 56442 | 3.1 |
| Ohio | 46857 | 56232 | 20 | 57339 | -1.9 |
| Iowa | 50001 | 60144 | 20.3 | 59666 | 0.8 |
| Michigan | 44089 | 53569 | 21.5 | 55679 | -3.8 |
| United States | 47661 | 59195 | 24.2 | 59365 | -0.3 |
| New York | 51614 | 64153 | 24.3 | 64085 | 0.1 |
| Florida | 43812 | 57131 | 30.4 | 56789 | 0.6 |
| California | 47472 | 63028 | 32.8 | 63373 | -0.5 |
Several big states are still below their 2021 real-income peak

View exact chart values
| state | real_pc_income_2014 | real_pc_income_2024 | pct_change_2014_2024 | real_pc_income_2021 | pct_change_2021_2024 |
|---|---|---|---|---|---|
| Pennsylvania | 50343 | 58620 | 16.4 | 61217 | -4.2 |
| Texas | 48959 | 58219 | 18.9 | 56442 | 3.1 |
| Ohio | 46857 | 56232 | 20 | 57339 | -1.9 |
| Iowa | 50001 | 60144 | 20.3 | 59666 | 0.8 |
| Michigan | 44089 | 53569 | 21.5 | 55679 | -3.8 |
| United States | 47661 | 59195 | 24.2 | 59365 | -0.3 |
| New York | 51614 | 64153 | 24.3 | 64085 | 0.1 |
| Florida | 43812 | 57131 | 30.4 | 56789 | 0.6 |
| California | 47472 | 63028 | 32.8 | 63373 | -0.5 |
What the IMF already scored for 2026
The Conference Board is a monthly mood. The International Monetary Fund scores annual inflation, growth and unemployment, including projections. A World Economic Outlook snapshot dated 24 August 2026 — compiled before this week’s confidence print, and with 2026–2027 still treated here as projections — already had U.S. inflation rising again, to 3.23% in 2026 from 2.73% in 2025, after a 7.99% peak in 2022. That 2026 figure is the highest among G7 members in the same vintage. The United Kingdom is next at 3.20%. Germany is at 2.65%, Italy 2.64%, Canada 2.54%, Japan 2.24%, France 1.84%.
Growth is the other half of the scoreboard. The same IMF vintage has U.S. real GDP rising 2.32% in 2026, faster than Canada (1.50%) and far faster than the European members and Japan, all below 1%. The United States is, in that telling, the rich country that is both inflating the most and still expanding the most. It is not a recession forecast. It is a forecast of a squeeze: prices accelerating while the unemployment rate stays in the mid-fours.
That mix helps explain a confidence crash that does not look like 2014 on the labour-market tape. In 2014, inflation was 1.62% and 6.16% of the labour force was jobless. In the IMF’s 2026 projection, inflation is twice as high and unemployment is almost two points lower. Households can feel poorer because groceries and petrol are jumping even when the average real paycheck, measured with a lag, is larger than it was the last time the confidence index printed a number this ugly. The official income series cannot yet speak to September 2026. The IMF can speak only as of late summer, and only in annual averages. Both still beat a vibes-only reading of a 12-year low.
Among large rich economies, the IMF scored 2026 U.S. inflation the highest

View exact chart values
| country | inflation_2025 | inflation_2026 | gdp_growth_2026 |
|---|---|---|---|
| United States | 2.73 | 3.23 | 2.32 |
| United Kingdom | 3.37 | 3.2 | 0.8 |
| Germany | 2.3 | 2.65 | 0.79 |
| Italy | 1.63 | 2.64 | 0.52 |
| Canada | 2.08 | 2.54 | 1.5 |
| Japan | 3.17 | 2.24 | 0.72 |
| France | 0.93 | 1.84 | 0.86 |
The IMF’s 2026 U.S. path: inflation ticks up, unemployment stays far below 2014

View exact chart values
| year | inflation_pct | gdp_growth_pct | unemployment_pct |
|---|---|---|---|
| 2010 | 1.64 | 2.7 | 9.61 |
| 2011 | 3.14 | 1.56 | 8.93 |
| 2012 | 2.07 | 2.29 | 8.07 |
| 2013 | 1.47 | 2.12 | 7.36 |
| 2014 | 1.62 | 2.52 | 6.16 |
| 2015 | 0.12 | 2.95 | 5.28 |
| 2016 | 1.27 | 1.82 | 4.88 |
| 2017 | 2.13 | 2.46 | 4.36 |
| 2018 | 2.44 | 2.97 | 3.89 |
| 2019 | 1.81 | 2.58 | 3.67 |
| 2020 | 1.25 | -2.08 | 8.1 |
| 2021 | 4.68 | 6.15 | 5.35 |
| 2022 | 7.99 | 2.52 | 3.65 |
| 2023 | 4.13 | 2.93 | 3.62 |
| 2024 | 2.95 | 2.79 | 4.03 |
| 2025 | 2.73 | 2.12 | 4.28 |
| 2026 | 3.23 | 2.32 | 4.38 |
| 2027 | 2.14 | 2.1 | 4.25 |
Sources and methods
Real per capita personal income and real per capita PCE are BEA SARPI annual series in constant 2017 dollars for the United States and selected states, 2008 or 2014 through 2024, from the 19 February 2026 regional price-parities release. They are population averages, not medians or household totals. 2021 includes pandemic transfers.
Per capita spending on gasoline and other energy goods and on food and beverages purchased for off-premises consumption are BEA SAPCE2 current-dollar annual series through 2024 (26 September 2025 release). The food series includes alcoholic beverages bought for home use. Current dollars mix prices and volumes. They do not include 2025–2026 petrol prices.
IMF series are annual World Economic Outlook values stored as 1 January dates, from a catalogue snapshot dated 24 August 2026 (extract run 10 August 2026). Inflation is average consumer prices; growth is constant-price GDP. Figures for 2026 and 2027 are treated as projections. 2025 may mix estimate and projection. G7 comparisons use the same vintage only.
State results cover California, Texas, Florida, New York, Pennsylvania, Ohio, Michigan and Iowa plus the national total, not a 50-state ranking. Missing observations were not treated as zero. No causal claim is made that confidence fell because of these series, or that 2026 inflation will match the August IMF projection after later oil moves.
Research completed 2026-09-30, for the September 29, 2026 news edition. The available source data may cover earlier periods; see the observation periods and source vintages above.