Research
The interceptor shortage is real. The factory payroll is still small.
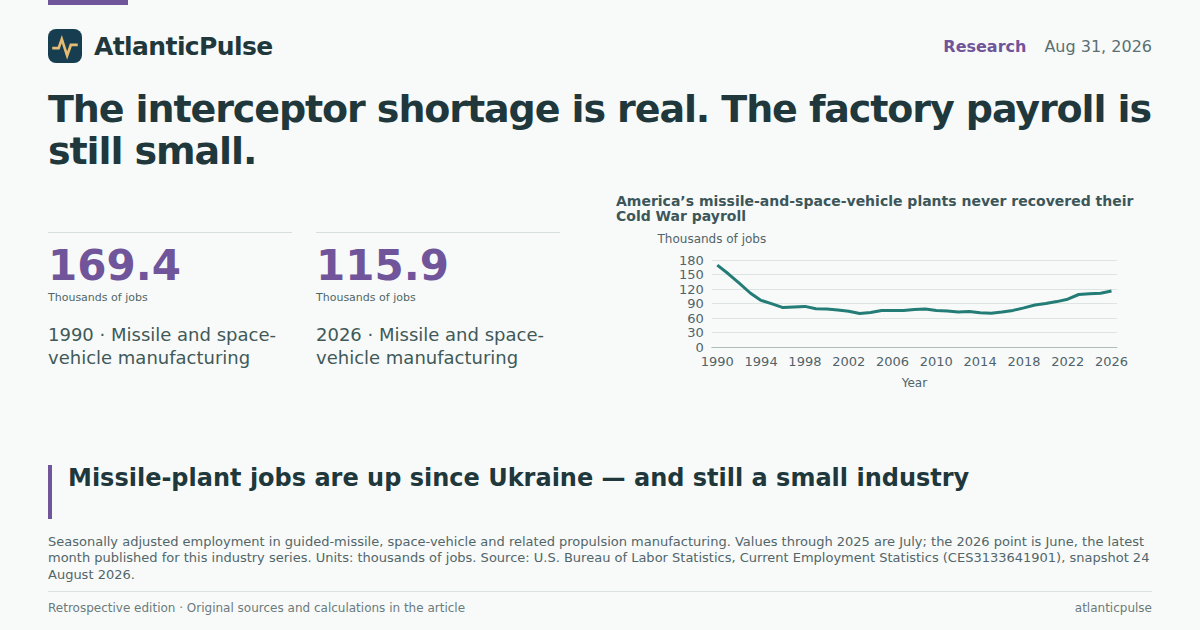
A seven-year contract meets a 116,000-person industry
On the last day of August, the Pentagon announced seven-year framework deals with General Dynamics and Lockheed Martin meant to triple production of Patriot PAC-3 MSE interceptors and quadruple THAAD output. The motive was not subtle. Four-star officers had warned Pete Hegseth that prolonging large-scale operations against Iran was unsustainable; independent estimates put remaining U.S. stocks at fewer than 1,000 Patriots and roughly 250 THAAD missiles. A war that began on 28 February had just flared again in the Strait of Hormuz. Contracts were the policy answer.
Contracts do not hire people by themselves. The Bureau of Labor Statistics keeps a seasonally adjusted count of jobs in guided-missile, space-vehicle and related propulsion manufacturing — the closest official payroll to the plants that actually build interceptors, boosters and the space-side cousins of that work. As of June 2026, the latest month in the CES snapshot, that industry employed 115,900 people. That is 0.9 percent of U.S. manufacturing employment. It is smaller than ship and boat building (149,200) and less than half of aircraft manufacturing (265,100). Oil and gas extraction, which does not make missiles, employed almost the same number of people (115,100).
The comparison is the point. A country that is burning interceptors over the Gulf and talking about tripling output is asking a workforce of about 116,000 — including space-vehicle work that has nothing to do with Patriots — to do something American factories have not done at scale in a generation. The payroll numbers do not say the contracts will fail. They say the industrial base the contracts are buying is still, by American manufacturing standards, a boutique.
The interceptor shortage is not a large factory workforce

View exact chart values
| industry | jobs_thousands |
|---|---|
| Small arms, ammunition and other ordnance | 55.9 |
| Oil and gas extraction | 115.1 |
| Guided missile and space vehicle manufacturing | 115.9 |
| Search, detection and navigation instruments | 130.1 |
| Ship and boat building | 149.2 |
| Aircraft manufacturing | 265.1 |
The Cold War plant is gone. A slow rebuild is not a surge.
In January 1990, as the Soviet Union was coming apart, the same missile-and-space-vehicle series stood at 172,400 jobs. By July 2003 it had fallen to 69,400. That is the trough. The subsequent rebuild has been real and slow: 78,500 in July 2000, 75,800 in July 2010, 90,000 in July 2020. June 2026’s 115,900 jobs are 32.8 percent below the January 1990 level even after four years of European war and four months of a second Middle East war.
The series mixes missiles with space vehicles, so some of the recent gain is SpaceX and its peers, not THAAD lines in Alabama or Arizona. That caveat cuts both ways. If part of the 116,000 is building Starships rather than interceptors, the interceptor-relevant workforce is even smaller than the headline. Either way, the country is not sitting on a hidden Cold War arsenal of idle missile machinists.
Ammunition and ordnance plants tell a flatter story. Small-arms, ammunition and other ordnance manufacturing employed 55,900 in June 2026, up only 4.3 percent from February 2022. Ship and boat building, the other heavy industrial cousin of a long war, was essentially unchanged: 149,200 versus 150,000. Total manufacturing employment in June 2026 was 12.61 million, the same as in February 2022 to a rounding error. The missile line moved. The rest of the factory floor did not enlist.
America’s missile-and-space-vehicle plants never recovered their Cold War payroll

View exact chart values
| year | missile_thousands | aerospace_thousands | ordnance_thousands | ship_thousands |
|---|---|---|---|---|
| 1990 | 169.4 | 846.1 | 74.9 | 176.5 |
| 1991 | 151.4 | 779.2 | 70.2 | 163.4 |
| 1992 | 132.2 | 709.3 | 65.9 | 157.8 |
| 1993 | 111.7 | 618.9 | 59.1 | 146.2 |
| 1994 | 96.4 | 547 | 53.9 | 148.2 |
| 1995 | 89.2 | 514.1 | 51.1 | 147.1 |
| 1996 | 81.6 | 511.1 | 47.7 | 147.5 |
| 1997 | 83 | 558.2 | 43.5 | 145.2 |
| 1998 | 84 | 581 | 42.2 | 155.3 |
| 1999 | 79.1 | 543.9 | 41.6 | 149.2 |
| 2000 | 78.5 | 516.7 | 38.4 | 156.1 |
| 2001 | 76.7 | 513.4 | 39.6 | 147.1 |
| 2002 | 73.8 | 468.1 | 39.7 | 148 |
| 2003 | 69.4 | 438.4 | 39.2 | 145.8 |
| 2004 | 71.6 | 441.9 | 40.9 | 149.1 |
| 2005 | 75.7 | 459.7 | 42.3 | 156.7 |
| 2006 | 75.6 | 474.9 | 41.7 | 158.6 |
| 2007 | 75.5 | 488.2 | 41.6 | 158.8 |
| 2008 | 77.5 | 510.1 | 42.6 | 156.5 |
| 2009 | 78.6 | 487.8 | 42.7 | 129 |
| 2010 | 75.8 | 477 | 42.2 | 126.1 |
| 2011 | 74.5 | 488.7 | 41.2 | 120.1 |
| 2012 | 72.7 | 499.9 | 42.3 | 128.4 |
| 2013 | 73.4 | 487.5 | 44.3 | 132.4 |
| 2014 | 71 | 490.8 | 43.8 | 138.5 |
| 2015 | 69.7 | 488.7 | 41 | 137.8 |
| 2016 | 72.4 | 492.3 | 44.7 | 135 |
| 2017 | 75.7 | 488 | 44 | 134.3 |
| 2018 | 80.9 | 508.5 | 44.6 | 139.1 |
| 2019 | 86.8 | 536.3 | 43.3 | 142.7 |
| 2020 | 90 | 502.1 | 46.6 | 135.9 |
| 2021 | 93.9 | 479.3 | 53.8 | 147.8 |
| 2022 | 98.9 | 501.3 | 54.5 | 147.6 |
| 2023 | 108.6 | 540.1 | 54.3 | 154.5 |
| 2024 | 110.1 | 569.2 | 54.7 | 151.6 |
| 2025 | 111.3 | 568.5 | 55.2 | 149.5 |
| 2026 | 115.9 | 591.6 | 55.9 | 149.2 |
Ukraine moved the payroll. Iran, so far, has not.
Index the same series to February 2022, the month Russia’s full-scale invasion of Ukraine began, and the split is obvious. Guided-missile and space-vehicle employment is up 22.5 percent through June 2026. Aerospace product and parts as a whole, which includes commercial aircraft, is up 21.5 percent. Shipbuilding is down 0.5 percent. All manufacturing is unchanged. Ammunition and ordnance are up 4.3 percent. That is not a wartime mobilization of the industrial base. It is one slice of aerospace hiring while the rest of manufacturing treads water.
The Iran war, which began on 28 February 2026, has so far added almost nothing. From February to June 2026 the missile-and-space-vehicle payroll rose from 114,300 to 115,900 — 1,600 jobs, or 1.4 percent. Four months is a short window, and CES will revise. It is still the window that includes the first U.S. strikes, the June memorandum of understanding, the July “heavy wave,” the August lull and the Larak Island raid that ended it. If interceptor consumption is “beyond critical,” the hiring response has not yet shown up as a break in the national series.
Overtime is the other place a surge would appear. Average weekly overtime in aerospace product and parts — a broader industry that includes Boeing as well as missile work — was 3.2 hours in June 2026. That is above the 2.0 hours of July 2020 and in line with the pre-pandemic 3.2 hours of July 2019. It is well below the 4.1 hours of July 2011. Plants can run extra shifts without a headline hiring boom. They do not appear to be doing that at a wartime clip.
Missile plants hired after Ukraine. Shipbuilding and the rest of manufacturing did not.

View exact chart values
| period | missile | ordnance | shipbuilding | manufacturing | aerospace |
|---|---|---|---|---|---|
| 2019-01 | 89.6 | 85.8 | 93.8 | 101.5 | 107.9 |
| 2019-02 | 90.6 | 85.1 | 94 | 101.4 | 108.2 |
| 2019-03 | 90.8 | 83.8 | 94.6 | 101.5 | 108.4 |
| 2019-04 | 91.2 | 83.6 | 94.9 | 101.5 | 108.8 |
| 2019-05 | 91.6 | 83.4 | 95 | 101.4 | 109.4 |
| 2019-06 | 91.6 | 83.6 | 95.3 | 101.5 | 109.6 |
| 2019-07 | 91.8 | 80.8 | 95.1 | 101.5 | 110.1 |
| 2019-08 | 92.1 | 82.6 | 95.1 | 101.5 | 110.2 |
| 2019-09 | 92.4 | 83.4 | 95.4 | 101.5 | 110.5 |
| 2019-10 | 93.4 | 84.1 | 95.3 | 101 | 111 |
| 2019-11 | 93.3 | 85.4 | 95.5 | 101.4 | 111 |
| 2019-12 | 93.6 | 86.9 | 95.7 | 101.3 | 111.5 |
| 2020-01 | 94 | 87.5 | 95.9 | 101.1 | 111.2 |
| 2020-02 | 94.1 | 88.4 | 95.9 | 101.1 | 110.9 |
| 2020-03 | 94.3 | 83.8 | 95.8 | 100.7 | 111 |
| 2020-04 | 94.2 | 86.6 | 83 | 90.3 | 106.5 |
| 2020-05 | 94.3 | 88.1 | 90.2 | 92.1 | 105.6 |
| 2020-06 | 94.3 | 88.6 | 92.5 | 94.8 | 103.3 |
| 2020-07 | 95.1 | 86.9 | 90.6 | 95 | 103.1 |
| 2020-08 | 95.5 | 89.2 | 90.8 | 95.2 | 101.7 |
| 2020-09 | 95.3 | 91.2 | 94.5 | 95.7 | 100.6 |
| 2020-10 | 95 | 92.4 | 96.1 | 95.9 | 99 |
| 2020-11 | 95.9 | 93.7 | 96.4 | 96.2 | 98.5 |
| 2020-12 | 95.9 | 94 | 96.6 | 96.4 | 97.8 |
| 2021-01 | 97.3 | 94.4 | 97.3 | 96.4 | 97.4 |
| 2021-02 | 97.7 | 95.1 | 97.3 | 96.6 | 99.7 |
| 2021-03 | 98.2 | 96.1 | 97.4 | 97 | 98.9 |
| 2021-04 | 98.6 | 96.6 | 97.6 | 96.8 | 98.9 |
| 2021-05 | 98.9 | 97.9 | 97.4 | 96.9 | 97.9 |
| 2021-06 | 99.3 | 99.1 | 98.3 | 97.2 | 98.8 |
| 2021-07 | 99.3 | 100.4 | 98.5 | 97.7 | 98.4 |
| 2021-08 | 99.4 | 100 | 98.9 | 98 | 98.4 |
| 2021-09 | 99.5 | 101.3 | 99.9 | 98.3 | 98.7 |
| 2021-10 | 99.6 | 100.9 | 99.2 | 98.8 | 98.7 |
| 2021-11 | 99.4 | 101.1 | 99 | 99.2 | 99.1 |
| 2021-12 | 99.5 | 100.9 | 99.3 | 99.5 | 99.1 |
| 2022-01 | 99.5 | 100.6 | 99.2 | 99.7 | 99.6 |
| 2022-02 | 100 | 100 | 100 | 100 | 100 |
| 2022-03 | 100.7 | 99.8 | 100 | 100.6 | 100.7 |
| 2022-04 | 101.5 | 98.7 | 100.6 | 101 | 101.2 |
| 2022-05 | 102.5 | 98.7 | 100.3 | 101.1 | 101.7 |
| 2022-06 | 103.5 | 100.7 | 100.4 | 101.3 | 102.4 |
| 2022-07 | 104.5 | 101.7 | 98.4 | 101.6 | 102.9 |
| 2022-08 | 106 | 100.6 | 99.9 | 101.8 | 103.8 |
| 2022-09 | 106.6 | 100 | 100.3 | 102 | 104.2 |
| 2022-10 | 107.5 | 99.6 | 101.6 | 102.2 | 105.1 |
| 2022-11 | 108.6 | 99.8 | 101.4 | 102.3 | 105.5 |
| 2022-12 | 109.4 | 99.6 | 101.7 | 102.3 | 106.2 |
| 2023-01 | 109.3 | 100.6 | 101.9 | 102.4 | 106.2 |
| 2023-02 | 110.5 | 100.7 | 102.1 | 102.4 | 107.2 |
| 2023-03 | 111.2 | 101.1 | 102.9 | 102.3 | 107.6 |
| 2023-04 | 112.1 | 102.1 | 102.7 | 102.2 | 107.7 |
| 2023-05 | 112.5 | 102.4 | 102.9 | 102.1 | 108.7 |
| 2023-06 | 113.8 | 101.3 | 103 | 102.2 | 110.2 |
| 2023-07 | 114.8 | 101.3 | 103 | 102.1 | 110.9 |
| 2023-08 | 114.6 | 102.2 | 102.7 | 102.1 | 111.4 |
| 2023-09 | 115.3 | 101.1 | 102.1 | 102.2 | 111.8 |
| 2023-10 | 116.1 | 101.5 | 102.1 | 101.9 | 112.5 |
| 2023-11 | 116.6 | 100.4 | 102.3 | 102 | 113.5 |
| 2023-12 | 116.9 | 101.1 | 102.7 | 102.2 | 114.2 |
| 2024-01 | 117.2 | 100.4 | 101.7 | 102.2 | 114.9 |
| 2024-02 | 117.3 | 101.1 | 101 | 102 | 115.3 |
| 2024-03 | 117.2 | 101.5 | 101.3 | 101.9 | 115.5 |
| 2024-04 | 117.5 | 102.2 | 101.5 | 101.8 | 116.2 |
| 2024-05 | 117.3 | 101.9 | 101.6 | 101.8 | 116.3 |
| 2024-06 | 116.7 | 102.2 | 102.1 | 101.7 | 116.6 |
| 2024-07 | 116.4 | 102.1 | 101.1 | 101.6 | 116.9 |
| 2024-08 | 115.6 | 100.9 | 99.9 | 101.4 | 116.7 |
| 2024-09 | 116.3 | 101.1 | 100.8 | 101.2 | 117.2 |
| 2024-10 | 116.3 | 102.6 | 100.6 | 100.8 | 109 |
| 2024-11 | 116.5 | 106.2 | 100.5 | 100.9 | 116.4 |
| 2024-12 | 116.6 | 102.8 | 100.6 | 100.7 | 116.7 |
| 2025-01 | 116.2 | 103.9 | 100.5 | 100.6 | 116 |
| 2025-02 | 116.8 | 104.9 | 100.4 | 100.6 | 116 |
| 2025-03 | 116.9 | 104.1 | 99.1 | 100.5 | 116 |
| 2025-04 | 116.7 | 103.2 | 99.8 | 100.5 | 116.1 |
| 2025-05 | 116.6 | 102.8 | 99.8 | 100.4 | 115.7 |
| 2025-06 | 117.1 | 102.6 | 99.6 | 100.3 | 116.4 |
| 2025-07 | 117.7 | 103 | 99.7 | 100.2 | 116.7 |
| 2025-08 | 118 | 102.4 | 99.6 | 100.1 | 116.8 |
| 2025-09 | 118.1 | 102.6 | 99.5 | 100.1 | 116.3 |
| 2025-10 | 118.4 | 102.1 | 99.5 | 100 | 116.9 |
| 2025-11 | 118.9 | 102.4 | 99.3 | 99.9 | 118.1 |
| 2025-12 | 119.9 | 103 | 99.2 | 99.8 | 118.6 |
| 2026-01 | 120.3 | 102.6 | 99.1 | 99.8 | 119 |
| 2026-02 | 120.8 | 103 | 99.1 | 99.9 | 119.1 |
| 2026-03 | 121.5 | 103.7 | 99.1 | 100 | 119.8 |
| 2026-04 | 122.1 | 101.1 | 99.1 | 100 | 120.2 |
| 2026-05 | 122.3 | 105 | 99.1 | 100 | 120.7 |
| 2026-06 | 122.5 | 104.3 | 99.5 | 100 | 121.5 |
Aerospace overtime is not running like a war economy

View exact chart values
| year | overtime_hours |
|---|---|
| 2010 | 3.6 |
| 2011 | 4.1 |
| 2012 | 3.3 |
| 2013 | 3.1 |
| 2014 | 3.2 |
| 2015 | 3.1 |
| 2016 | 3.1 |
| 2017 | 3.3 |
| 2018 | 3.3 |
| 2019 | 3.2 |
| 2020 | 2 |
| 2021 | 2.6 |
| 2022 | 3.1 |
| 2023 | 3 |
| 2024 | 2.7 |
| 2025 | 2.9 |
| 2026 | 3.2 |
The mix inside aerospace has barely changed
One hope for a hidden surge would be that missiles had taken a larger share of aerospace employment — that commercial-aircraft work was being crowded out, or at least that missile lines were growing faster than the rest of the hangar. The official mix does not show that. In July 1990, guided-missile and space-vehicle jobs were 20.0 percent of aerospace product-and-parts employment; aircraft manufacturing was 46.3 percent. In June 2026 the figures were 19.6 percent and 44.8 percent. The missile share dipped into the mid-teens in the 2010s and has returned to about one-fifth. That is a recovery of mix, not a transformation of the industry.
Aircraft and missile plants are both inside the aerospace total; adding them together with that total would double-count. The remaining aerospace jobs are engines and other parts. October 2024 shows a one-month plunge in the aircraft and aerospace series that reversed in November, consistent with a strike or similar disruption rather than a change in the weapons business. The missile series did not follow that dip.
State data, where they exist on a comparable June-to-June basis, are not a substitute for a missile-plant census. Not-seasonally-adjusted aerospace payrolls in Alabama rose from 13,500 in June 2022 to 16,100 in June 2026. Kansas rose from 28,100 to 33,200. Arizona rose from 30,400 to 32,500. Those are real local gains in a broader aerospace category that includes airliners. Monthly extracts for Washington, Texas and California did not return observations under the same filter, so this is not a national map of missile country. It is evidence that some of the states that actually assemble aerospace hardware have added jobs since Ukraine — and that even those additions are measured in a few thousand people, not tens of thousands.
Missiles are a fifth of the aerospace payroll — about the same mix as in 1990

View exact chart values
| year | missile_share_pct | aircraft_share_pct |
|---|---|---|
| 1990 | 20 | 46.3 |
| 1991 | 19.4 | 46.4 |
| 1992 | 18.6 | 47.7 |
| 1993 | 18 | 49.4 |
| 1994 | 17.6 | 50.1 |
| 1995 | 17.4 | 48.2 |
| 1996 | 16 | 48.3 |
| 1997 | 14.9 | 48.8 |
| 1998 | 14.5 | 48.6 |
| 1999 | 14.5 | 48.1 |
| 2000 | 15.2 | 46.9 |
| 2001 | 14.9 | 47.3 |
| 2002 | 15.8 | 47.1 |
| 2003 | 15.8 | 47.3 |
| 2004 | 16.2 | 46.9 |
| 2005 | 16.5 | 46.6 |
| 2006 | 15.9 | 46.6 |
| 2007 | 15.5 | 47.2 |
| 2008 | 15.2 | 47 |
| 2009 | 16.1 | 47.5 |
| 2010 | 15.9 | 47.8 |
| 2011 | 15.2 | 48.2 |
| 2012 | 14.5 | 48 |
| 2013 | 15.1 | 47.8 |
| 2014 | 14.5 | 48 |
| 2015 | 14.3 | 47.6 |
| 2016 | 14.7 | 47.3 |
| 2017 | 15.5 | 45.3 |
| 2018 | 15.9 | 45.3 |
| 2019 | 16.2 | 45.4 |
| 2020 | 17.9 | 45.4 |
| 2021 | 19.6 | 44.9 |
| 2022 | 19.7 | 44.8 |
| 2023 | 20.1 | 45.1 |
| 2024 | 19.3 | 45.8 |
| 2025 | 19.6 | 45.1 |
| 2026 | 19.6 | 44.8 |
What the payroll can and cannot say
None of this measures interceptor output, inventory, or how many PAC-3s a 116,000-person industry can actually deliver. CES counts jobs, not missiles. A plant can add robots, extra shifts, or foreign subcontractors without a matching payroll line. The guided-missile series includes space vehicles. The ammunition series includes commercial small arms. Shipbuilding includes yachts. Overtime is for all of aerospace, not missile plants alone. The snapshot ends in June 2026 for the detailed industries, two months before the latest Hormuz strikes and the seven-year contract announcement.
What the payroll can say is narrower and still useful. The United States does not have a large, idle missile-manufacturing workforce waiting for a purchase order. It has a specialized industry that shrank by a third after the Cold War, bottomed in 2003, and has been climbing for about a decade. Ukraine coincides with a 22 percent rise in that series. The Iran war, so far, does not. Ammunition plants and shipyards have not moved with it. Total manufacturing has not moved at all.
That is the industrial meaning of “beyond critical” stocks. The shortage is in the magazine, not because America forgot how to hire. It is because the hiring that did happen is still small relative to the wars the country is now fighting at the same time. A seven-year deal can change that. Four months of a second war have not, at least not in the official count of people who clock in to build the missiles.
Sources and methods
This is retrospective enrichment using the pinned BLS Current Employment Statistics snapshot of 24 August 2026 (raw intake 24 August 2026), not an as-known-on-31-August-2026 reconstruction. Later CES revisions may change the levels.
National series are seasonally adjusted monthly payrolls in thousands of jobs. Detailed industry series (guided missile/space vehicle, ammunition/ordnance, aerospace, aircraft, shipbuilding, navigation instruments, aerospace overtime) run through June 2026. Total manufacturing and oil-and-gas extraction also have July 2026; comparisons across industries use June 2026 unless noted.
History charts use July observations for 1990–2025 and June 2026 for the final point, because July 2026 is not in the detailed industry extracts. Captions state that mix.
One observation was kept per period_start. There were no duplicate period keys and no null values in the extracted CES series used here. Missing is not treated as zero.
Guided-missile and aircraft manufacturing are components of aerospace product and parts (NAICS 3364). They are never added to the aerospace total. The missile series also includes space-vehicle manufacturing, so it is broader than interceptor plants alone. Ammunition/ordnance includes commercial small arms. Shipbuilding includes non-naval work. Overtime covers all aerospace employees, not missile plants only.
Index comparisons use February 2022 = 100, the month Russia’s full-scale invasion of Ukraine began. The U.S.-Iran war began 28 February 2026; February–June 2026 is a short window and is not a measure of causal effect. October 2024 shows a one-month drop in aircraft and aerospace payrolls that reversed in November; it is noted, not interpreted as a weapons-industry collapse.
State aerospace figures for Alabama, Arizona and Kansas are not seasonally adjusted; June is compared with June. Monthly extracts for Washington, Texas and California returned no observations under the same filter and are not used. State aerospace is a broader industry than missile manufacturing.
No output, inventory, or productivity figures are in this catalogue. Payroll change is not interceptor production. Descriptive comparisons are not causal estimates of war, contracts, or policy.
Research completed 2026-09-11, for the August 31, 2026 news edition. This is retrospective analysis, not a reconstruction of information available that day.