Research
The housing ladder moved inland
The shoppers left first
Realtor.com’s new label for the American housing market is “affordability refugees”: shoppers who have given up on their own metro and started looking next door. In the 100 largest metropolitan areas they now account for 60 percent of buyers, up from about 48 percent in 2019, with the West at 65 percent. Salt Lake City, Denver and Durham are the exhibit A’s — once-budget-friendly places where more than 70 percent of first-quarter shoppers hunted listings typically 5 to 15 percent cheaper in Ogden, Colorado Springs or Raleigh.
That is a story about sale prices and commuting, not a census of rents. It is also a midterm story. July’s personal-consumption price index stuck at 3.7 percent, gasoline is still expensive because of the Iran war, and both parties are running on the cost of living. The question the official books can actually answer is narrower and, for once, useful: in the states those shoppers are fleeing, how high are housing costs already relative to the rest of the country, how large a bite do they take of household spending, and have real incomes kept up?
The Bureau of Economic Analysis publishes regional price parities for housing services — essentially a comparison of tenant rents, with the national average sitting near 100. Those parities are not asking prices on Zillow, and they are not mortgage payments. They are the government’s best apples-to-apples read of how expensive it is to occupy a dwelling in one state versus another. Combined with state personal-consumption accounts, they show a country in which the old cheap-West bargain has been closing even as the national housing share of spending has barely moved.
Utah is no longer the discount rack
In 2024, housing in California still cost about 54 percent more than the national average. The District of Columbia was in the same neighborhood. New Jersey, Massachusetts, Colorado, Washington, Hawaii, New York and Florida all sat 22 to 34 percent above the U.S. line. West Virginia and Mississippi were almost half as expensive. That ranking will surprise no one who has tried to rent in San Francisco or Huntington.
The movement will. Colorado’s housing parity rose 13.5 points between 2008 and 2024, the largest climb among the large states in this set. Utah rose 10.6 points and crossed the national average after 2021. Oregon, Idaho, Washington and Texas all moved up as well. Hawaii and New Jersey, already expensive, became relatively less so. California’s housing parity eased from 161.4 to 154.3 — still the most expensive large state, just no longer pulling further away.
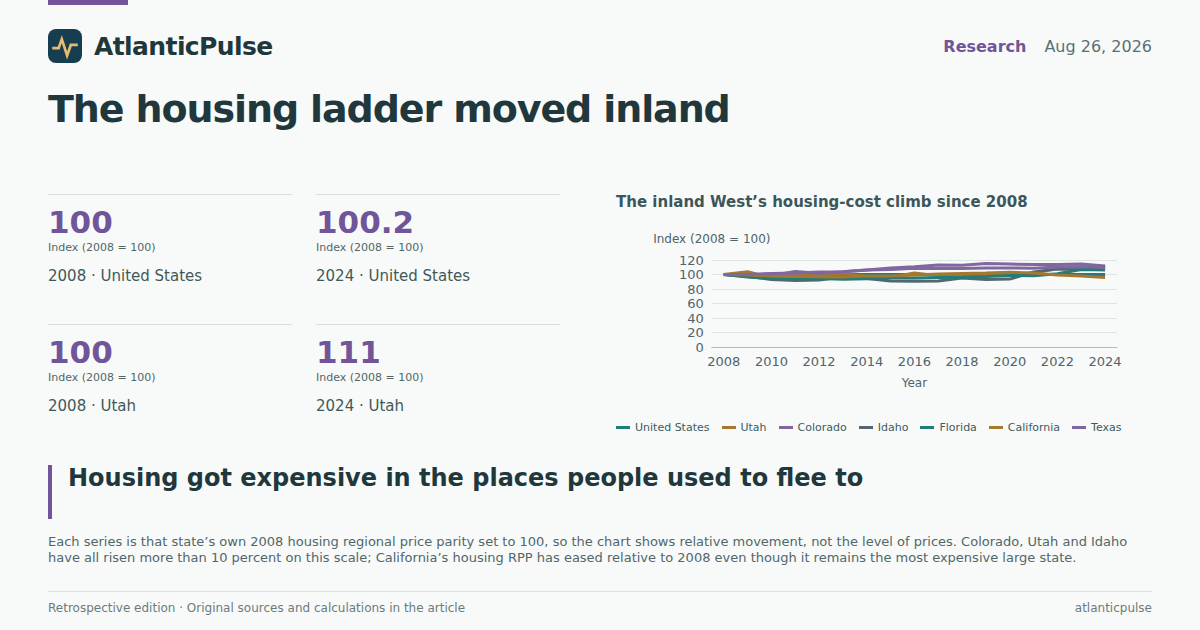
Index the same series to each state’s own 2008 level and the inland West is the story. Colorado, Utah and Idaho were all more than 10 percent above their 2008 housing parities by 2024. Florida joined them after 2021. The U.S. line barely twitched. Relative housing costs did not explode everywhere; they rotated toward the places that used to be the escape hatch.
Where housing costs sit relative to the U.S. average, 2024

View exact chart values
| state | year | housing_rpp | change_since_2008 |
|---|---|---|---|
| District of Columbia | 2024 | 155 | -1.8 |
| California | 2024 | 154.3 | -7 |
| New Jersey | 2024 | 134.3 | -19.1 |
| Massachusetts | 2024 | 128.1 | 1.5 |
| Colorado | 2024 | 127.4 | 13.5 |
| Washington | 2024 | 126 | 8.6 |
| Hawaii | 2024 | 125.3 | -21.5 |
| New York | 2024 | 122.2 | -8.7 |
| Florida | 2024 | 122.1 | 7 |
| Nevada | 2024 | 114.1 | -5.1 |
| Oregon | 2024 | 108.6 | 10.2 |
| Utah | 2024 | 107.8 | 10.6 |
| Arizona | 2024 | 106.8 | 3.5 |
| United States | 2024 | 100.6 | 0.2 |
| Texas | 2024 | 96.5 | 8.5 |
| Idaho | 2024 | 90 | 8.6 |
| North Carolina | 2024 | 81.4 | 7.1 |
| Mississippi | 2024 | 56.5 | -2.9 |
| West Virginia | 2024 | 54.2 | -2.2 |
The inland West’s housing-cost climb since 2008

View exact chart values
| year | United_States | Utah | Colorado | Idaho | Florida | California | Texas |
|---|---|---|---|---|---|---|---|
| 2008 | 100 | 100 | 100 | 100 | 100 | 100 | 100 |
| 2009 | 100 | 103.9 | 99.4 | 97.1 | 96.5 | 99.4 | 100.2 |
| 2010 | 100 | 95.3 | 98.5 | 93.1 | 94.4 | 97.9 | 101.5 |
| 2011 | 100 | 99.9 | 104.3 | 91.7 | 94.1 | 97.4 | 101.9 |
| 2012 | 99.9 | 99.6 | 101.6 | 92.5 | 94.6 | 96.8 | 103.5 |
| 2013 | 99.9 | 100.9 | 103.7 | 96.7 | 93.4 | 96.5 | 103.9 |
| 2014 | 100 | 97.7 | 106.1 | 94.5 | 94 | 97.9 | 106.3 |
| 2015 | 100 | 96.3 | 108.8 | 91.1 | 95 | 97.9 | 106.8 |
| 2016 | 100 | 101.9 | 110.8 | 90.7 | 95.1 | 99.2 | 108.6 |
| 2017 | 100 | 98.4 | 113.2 | 91.1 | 96 | 100.7 | 108.3 |
| 2018 | 100 | 99.6 | 112.7 | 95.2 | 96.2 | 101.5 | 108.3 |
| 2019 | 100 | 100.2 | 115.1 | 93 | 97.4 | 102 | 108.9 |
| 2020 | 100.2 | 100.1 | 114.5 | 93.7 | 98.7 | 103.1 | 108.9 |
| 2021 | 100.2 | 102.1 | 113.7 | 103.4 | 98.2 | 102.2 | 108.6 |
| 2022 | 100.2 | 108.4 | 113.8 | 107.7 | 101.1 | 99.2 | 110.2 |
| 2023 | 100.1 | 109.3 | 114.6 | 106.7 | 107 | 97.8 | 110.8 |
| 2024 | 100.2 | 111 | 111.9 | 110.6 | 106.1 | 95.7 | 109.7 |
The national housing bill is stubborn, not exploding
Price parities tell you how expensive a place is compared with other places. Spending shares tell you how large housing is in the household budget. Divide per-person housing-and-utilities consumption by total personal consumption and the United States has been living with an 18 percent housing bill, give or take a point, since the late 1990s. In 2024 it was 18.1 percent — $10,595 of $58,499 per person — almost identical to 1997’s 18.2 percent.
That stability is not comfort. It means housing has grown with everything else, not that it got cheaper. Florida devoted 21.5 percent of spending to housing and utilities in 2024, Colorado 20.4 percent, California 19.0, Utah 18.9. Mississippi, where rents are cheap, still spent 17.1 percent because incomes are lower too. Utah’s share sagged in the 2010s, then climbed back as local housing parities caught up — the statistical version of a market that used to feel like a bargain and no longer does.
The BEA’s housing consumption figure includes the imputed rent that owners are treated as paying themselves. It is not a mortgage payment, and it is not proof that households are one rate hike from default. It is proof that shelter is a fifth of the consumption pie in the expensive Mountain states, and that the national average has not been shrinking.
Housing price parities, 2008–2024

View exact chart values
| year | United_States | Utah | Colorado | California | Florida | Texas | North_Carolina | Mississippi |
|---|---|---|---|---|---|---|---|---|
| 2008 | 100.4 | 97.2 | 113.9 | 161.4 | 115.1 | 88 | 74.3 | 59.3 |
| 2009 | 100.5 | 101 | 113.2 | 160.4 | 111 | 88.2 | 75.3 | 58.1 |
| 2010 | 100.4 | 92.6 | 112.2 | 158 | 108.7 | 89.3 | 75.4 | 60 |
| 2011 | 100.4 | 97.1 | 118.8 | 157.1 | 108.2 | 89.7 | 76.3 | 60.4 |
| 2012 | 100.4 | 96.8 | 115.7 | 156.2 | 108.8 | 91.1 | 75.8 | 59.8 |
| 2013 | 100.4 | 98 | 118 | 155.7 | 107.4 | 91.4 | 76 | 59.6 |
| 2014 | 100.4 | 95 | 120.8 | 157.9 | 108.2 | 93.6 | 76.3 | 59.1 |
| 2015 | 100.4 | 93.6 | 123.9 | 158 | 109.3 | 94 | 75.8 | 58.6 |
| 2016 | 100.4 | 99 | 126.2 | 160.1 | 109.4 | 95.6 | 74.7 | 59.1 |
| 2017 | 100.4 | 95.6 | 128.9 | 162.5 | 110.5 | 95.2 | 75.5 | 59.1 |
| 2018 | 100.4 | 96.8 | 128.3 | 163.8 | 110.7 | 95.2 | 75.3 | 56.7 |
| 2019 | 100.4 | 97.3 | 131 | 164.6 | 112 | 95.8 | 75.4 | 55.4 |
| 2020 | 100.6 | 97.3 | 130.4 | 166.3 | 113.6 | 95.8 | 75 | 55.3 |
| 2021 | 100.6 | 99.2 | 129.4 | 165 | 112.9 | 95.6 | 76 | 56.1 |
| 2022 | 100.6 | 105.3 | 129.5 | 160.1 | 116.3 | 97 | 78.8 | 56.8 |
| 2023 | 100.6 | 106.2 | 130.5 | 157.8 | 123.2 | 97.5 | 80.8 | 54.9 |
| 2024 | 100.6 | 107.8 | 127.4 | 154.3 | 122.1 | 96.5 | 81.4 | 56.5 |
Housing and utilities as a share of household spending

View exact chart values
| year | United_States | Utah | California | Colorado | Florida |
|---|---|---|---|---|---|
| 1997 | 18.2 | 19 | 20.1 | 19.7 | 21 |
| 1998 | 18.1 | 19.1 | 20.1 | 19.4 | 20.9 |
| 1999 | 17.9 | 19.1 | 19.7 | 18.8 | 20.8 |
| 2000 | 17.7 | 19 | 19.3 | 18.2 | 20.5 |
| 2001 | 18.2 | 19.6 | 19.8 | 18.7 | 21 |
| 2002 | 18.1 | 19.5 | 19.6 | 18.8 | 21.2 |
| 2003 | 18 | 19.3 | 19.4 | 18.8 | 20.9 |
| 2004 | 17.8 | 19 | 19.2 | 18.8 | 20.5 |
| 2005 | 18 | 19 | 19.3 | 19.1 | 20.4 |
| 2006 | 18 | 18.3 | 19.1 | 19.1 | 20.7 |
| 2007 | 18.1 | 18.2 | 19.1 | 18.8 | 21.1 |
| 2008 | 18.6 | 18.9 | 20.2 | 19.7 | 21.8 |
| 2009 | 19.2 | 20.1 | 21.2 | 20.3 | 22.2 |
| 2010 | 19 | 19.4 | 20.9 | 20.1 | 21.7 |
| 2011 | 18.5 | 19.3 | 20.2 | 20.4 | 21.1 |
| 2012 | 18.2 | 19 | 19.8 | 19.8 | 20.6 |
| 2013 | 18.3 | 18.9 | 19.9 | 20.1 | 20.3 |
| 2014 | 18.1 | 18.4 | 19.5 | 19.7 | 19.9 |
| 2015 | 17.9 | 17.8 | 19.1 | 19.9 | 19.7 |
| 2016 | 17.8 | 18 | 19.1 | 19.9 | 19.7 |
| 2017 | 17.7 | 17.6 | 19.1 | 19.8 | 19.6 |
| 2018 | 17.6 | 17.3 | 18.9 | 19.5 | 19.5 |
| 2019 | 17.7 | 17.7 | 19 | 20.1 | 19.7 |
| 2020 | 18.9 | 17.9 | 20.6 | 20.3 | 21.3 |
| 2021 | 17.6 | 16.9 | 19 | 19.5 | 19.3 |
| 2022 | 17.6 | 17.3 | 18.7 | 19.5 | 19.8 |
| 2023 | 17.9 | 18.1 | 19 | 19.8 | 20.8 |
| 2024 | 18.1 | 18.9 | 19 | 20.4 | 21.5 |
The squeeze is costs without the income
Real per capita personal income — BEA’s price-adjusted, 2017-dollar measure — makes the Utah problem sharper. In 2024 the United States sat at about $59,200. Colorado was richer, at $65,200, with housing 27 percent above the national parity. California was richer still in real terms ($63,000) with housing 54 percent above. New York looked similar. Texas was a touch below the national income line with housing still a bit cheaper than average.
Utah combined the worst of both: housing 8 percent above the U.S. parity and real income about $55,100, several thousand dollars below the national average. Mississippi was cheaper and poorer. Florida’s housing parity has jumped while real incomes remain below the U.S. line. The scatter is not a causal model. It is a map of who can still absorb a high rent and who is shopping Ogden because the arithmetic in Salt Lake no longer works.
None of this says a 50 percent Canadian tariff, a 3.7 percent PCE print, or a midterm slogan caused anyone to cross a county line. Sale prices in 2026 can run ahead of 2024 rent parities. Metro gaps inside a state — Salt Lake versus Ogden — are larger than the state averages. What the official series do say is simpler, and harder to campaign around: the places Americans used as overflow valves have been getting relatively more expensive for years, the housing share of spending was already large, and in Utah the income side of the ledger did not come along for the ride.
High housing costs do not always come with high real incomes

View exact chart values
| state | housing_rpp | real_income |
|---|---|---|
| United States | 100.6 | 59195 |
| Utah | 107.8 | 55116 |
| California | 154.3 | 63028 |
| Colorado | 127.4 | 65223 |
| Texas | 96.5 | 58219 |
| Mississippi | 56.5 | 48465 |
| Florida | 122.1 | 57131 |
| New York | 122.2 | 64153 |
Sources and methods
This is retrospective enrichment using pinned BEA snapshots available to the research tools, not a reconstruction of what was knowable on the 2026-08-26 edition date. Later revisions may be present.
Housing regional price parities are annual BEA SARPP series for tenant-occupied housing services, U.S. average near 100, calendar years 2008–2024, release bea-rpp-2026-02-19. They are not sale prices, mortgage payments, or quality-adjusted home values.
Per capita housing-and-utilities PCE and total PCE are annual BEA SAPCE2 series in current dollars, 1997–2024, release bea-sapce-2025-09-26. Housing consumption includes imputed owner-occupied rent. Shares are housing-and-utilities PCE divided by total PCE; missing values were not treated as zero.
Real per capita personal income is BEA SARPI in constant 2017 dollars, 2008–2024, same RPP release. It is not a household median and is not disposable income.
State coverage is the geographies extracted for this job, not a complete 50-state census. Dictionary presence of other states is not proof those series were pulled. Indexed comparisons use each geography’s own 2008 housing RPP as 100.
Realtor.com buyer shares and metro sale-price gaps cited in the original reporting are not in these extracts and are not used as chart values. No causal effect is inferred from descriptive comparisons.
Research completed 2026-09-11, for the August 26, 2026 news edition. This is retrospective analysis, not a reconstruction of information available that day.