Research
The groves left Florida’s books before the last trees did
A heritage crop, and a farm sector that is already smaller
Florida’s preliminary commercial citrus inventory for the 2026-27 season put grove land at 165,359 acres across 23 counties, down nearly 21 percent in a year, 65 percent from 480,121 acres in 2016, and 73 percent from 621,373 acres in 2006. Polk County still leads, even after losing the most acreage. Hurricanes, freezes, citrus greening, changing drinking habits and development have done the work that slogans cannot undo. Large landowner Alico is winding down citrus to chase land sales. Senate President Ben Albritton, a grower, still says “Florida citrus is not going down on my watch.” The groves, as the acreage table makes clear, did not get a vote.
The official economic books cannot count orange trees. BEA farm GDP lumps citrus with vegetables, sugarcane, nurseries, cattle and every other crop and livestock operation in the state. That is a limitation, not a license to pretend the inventory never happened. If a crop that once defined the state’s postcard has been cut by three-quarters of its acreage in two decades, the question worth asking is whether Florida’s farm sector as a whole already looks like a shrinking industry — and what, on the same books, got large instead.
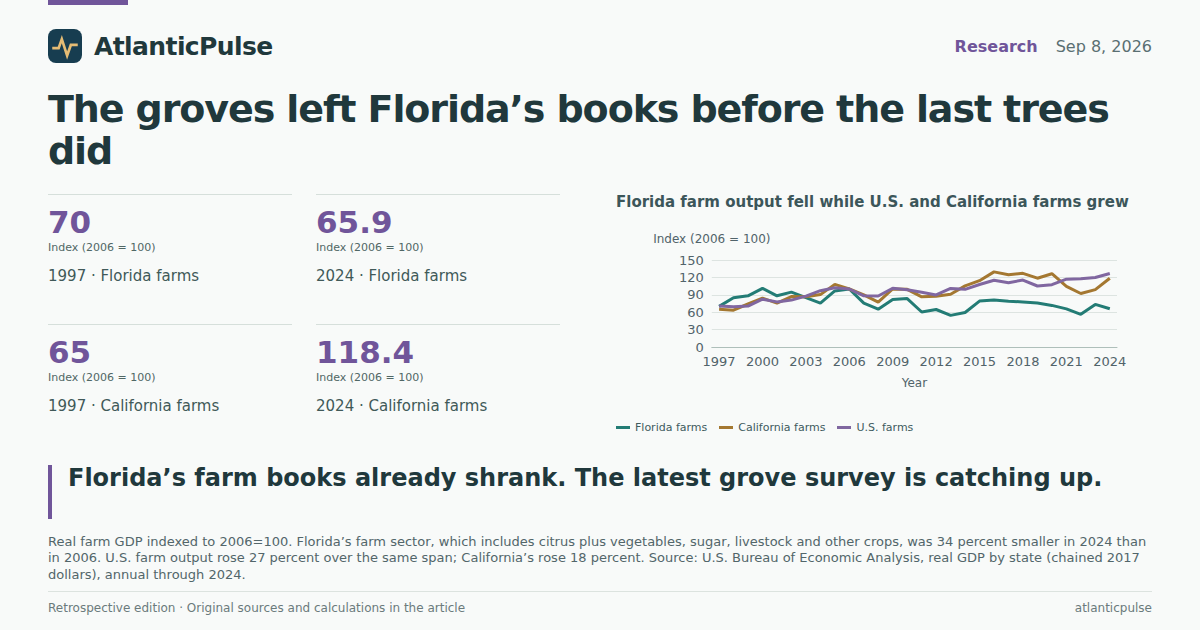
It does. In chained 2017 dollars, Florida farm GDP was $3.68 billion in 2024, the latest full year in the pinned BEA annual snapshot. That is 34 percent below 2006 ($5.58 billion) and 19 percent below 2016 ($4.52 billion). The peak in this series was 2000, at $5.64 billion; 2024 was 35 percent below that high-water mark. Over the same 2006-to-2024 span, U.S. farm GDP rose 27 percent and California’s farm GDP rose 18 percent. Texas farm output rose 47 percent. Florida is not riding a national farm slump. It is the citrus state whose farm books went the other way.
Florida farm output fell while U.S. and California farms grew

View exact chart values
| year | florida_farms | california_farms | us_farms | florida_total | florida_real_estate | florida_accom_food | florida_construction |
|---|---|---|---|---|---|---|---|
| 1997 | 70 | 65 | 70.9 | 66.4 | 56.4 | 67.9 | 59.6 |
| 1998 | 84.9 | 63.5 | 69.3 | 69.7 | 56.1 | 70.6 | 64.7 |
| 1999 | 88.3 | 74.1 | 70.5 | 73 | 60.2 | 74.4 | 68 |
| 2000 | 101.2 | 84.1 | 82.4 | 76.3 | 62.4 | 77.9 | 72.5 |
| 2001 | 88.3 | 75.7 | 77.7 | 78.6 | 67.4 | 76.4 | 75.4 |
| 2002 | 94.6 | 86.9 | 80.8 | 82.1 | 74.3 | 77.9 | 77.1 |
| 2003 | 85.1 | 86.6 | 87.7 | 86 | 79.1 | 84.9 | 81.9 |
| 2004 | 75.5 | 90.4 | 97.1 | 91.7 | 88.9 | 96.9 | 91.5 |
| 2005 | 96.7 | 107.9 | 102.3 | 97.1 | 97.9 | 99.7 | 100 |
| 2006 | 100 | 100 | 100 | 100 | 100 | 100 | 100 |
| 2007 | 75.7 | 90 | 88.2 | 101.4 | 109.2 | 97.6 | 89.4 |
| 2008 | 65.2 | 77.2 | 88 | 98.1 | 109.2 | 95.8 | 69 |
| 2009 | 81.9 | 100.1 | 101.4 | 92.4 | 101.7 | 88.7 | 51.9 |
| 2010 | 83.5 | 99.4 | 98.6 | 93.7 | 100.3 | 96.1 | 53.2 |
| 2011 | 60.3 | 86.6 | 94.3 | 93.4 | 99.9 | 100.9 | 51.9 |
| 2012 | 64.6 | 87.4 | 89.9 | 94.3 | 101.2 | 99.7 | 44.6 |
| 2013 | 54.5 | 90.8 | 101.1 | 96.8 | 105.5 | 100 | 41.6 |
| 2014 | 59.4 | 105.4 | 99.5 | 99.6 | 106.8 | 101 | 47.9 |
| 2015 | 79.1 | 114.3 | 107.8 | 104 | 109.7 | 106.7 | 54.4 |
| 2016 | 81 | 129.5 | 115 | 107.7 | 111.9 | 110.6 | 62 |
| 2017 | 79 | 124.7 | 110.9 | 111.6 | 115.3 | 113.4 | 67.4 |
| 2018 | 77.8 | 127 | 115.3 | 115.5 | 122.9 | 111.6 | 72.8 |
| 2019 | 75.9 | 118.6 | 105.1 | 119.3 | 128.5 | 116.7 | 74.8 |
| 2020 | 71.7 | 126.3 | 107.5 | 117.9 | 132.4 | 87.1 | 76.1 |
| 2021 | 65.7 | 104.4 | 116.9 | 129 | 141.5 | 115.9 | 79 |
| 2022 | 56.4 | 92.3 | 117.7 | 137 | 157.3 | 125.4 | 74.2 |
| 2023 | 73.5 | 98.9 | 119.8 | 144 | 167.8 | 128.4 | 76 |
| 2024 | 65.9 | 118.4 | 126.7 | 148.7 | 175.3 | 130.1 | 80.3 |
A rounding error next to condos, cranes and kitchens
Farms were never most of Florida’s economy. In 2006 they were 0.61 percent of statewide real GDP. By 2024 they were 0.27 percent. Florida’s whole economy grew 49 percent in real terms over those years, to $1.35 trillion. The farm share did not merely fail to keep up. It was cut in half while the pie got bigger.
Put the 2024 pieces on the same scale. Real estate produced $253 billion. Construction produced $64 billion. Accommodation and food services produced $53 billion. Farms produced $3.7 billion. Construction was 17 times the farm sector; hotels and restaurants were 15 times; real estate was 69 times. Those comparisons are industry totals, not a claim that every lost grove became a high-rise. They do show what already pays the state’s bills.
Construction GDP is the awkward cousin in that lineup. It is still 20 percent below its 2006 housing-bubble peak in real terms, even after a long recovery. July payrolls tell a milder version of the same story: construction employment was 686,200 in July 2006 and 658,400 in July 2026, after a trough near 334,000 in 2011. Leisure and hospitality, by contrast, went from 964,100 jobs in July 2006 to 1.34 million in July 2026. The land-use fight in citrus country is not a mystery on the labor market’s nonfarm side. The jobs that grew are in hotels, restaurants and a construction workforce that never quite recaptured the boom.
What replaced the groves on Florida’s books

View exact chart values
| sector | gdp_billions | gdp_millions |
|---|---|---|
| Farms | 3.68 | 3677.3 |
| Accommodation and food | 53.44 | 53438.7 |
| Construction | 63.66 | 63661.8 |
| Real estate | 252.68 | 252681.7 |
Leisure and construction payrolls kept growing as groves came out

View exact chart values
| year | construction | leisure |
|---|---|---|
| 2000 | 484 | 859.3 |
| 2001 | 499.4 | 872.2 |
| 2002 | 498.3 | 874.1 |
| 2003 | 521.2 | 889 |
| 2004 | 572.7 | 931.3 |
| 2005 | 640.8 | 952.5 |
| 2006 | 686.2 | 964.1 |
| 2007 | 617.7 | 983.5 |
| 2008 | 509.6 | 970.2 |
| 2009 | 387 | 923.8 |
| 2010 | 354.3 | 932.9 |
| 2011 | 334.2 | 958.5 |
| 2012 | 340 | 1000.2 |
| 2013 | 366.8 | 1045.1 |
| 2014 | 399.3 | 1089.9 |
| 2015 | 432.9 | 1135 |
| 2016 | 478.5 | 1176.6 |
| 2017 | 508.7 | 1207.9 |
| 2018 | 544.8 | 1231.3 |
| 2019 | 566.1 | 1255.2 |
| 2020 | 560.2 | 931.5 |
| 2021 | 576.7 | 1150.1 |
| 2022 | 605.9 | 1252.6 |
| 2023 | 630.1 | 1301.2 |
| 2024 | 655.5 | 1320.3 |
| 2025 | 655.7 | 1330.9 |
| 2026 | 658.4 | 1344.1 |
The people who still farm are earning less — and just went negative
Farm proprietors’ income is the check that sole proprietors and partnerships receive. It excludes corporate farms, which matters because Alico is a corporation leaving citrus. Even on that narrower ledger, Florida farm proprietors took in $627 million in 2024, against $1.27 billion in 2006 and a $2.44 billion peak in 2015. That is a 51 percent drop from 2006 in current dollars, before any inflation adjustment. California farm proprietors, on the same series, earned $11.9 billion in 2024.
The quarterly file is uglier. Seasonally adjusted annual rates bounced around for a decade, as farm income does. Then 2024 and 2025 spent most quarters under $800 million. In the first quarter of 2026 the series went negative: −$579 million. Negative proprietors’ income is an accounting event as much as a harvest event — inventory, prices, and a mix of commodities can all push the number below zero. It is not a citrus-acreage census. It is also not a healthy farm book. A state that still prints orange-crate nostalgia on welcome signs posted a farm-proprietor loss at a seasonally adjusted annual rate large enough to wipe out a typical recent year’s profit.
None of this proves that the latest 21 percent acreage cut caused the 2024 GDP print or the 2026 Q1 loss. BEA’s annual farm GDP ends in 2024, before the 2026-27 inventory. Greening, storms and development had already done most of the acreage damage. The point is simpler. Florida did not need this year’s inventory to learn that citrus is no longer a pillar of the state’s output. The pillar had already been recast as real estate, tourism payrolls and a construction sector that employs about as many people in a slow year as the entire U.S. farm GDP of some smaller states.
Florida farm proprietors earned half as much as in 2006

View exact chart values
| year | florida_proprietors |
|---|---|
| 1997 | 1258.9 |
| 1998 | 1694.1 |
| 1999 | 1810.9 |
| 2000 | 1613 |
| 2001 | 1314.9 |
| 2002 | 1308.4 |
| 2003 | 1130.6 |
| 2004 | 986 |
| 2005 | 1491.3 |
| 2006 | 1272.4 |
| 2007 | 942 |
| 2008 | 600.5 |
| 2009 | 775.3 |
| 2010 | 1072.5 |
| 2011 | 952.4 |
| 2012 | 1541.9 |
| 2013 | 1343.5 |
| 2014 | 1531.8 |
| 2015 | 2436.7 |
| 2016 | 1384 |
| 2017 | 1888.6 |
| 2018 | 1065.7 |
| 2019 | 1223.6 |
| 2020 | 1007 |
| 2021 | 879.4 |
| 2022 | 1073.1 |
| 2023 | 1370.6 |
| 2024 | 627 |
By early 2026, Florida farm proprietors were in the red

View exact chart values
| period | florida_proprietors_saar |
|---|---|
| 2015-01 | 2350.7 |
| 2015-04 | 2222.7 |
| 2015-07 | 2444.9 |
| 2015-10 | 2728.3 |
| 2016-01 | 1410.1 |
| 2016-04 | 1474.3 |
| 2016-07 | 1406.9 |
| 2016-10 | 1244.9 |
| 2017-01 | 2182 |
| 2017-04 | 2100.5 |
| 2017-07 | 1611.2 |
| 2017-10 | 1660.7 |
| 2018-01 | 766.6 |
| 2018-04 | 1387.9 |
| 2018-07 | 1095.9 |
| 2018-10 | 1012.3 |
| 2019-01 | 1223 |
| 2019-04 | 1154 |
| 2019-07 | 1243.3 |
| 2019-10 | 1274.3 |
| 2020-01 | 396.3 |
| 2020-04 | 1020.5 |
| 2020-07 | 1174.9 |
| 2020-10 | 1436.1 |
| 2021-01 | 744.6 |
| 2021-04 | 925.4 |
| 2021-07 | 710.7 |
| 2021-10 | 1137.1 |
| 2022-01 | 1233.3 |
| 2022-04 | 1009.9 |
| 2022-07 | 612 |
| 2022-10 | 1437.2 |
| 2023-01 | 1815.2 |
| 2023-04 | 1680.5 |
| 2023-07 | 1144 |
| 2023-10 | 842.5 |
| 2024-01 | 468.3 |
| 2024-04 | 673.7 |
| 2024-07 | 581.4 |
| 2024-10 | 784.7 |
| 2025-01 | 485 |
| 2025-04 | 475.5 |
| 2025-07 | 489.4 |
| 2025-10 | 870.9 |
| 2026-01 | -579.1 |
What the inventory is really telling voters
Albritton’s $160 million citrus-research budget is not nothing. It is also not a farm-sector recovery. If the goal is to keep a heritage industry on the landscape, the official books say the landscape has already been reassigned. California still runs a farm economy more than six times Florida’s. Texas, whose citrus belt is a footnote to cattle and cotton, now has farm GDP about three times Florida’s. Arizona’s farm sector is smaller than Florida’s, but it did not fall 34 percent from 2006.
The honest reading of the BEA and BLS files is therefore narrower than a eulogy and harsher than a marketing brochure. Florida’s remaining groves are a real industry under real disease and weather stress. They are not, on present output, a material share of the state’s product. Households that work in hotels, kitchens and building trades already outnumber whatever payroll the groves can still support — and the farm series used here cannot even count most of those grove workers, because CES and SAE are nonfarm surveys.
If legislators want to spend public money to keep orange trees in Polk and Highlands counties, they should say so as heritage and land policy, not as an economic-development program that will show up in next year’s GDP. The 2026 inventory is a land-use story that the state’s economic accounts had already written in smaller type.
Sources and methods
This is retrospective enrichment using pinned catalogue snapshots, not a reconstruction of what was knowable on the 8 September 2026 edition date. Later releases and revisions may be present in the snapshots.
Research was completed on 11 September 2026 against historical edition date 8 September 2026.
BEA annual state GDP and income: snapshot created 31 August 2026 from release bea-regional-state-annual-2026-04-09. Observation window for farm and industry GDP is calendar years 1997–2024 (chained 2017 dollars). Farm proprietors’ income on SAINC30 is 1997–2024 in current millions of dollars.
BEA quarterly state income: snapshot created 31 August 2026 from release bea-regional-state-quarterly-2026-06-25. Farm proprietors’ income is seasonally adjusted at annual rates, 2015 Q1–2026 Q1.
BLS State and Area Employment: snapshot created 24 August 2026 (bls-sm-snapshot-2026-08-24). Florida statewide seasonally adjusted construction, leisure and hospitality, and total nonfarm payrolls are monthly through July 2026. Food manufacturing is not seasonally adjusted; July-to-July comparisons were used only as a check and are not charted as a citrus series.
Farms (NAICS 111-112) include all crop and animal production. They are not a citrus census. No claim is made that the 2026-27 acreage drop caused 2024 GDP or 2026 Q1 proprietors’ income. Corporate farms, including publicly traded growers, are in farm GDP but not in proprietors’ income.
Missing observations were not treated as zero. Duplicate period rows, if any, kept the first value. Index charts use 2006=100 because that year matches the USDA acreage comparison in the day’s reporting. Construction real GDP remains below its 2006 housing-boom peak; that is reported as such, not as a jobs collapse.
Source URLs are the locators and documentation listed in extract metadata. They are supplied destinations, not live HTTP verification.
Research completed 2026-09-11, for the September 8, 2026 news edition. This is retrospective analysis, not a reconstruction of information available that day.