Research
The grocery bill already outgrew the pump. Arizona is not the expensive one.
The Fed is staring at 3.7%. The trail is staring at the fridge.
Six days before voters decide who runs Congress, the Federal Reserve left its key rate at about 3.9% and said inflation “remains elevated.” Consumer prices were up 3.7% in September from a year earlier, versus 2.4% in February, just before the Iran war. Campaigns are talking about $4 gasoline, methane rollbacks and food-stamp cuts. The question those headlines leave hanging is simpler than a rate path: have the official books in the states actually on the trail already shown incomes stalling, and is the SNAP-cut state the one with the fattest grocery bill?
The answer, from BEA real per capita personal income and state consumption accounts, is uncomfortable for both the pump-price panic and the SNAP-cut morality play. In 2017 dollars, U.S. real income per person rose from $53,683 in 2019 to $59,195 in 2024 — up 10.3%. Among the states in this week’s campaign and SNAP reporting, Pennsylvania gained the least after local prices, 5.7%. Georgia gained 6.4%. Iowa gained 14.8%; Arizona, 12.0%. Those are not household averages, and they stop in 2024. They are also not a stall.
What did stall, briefly, was the 2021 peak. Real income per person in the United States fell from $59,365 in 2021 to $57,104 in 2022, then recovered only partway by 2024. Ohio, Georgia, Michigan and Pennsylvania all show the same 2022 dip. That is the inflation bruise these voters are still talking about. It is not the same thing as incomes going nowhere for a decade.
Real income per person, 2008–2024

View exact chart values
| year | United States | Ohio | Georgia | Texas | Arizona | Michigan | Iowa | Pennsylvania |
|---|---|---|---|---|---|---|---|---|
| 2008 | 45816 | 44461 | 42002 | 46068 | 38966 | 41949 | 49456 | 46939 |
| 2009 | 44204 | 42867 | 41941 | 43349 | 36634 | 40151 | 46729 | 45776 |
| 2010 | 44808 | 43467 | 40640 | 44078 | 37162 | 40986 | 46358 | 47072 |
| 2011 | 45957 | 45562 | 42349 | 46663 | 38403 | 42724 | 49104 | 48362 |
| 2012 | 46796 | 45869 | 41403 | 47554 | 39284 | 43541 | 49628 | 49325 |
| 2013 | 46358 | 45680 | 41305 | 47301 | 39204 | 43149 | 49488 | 49047 |
| 2014 | 47661 | 46857 | 42937 | 48959 | 40281 | 44089 | 50001 | 50343 |
| 2015 | 49396 | 48895 | 45136 | 48983 | 41960 | 47218 | 52254 | 51702 |
| 2016 | 49828 | 49223 | 45879 | 47686 | 42568 | 48000 | 52065 | 52744 |
| 2017 | 51006 | 50280 | 47171 | 49918 | 44279 | 48928 | 52544 | 52479 |
| 2018 | 52242 | 50500 | 48278 | 51551 | 45675 | 48921 | 52172 | 54492 |
| 2019 | 53683 | 51249 | 49762 | 52343 | 47236 | 49306 | 52372 | 55458 |
| 2020 | 56514 | 55074 | 52219 | 53181 | 50292 | 53586 | 55696 | 59098 |
| 2021 | 59365 | 57339 | 54051 | 56442 | 54424 | 55679 | 59666 | 61217 |
| 2022 | 57104 | 54882 | 51732 | 56452 | 50935 | 53454 | 59743 | 58304 |
| 2023 | 58088 | 55789 | 51643 | 57708 | 51960 | 53903 | 58646 | 58027 |
| 2024 | 59195 | 56232 | 52952 | 58219 | 52890 | 53569 | 60144 | 58620 |
Nominal paychecks kept climbing after the war started
The more recent official series is noisier, because it is not adjusted for prices. BEA quarterly per capita personal income is nominal dollars at an annual rate, derived from seasonally adjusted income. For the United States it was $78,090 in the fourth quarter of 2025 and $79,904 in the second quarter of 2026 — up 2.3% in two quarters, with the Iran war sitting in the middle of that window.
Ohio, Texas, Arizona, Michigan and Pennsylvania all posted similar two-quarter gains, between 2.2% and 3.0%. Georgia was slower, 1.8%. Iowa jumped 3.7%, from $67,506 to $70,000. None of those figures prove anyone feels richer. They do show that the official income numerator kept rising after February 2026. If the kitchen table got worse this spring, it was not because the BEA’s nominal per-person income line rolled over.
From the first quarter of 2022 to the second quarter of 2026, that same nominal series is up 23% nationally. Georgia is up 19%; Iowa, 17%. Those are current dollars. They include transfers, dividends and proprietors’ income, not just wages. They are still the best official per-person income read through mid-2026, and they do not look like a recession in the income accounts.
Nominal income kept rising into mid-2026

View exact chart values
| quarter | United States |
|---|---|
| 2019Q1 | 55035 |
| 2019Q2 | 55393 |
| 2019Q3 | 55683 |
| 2019Q4 | 56118 |
| 2020Q1 | 56597 |
| 2020Q2 | 60860 |
| 2020Q3 | 59783 |
| 2020Q4 | 59342 |
| 2021Q1 | 66918 |
| 2021Q2 | 63519 |
| 2021Q3 | 63904 |
| 2021Q4 | 64413 |
| 2022Q1 | 64946 |
| 2022Q2 | 65645 |
| 2022Q3 | 66808 |
| 2022Q4 | 67771 |
| 2023Q1 | 68799 |
| 2023Q2 | 69791 |
| 2023Q3 | 70612 |
| 2023Q4 | 71479 |
| 2024Q1 | 72534 |
| 2024Q2 | 73384 |
| 2024Q3 | 73953 |
| 2024Q4 | 74788 |
| 2025Q1 | 75837 |
| 2025Q2 | 76774 |
| 2025Q3 | 77480 |
| 2025Q4 | 78090 |
| 2026Q1 | 79024 |
| 2026Q2 | 79904 |
Arizona lost SNAP. It did not have the fattest grocery bill.
Today’s reporting from Tucson says five million people lost SNAP after a Trump-backed budget law, with Arizona hit hardest — more than 465,000 people, including 200,000 children. The implication hanging in the air is that Arizona’s grocery bill must be uniquely crushing. The 2025 consumption accounts say otherwise.
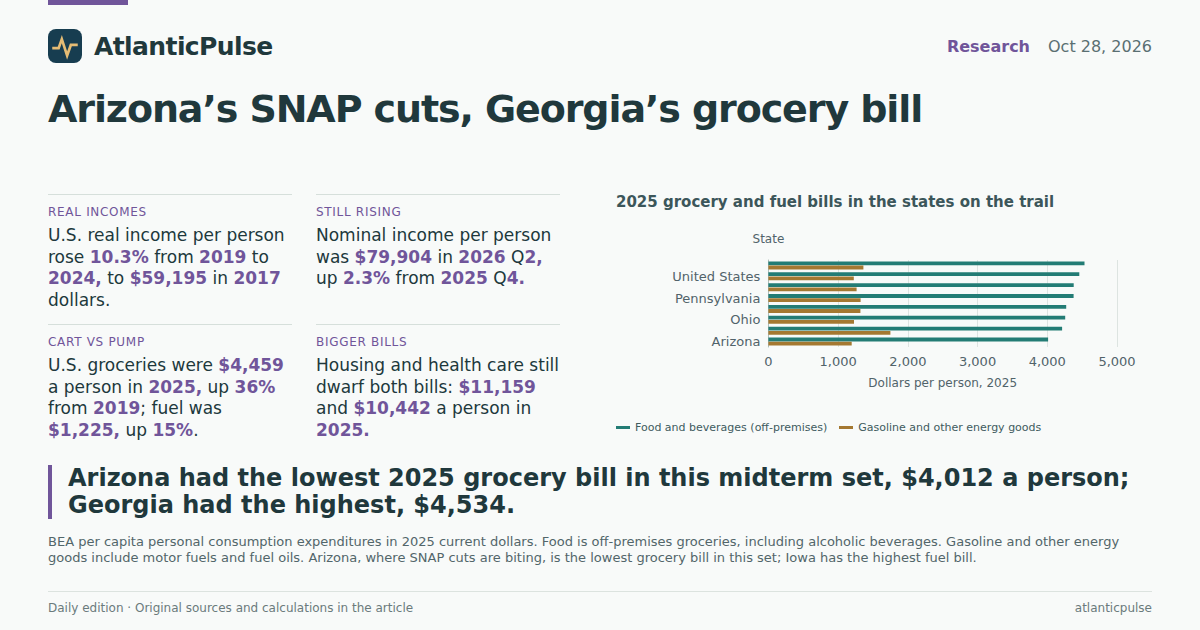
Per person, Arizonans spent $4,012 on food and beverages purchased for off-premises consumption in 2025, the lowest figure in this midterm set. Georgia spent $4,534. The United States spent $4,459. Ohio, where Trump is closing with Senator Jon Husted, spent $4,257. Texas spent $4,379. Those are current dollars, and they include alcoholic beverages and food produced on farms. They are not household totals, and they are not SNAP. They are still the official grocery line.
The fuel line is the other surprise. Iowa spent $1,750 per person on gasoline and other energy goods in 2025 — motor fuels plus fuel oils — against $1,225 nationally. Georgia was next at $1,363. Arizona, again, was at the bottom of this group, $1,195. Combine groceries and fuel and Iowa leads at $5,963 per person; Arizona is last at $5,207. If the midterm argument is that SNAP cuts landed on the most expensive kitchen tables, the official 2025 books do not put Arizona there. They put Georgia on groceries and Iowa on fuel.
2025 grocery and fuel bills in the states on the trail

View exact chart values
| state | food_2025 | gas_2025 |
|---|---|---|
| Arizona | 4012 | 1195 |
| Iowa | 4213 | 1750 |
| Ohio | 4257 | 1228 |
| Michigan | 4271 | 1320 |
| Pennsylvania | 4378 | 1323 |
| Texas | 4379 | 1265 |
| United States | 4459 | 1225 |
| Georgia | 4534 | 1363 |
Iowa sits alone on fuel. Georgia sits high on groceries.

View exact chart values
| state | food_2025 | gas_2025 |
|---|---|---|
| Iowa | 4213 | 1750 |
| Georgia | 4534 | 1363 |
| Pennsylvania | 4378 | 1323 |
| United States | 4459 | 1225 |
| Texas | 4379 | 1265 |
| Michigan | 4271 | 1320 |
| Ohio | 4257 | 1228 |
| Arizona | 4012 | 1195 |
The pump is not the bill that ran away
Nationally, the grocery bill has grown much faster than the fuel bill since 2019, and both are still smaller than housing and health care. U.S. food spending per person rose from $3,280 in 2019 to $4,459 in 2025, up 35.9%. Gasoline and other energy goods rose from $1,067 to $1,225, up 14.8% — and that 2025 figure is below the 2022 peak of $1,541. Housing and utilities rose from $7,758 to $11,159. Health care rose from $7,487 to $10,442. Total consumption per person was $61,062 in 2025.
Index those four lines to 2019. By 2025, housing and utilities sat at 143.8, health care at 139.5, groceries at 135.9, and gasoline and other energy goods at 114.8. Groceries were 7.3% of total PCE in 2025; fuel was 2.0%. That does not make $4 gasoline imaginary. It does mean that if the last official annual books are the guide, the inflation that ate the paycheck was not mainly at the pump. It was rent, utilities, clinics — and then the grocery cart.
Texas, whose grocery line jumped 41.2% from 2019 to 2025, the largest food increase in this set, is the state where Trump is promising cheaper energy by killing methane rules. Ohio, with the smallest food increase here at 26.7%, is where he is trying to hold a Senate seat. Georgia, the high grocery state, is where Barack Obama is trying to hold one. The official accounts cannot tell you how people will vote. They can tell you that the campaign’s favorite villain, the gas pump, is not the line that grew most on the 2025 books.
Since 2019, housing and health outran groceries. The pump did not.

View exact chart values
| year | food_index | gas_index | housing_index | health_index |
|---|---|---|---|---|
| 2019 | 100 | 100 | 100 | 100 |
| 2020 | 110.5 | 73 | 104.5 | 94.8 |
| 2021 | 118.6 | 108.9 | 110.3 | 106.3 |
| 2022 | 127.3 | 144.4 | 120.2 | 112.7 |
| 2023 | 130.2 | 129.4 | 129.1 | 121.5 |
| 2024 | 132.6 | 121.7 | 136.4 | 130.7 |
| 2025 | 135.9 | 114.8 | 143.8 | 139.5 |
Sources and methods
This is a retrospective reading of pinned BEA snapshots, not a same-day reconstruction of 28 October 2026. Real per capita personal income is annual, constant 2017 dollars, using regional price parities, from the SARPI state table in the 19 February 2026 RPP release, covering 2008–2024. It divides real personal income by midyear population. It is not a household average and does not incorporate 2025 or 2026 inflation.
Quarterly per capita personal income is nominal dollars at an annual rate, derived from seasonally adjusted personal income divided by unadjusted midquarter population, from the 30 September 2026 SQINC release, through 2026 Q2. Those figures are not inflation-adjusted. State quarterly extracts in this package begin in 2022; the U.S. series is shown from 2019.
Per capita PCE is current dollars per resident from the 30 September 2026 SAPCE release, annual through 2025. Food and beverages purchased for off-premises consumption include nonalcoholic beverages, alcoholic beverages and food produced and consumed on farms. Gasoline and other energy goods include motor vehicle fuels, lubricants and fluids plus fuel oils and other fuels. Housing and utilities include imputed owner-occupied rent. Health care is outpatient, hospital and nursing-home services. Shares use total per capita PCE as the denominator.
Missing values were skipped, not treated as zero. No duplicate observation rows were found in the extracts used. State comparisons are limited to the United States plus Ohio, Georgia, Texas, Arizona, Michigan, Iowa and Pennsylvania — the campaign, Senate and SNAP geographies in this edition’s reporting. Dictionary presence of other states was not treated as coverage. No causal effect is inferred from descriptive comparisons of SNAP policy, the Iran war or Federal Reserve decisions.
Research completed 2026-10-29, for the October 28, 2026 news edition. The available source data may cover earlier periods; see the observation periods and source vintages above.