Research
The factory jobs a 50% Canada auto tariff would actually hit
The threat, and what the books can show
President Donald Trump spent Monday telling Canada it will “be treated like a State no longer” and that auto, parts and steel tariffs will rise to 50 percent on January 1, 2027. Prime Minister Mark Carney had already promised dollar-for-dollar retaliation after talks collapsed over, among other things, heavier trucks such as Ford’s F-350. The political claim is that America does not need Canada. The industrial fact is that U.S. cars are assembled from parts that have, for decades, crossed that border as freely as they crossed a factory floor.
The catalogue used here does not include bilateral trade. It cannot say how many of those parts are Canadian, and it cannot forecast what a 50 percent tariff would do. What it can do is measure the U.S. side of the industry that would have to absorb the shock: payrolls in motor-vehicle, parts, and body plants; hours and pay; and state GDP in the same industry. Those are not a Canada-trade census. They are the official footprint of the factories whose supply chains the two governments are now treating as a bargaining chip.
Almost a million factory jobs — fewer than a generation ago
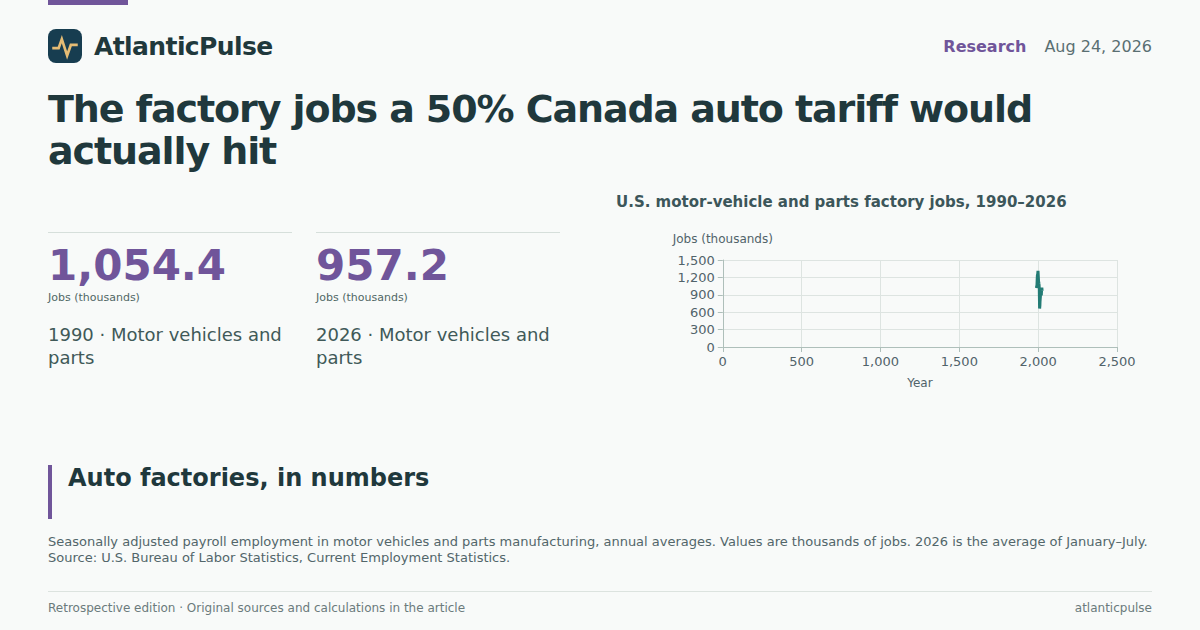
In July 2026, U.S. motor vehicles and parts plants employed 964,500 people, seasonally adjusted. That is 29,300 jobs, or 2.9 percent, below July 2019, and about 350,000 below July 2000, when the same industry employed 1.31 million. The 2009 collapse still sits on the chart like a missing tooth: 652,900 jobs that July. The recovery never fully restored the old peak.
Dealerships are a different, larger labour market. Automobile dealers employed 1.29 million in July 2026 — more people selling and servicing cars than making them. Iron and steel mills, the other industry named in Monday’s tariff threat, employed 84,800 in June 2026, against 187,600 in July 1990. A tariff war that raises the price of vehicles hits factories, showrooms and the steel towns in one motion. The factory payroll is the one most tightly bound to cross-border parts.
U.S. motor-vehicle and parts factory jobs, 1990–2026

View exact chart values
| year | mvp_thousands | vehicle_mfg_thousands | parts_thousands | body_thousands | dealers_thousands |
|---|---|---|---|---|---|
| 1990 | 1054.4 | 271.4 | 653.1 | 129.8 | 983.4 |
| 1991 | 1018 | 258.5 | 639.1 | 120.3 | 938.3 |
| 1992 | 1047.7 | 260 | 661.6 | 126 | 934.9 |
| 1993 | 1078.1 | 263.8 | 678.1 | 136.3 | 970.6 |
| 1994 | 1168.7 | 281.6 | 735.8 | 151.4 | 1032 |
| 1995 | 1241.5 | 294.8 | 786.9 | 159.8 | 1071.8 |
| 1996 | 1240.4 | 285.3 | 799.9 | 155.1 | 1113 |
| 1997 | 1254 | 286.8 | 809 | 158.2 | 1134.3 |
| 1998 | 1271.6 | 283.6 | 818.2 | 169.7 | 1142 |
| 1999 | 1312.4 | 291.2 | 837 | 184.2 | 1179.8 |
| 2000 | 1313.4 | 291.4 | 839.4 | 182.6 | 1216.6 |
| 2001 | 1212.9 | 278.7 | 774.8 | 159.4 | 1225.1 |
| 2002 | 1151.2 | 265.4 | 733.7 | 152.1 | 1252.7 |
| 2003 | 1125.3 | 264.6 | 707.9 | 153 | 1254.1 |
| 2004 | 1112.7 | 255.9 | 692.1 | 164.7 | 1257.2 |
| 2005 | 1096.6 | 247.6 | 678 | 171 | 1261.4 |
| 2006 | 1069.9 | 236.5 | 654.6 | 178.8 | 1246.8 |
| 2007 | 994.2 | 220 | 607.8 | 166.4 | 1242.3 |
| 2008 | 875.5 | 191.6 | 543.6 | 140.2 | 1176.5 |
| 2009 | 664.2 | 146.5 | 413.6 | 104.1 | 1018.3 |
| 2010 | 678.3 | 152.7 | 418.9 | 107.1 | 1011.6 |
| 2011 | 717.9 | 157.8 | 445.6 | 114.3 | 1057.1 |
| 2012 | 777.3 | 167.5 | 482.9 | 127 | 1095.6 |
| 2013 | 824.9 | 181.5 | 508.8 | 134.6 | 1138.5 |
| 2014 | 872 | 193.9 | 537 | 141.1 | 1187.7 |
| 2015 | 913.6 | 200.8 | 564.8 | 148 | 1238.7 |
| 2016 | 944.2 | 211.9 | 581.1 | 151.3 | 1279 |
| 2017 | 963.4 | 219.1 | 589.4 | 155.2 | 1293.4 |
| 2018 | 998.4 | 233.7 | 599.8 | 165 | 1296.7 |
| 2019 | 993.4 | 237.1 | 594.1 | 162.3 | 1300.8 |
| 2020 | 887.3 | 206.2 | 530.3 | 150.8 | 1202.2 |
| 2021 | 959.8 | 253.6 | 541.7 | 164.5 | 1229.3 |
| 2022 | 1005.5 | 281.5 | 551.9 | 172.1 | 1257.8 |
| 2023 | 1024.7 | 293.5 | 563.8 | 167.5 | 1271.5 |
| 2024 | 1010.2 | 297.8 | 550.9 | 161.4 | 1285.2 |
| 2025 | 967.4 | 285.8 | 524.8 | 156.6 | 1291.8 |
| 2026 | 957.2 | 291.3 | 513.6 | 151 | 1288.7 |
Parts, not assembly, are already the soft spot
The industry is not one payroll. In June 2026 — the latest month with a full split — parts manufacturing employed 513,100 people, 53.6 percent of the motor-vehicles-and-parts total that month. Vehicle assembly employed 293,100. Body and trailer plants employed 149,800. Since July 2019, the mix has shifted the wrong way for anyone betting that “cars” means assembly lines in Michigan. Assembly jobs rose from 236,100. Parts jobs fell from 594,400.
Hours tell a similar story of a plant running a little cooler. Average weekly hours in motor vehicles and parts were 40.9 in July 2026, against 42.4 in July 2019. Overtime was 5.1 hours in June 2026, not collapsed, but the workweek is shorter than it was before the pandemic. Average hourly earnings, not adjusted for inflation, were $37.98 in July 2026, up 40 percent from $27.11 in July 2019. Pay rose. Headcount in the parts plants did not.
Parts jobs have slipped while assembly has held

View exact chart values
| year_month | mvp_thousands | parts_thousands | vehicle_mfg_thousands |
|---|---|---|---|
| 2015-01 | 892.3 | 551.1 | 195.6 |
| 2015-02 | 895.6 | 552.3 | 196.6 |
| 2015-03 | 899.4 | 555.9 | 196.5 |
| 2015-04 | 901.1 | 558.4 | 196 |
| 2015-05 | 912.3 | 564.2 | 200.7 |
| 2015-06 | 911.4 | 565.5 | 201.4 |
| 2015-07 | 919.2 | 569.4 | 201.6 |
| 2015-08 | 922.3 | 569.6 | 203.5 |
| 2015-09 | 928.1 | 574.8 | 205.3 |
| 2015-10 | 928.8 | 573.9 | 204.8 |
| 2015-11 | 926.8 | 571.8 | 203.2 |
| 2015-12 | 925.9 | 570.8 | 203.9 |
| 2016-01 | 930.9 | 576.6 | 203.1 |
| 2016-02 | 933.2 | 577 | 205 |
| 2016-03 | 933.1 | 576.1 | 205.7 |
| 2016-04 | 942.9 | 579.4 | 212.3 |
| 2016-05 | 940.3 | 577.9 | 210.4 |
| 2016-06 | 941.9 | 580.2 | 211.5 |
| 2016-07 | 960.4 | 588 | 223.1 |
| 2016-08 | 949.1 | 583.4 | 213.4 |
| 2016-09 | 947.1 | 582.6 | 213 |
| 2016-10 | 949 | 582.3 | 214.6 |
| 2016-11 | 950.2 | 584.6 | 215.1 |
| 2016-12 | 952.8 | 584.9 | 215.6 |
| 2017-01 | 957.1 | 586.6 | 216.1 |
| 2017-02 | 950.9 | 586.6 | 210.4 |
| 2017-03 | 956 | 587.6 | 213.6 |
| 2017-04 | 958 | 588.9 | 215.1 |
| 2017-05 | 962.7 | 588.7 | 216.8 |
| 2017-06 | 962.8 | 589.9 | 220.1 |
| 2017-07 | 942.7 | 583.1 | 209.2 |
| 2017-08 | 966.5 | 592 | 223.2 |
| 2017-09 | 971.4 | 590.9 | 225.5 |
| 2017-10 | 973.5 | 591.2 | 225.4 |
| 2017-11 | 977.9 | 593.1 | 227 |
| 2017-12 | 981.1 | 593.8 | 226.8 |
| 2018-01 | 984.6 | 592.9 | 231.8 |
| 2018-02 | 989.4 | 594.5 | 232.4 |
| 2018-03 | 997.9 | 597.4 | 234.5 |
| 2018-04 | 997 | 597.6 | 235.5 |
| 2018-05 | 992.9 | 599.6 | 225.7 |
| 2018-06 | 999.5 | 600.6 | 231.7 |
| 2018-07 | 997 | 600.5 | 227.6 |
| 2018-08 | 997.7 | 599.4 | 233.8 |
| 2018-09 | 1001.6 | 603.8 | 234.7 |
| 2018-10 | 1007.9 | 604.9 | 238 |
| 2018-11 | 1007.5 | 603.3 | 238.7 |
| 2018-12 | 1008.3 | 603.2 | 239.5 |
| 2019-01 | 1012.5 | 604.4 | 243.1 |
| 2019-02 | 1012.1 | 604.5 | 242.1 |
| 2019-03 | 1008 | 603 | 239.2 |
| 2019-04 | 1001.1 | 599.8 | 237.6 |
| 2019-05 | 1002.4 | 598.1 | 239.1 |
| 2019-06 | 1001.3 | 597.5 | 238.9 |
| 2019-07 | 993.8 | 594.4 | 236.1 |
| 2019-08 | 989 | 590.4 | 238.4 |
| 2019-09 | 989 | 592.6 | 238.5 |
| 2019-10 | 943.6 | 575.1 | 212.8 |
| 2019-11 | 984.7 | 585 | 239.5 |
| 2019-12 | 983.1 | 583.8 | 240.1 |
| 2020-01 | 979.5 | 581.6 | 237.8 |
| 2020-02 | 987.2 | 582.8 | 245.7 |
| 2020-03 | 980.4 | 579.4 | 240.1 |
| 2020-04 | 628.6 | 389.5 | 118.6 |
| 2020-05 | 672.2 | 417.1 | 119.7 |
| 2020-06 | 866.4 | 534.5 | 183.1 |
| 2020-07 | 910 | 548.9 | 209.3 |
| 2020-08 | 906.1 | 548.4 | 209.6 |
| 2020-09 | 918.2 | 545.5 | 220.7 |
| 2020-10 | 918.3 | 543.4 | 220.7 |
| 2020-11 | 938 | 545.6 | 233.3 |
| 2020-12 | 943.2 | 547.3 | 235.6 |
| 2021-01 | 950.3 | 548.3 | 242.4 |
| 2021-02 | 953.9 | 547 | 247 |
| 2021-03 | 964 | 546.9 | 252.7 |
| 2021-04 | 911 | 529.3 | 223 |
| 2021-05 | 933.2 | 533.6 | 237.4 |
| 2021-06 | 935 | 533.3 | 236.6 |
| 2021-07 | 953.3 | 533.9 | 250.6 |
| 2021-08 | 969.3 | 545.8 | 260.2 |
| 2021-09 | 967.6 | 541.4 | 262.1 |
| 2021-10 | 997.6 | 549.2 | 282.2 |
| 2021-11 | 991.1 | 546.7 | 274.4 |
| 2021-12 | 991.4 | 545.5 | 275.1 |
| 2022-01 | 994.7 | 549.1 | 272.8 |
| 2022-02 | 971.7 | 527.3 | 271.6 |
| 2022-03 | 996.2 | 547.1 | 274.4 |
| 2022-04 | 1005.4 | 551 | 280.8 |
| 2022-05 | 991.9 | 548 | 268.8 |
| 2022-06 | 995.4 | 549.9 | 269.5 |
| 2022-07 | 998.5 | 554.6 | 267.4 |
| 2022-08 | 1015.5 | 554.8 | 292.5 |
| 2022-09 | 1016.4 | 556.9 | 291.9 |
| 2022-10 | 1023.8 | 561.2 | 293.2 |
| 2022-11 | 1025.9 | 560.4 | 296.6 |
| 2022-12 | 1030.5 | 561.9 | 298.7 |
| 2023-01 | 1026.4 | 562.5 | 295.6 |
| 2023-02 | 1028.4 | 562.4 | 295.7 |
| 2023-03 | 1026.1 | 563.4 | 290.5 |
| 2023-04 | 1031 | 565.1 | 297.1 |
| 2023-05 | 1028.3 | 564.9 | 294.3 |
| 2023-06 | 1027.5 | 564.7 | 294.4 |
| 2023-07 | 1025 | 563.6 | 294.7 |
| 2023-08 | 1022.8 | 563.7 | 293.6 |
| 2023-09 | 1028.1 | 566.4 | 297 |
| 2023-10 | 999 | 559.4 | 275.6 |
| 2023-11 | 1026.3 | 564.3 | 295.8 |
| 2023-12 | 1027.6 | 564.8 | 297.4 |
| 2024-01 | 1027.4 | 562.4 | 298.9 |
| 2024-02 | 1018.4 | 555.7 | 297.4 |
| 2024-03 | 1020.1 | 556.3 | 297.4 |
| 2024-04 | 1017.4 | 556.9 | 296.6 |
| 2024-05 | 1015.8 | 557.1 | 296.9 |
| 2024-06 | 1017.7 | 557 | 298.2 |
| 2024-07 | 1021.4 | 554.4 | 303.4 |
| 2024-08 | 1006 | 546.9 | 300.1 |
| 2024-09 | 999.6 | 545.1 | 297.5 |
| 2024-10 | 996.2 | 542.5 | 297.7 |
| 2024-11 | 994.2 | 539.8 | 297.1 |
| 2024-12 | 987.8 | 536.4 | 292.9 |
| 2025-01 | 975.5 | 531.8 | 284.4 |
| 2025-02 | 979.5 | 530.8 | 288.8 |
| 2025-03 | 975.3 | 529.6 | 285.6 |
| 2025-04 | 972.1 | 527.7 | 284 |
| 2025-05 | 974.3 | 526.5 | 289.8 |
| 2025-06 | 971 | 526.1 | 288.1 |
| 2025-07 | 975.4 | 525.4 | 290.2 |
| 2025-08 | 963.2 | 523.5 | 286 |
| 2025-09 | 960.9 | 523 | 284.4 |
| 2025-10 | 955.6 | 521.6 | 280 |
| 2025-11 | 955.3 | 516.2 | 284.8 |
| 2025-12 | 951 | 514.9 | 283.3 |
| 2026-01 | 952.3 | 514 | 286.8 |
| 2026-02 | 957.4 | 512 | 292.8 |
| 2026-03 | 959.1 | 514.5 | 293.1 |
| 2026-04 | 953.7 | 513.3 | 289.9 |
| 2026-05 | 957 | 514.6 | 292.4 |
| 2026-06 | 956.6 | 513.1 | 293.1 |
| 2026-07 | 964.5 | — | — |
Michigan still dominates. The South grew.
State GDP in motor vehicles, bodies and trailers, and parts manufacturing was $185.9 billion in 2024, the latest complete year. Among a selected set of auto-producing states, Michigan still accounted for $43.9 billion, or 23.6 percent of the U.S. industry total. Indiana was second at $20.7 billion. Texas, at $19.3 billion, has become a first-rank auto state. Ohio, Tennessee, California and Kentucky clustered between $10 billion and $12 billion. Alabama, $8.0 billion, is almost ten times its 1997 level. South Carolina was $5.8 billion.
Share of the state economy is the more political number. Auto factories were 6.25 percent of Michigan’s 2024 GDP, 3.99 percent of Indiana’s, 3.62 percent of Kentucky’s and 2.47 percent of Alabama’s. Nationally the same industry was 0.63 percent of U.S. GDP. Ohio’s auto-factory GDP actually fell in nominal dollars from $15.1 billion in 1997 to $12.0 billion in 2024, even as the South and Texas grew. A tariff that scrambled parts plants would not land evenly. It would land first in the states that still mint a visible share of their output from vehicles.
Where the auto factory economy actually sits

View exact chart values
| state | auto_gdp_2024_billions | auto_gdp_1997_billions | share_of_us_auto_gdp_pct | state_total_gdp_2024_billions | auto_share_of_state_gdp_pct |
|---|---|---|---|---|---|
| Michigan | 43.92 | 34.87 | 23.6 | 702.5 | 6.25 |
| Indiana | 20.73 | 8.65 | 11.2 | 519.5 | 3.99 |
| Texas | 19.33 | 3.56 | 10.4 | — | — |
| Ohio | 11.95 | 15.07 | 6.4 | 923.1 | 1.29 |
| Tennessee | 11.21 | 4.17 | 6 | — | — |
| California | 10.8 | 3.07 | 5.8 | — | — |
| Kentucky | 10.69 | 7.64 | 5.8 | 295.4 | 3.62 |
| Alabama | 8.05 | 0.88 | 4.3 | 325.3 | 2.47 |
| South Carolina | 5.8 | 1.47 | 3.1 | 357.1 | 1.62 |
| Wisconsin | 3.24 | 2.26 | 1.7 | — | — |
Auto factories are a state-economy story in Michigan, Indiana and Kentucky

View exact chart values
| state | auto_share_of_state_gdp_pct | auto_gdp_2024_billions |
|---|---|---|
| Michigan | 6.25 | 43.92 |
| Indiana | 3.99 | 20.73 |
| Kentucky | 3.62 | 10.69 |
| Alabama | 2.47 | 8.05 |
| South Carolina | 1.62 | 5.8 |
| Ohio | 1.29 | 11.95 |
Output recovered. The GDP share did not.
In real terms the industry is larger than it looks on the payroll. Real GDP in motor vehicles, bodies and trailers, and parts manufacturing rose 137 percent from 1997 to 2024, from $86.2 billion to $204.0 billion in chained 2017 dollars. Current-dollar output was $112.0 billion in 1997 and $185.9 billion in 2024. The share of the U.S. economy shrank anyway, from 1.31 percent to 0.63 percent, because the rest of the economy grew faster. Compensation of employees in the industry was $96.6 billion in 2024.
Households spend far more on vehicles than factories add in GDP, which is what one would expect once dealers, used cars, imported vehicles and parts, and financing sit between the plant and the driveway. Personal consumption of motor vehicles and parts was $732.8 billion in 2024, against $293.1 billion in 1997. A tariff that raises the price of a Canadian-content pickup does not have to close a Michigan plant to be felt. It can show up in that $733 billion line instead.
Real auto-factory output more than doubled since 1997

View exact chart values
| year | auto_gdp_current_billions | auto_gdp_real_2017_billions | us_gdp_current_billions | auto_share_of_us_gdp_pct | pce_vehicles_parts_billions |
|---|---|---|---|---|---|
| 1997 | 112.02 | 86.2 | 8577.6 | 1.306 | 293.1 |
| 1998 | 123.85 | 95.89 | 9062.8 | 1.367 | 320.2 |
| 1999 | 134.78 | 102.05 | 9631.2 | 1.399 | 350.7 |
| 2000 | 137.5 | 104.97 | 10251 | 1.341 | 363.2 |
| 2001 | 124.94 | 95.66 | 10581.9 | 1.181 | 383.3 |
| 2002 | 135.22 | 107.83 | 10929.1 | 1.237 | 401.3 |
| 2003 | 143.14 | 118.09 | 11456.5 | 1.249 | 401.5 |
| 2004 | 139.12 | 121.9 | 12217.2 | 1.139 | 409.3 |
| 2005 | 135.93 | 129.1 | 13039.2 | 1.042 | 410 |
| 2006 | 134.04 | 143.79 | 13815.6 | 0.97 | 394.9 |
| 2007 | 124.99 | 138.63 | 14474.2 | 0.864 | 400.6 |
| 2008 | 90.34 | 107.32 | 14769.9 | 0.612 | 343.3 |
| 2009 | 47.77 | 46.87 | 14478.1 | 0.33 | 318.6 |
| 2010 | 88.81 | 96.87 | 15049 | 0.59 | 344.5 |
| 2011 | 104.52 | 122.93 | 15599.7 | 0.67 | 365.2 |
| 2012 | 115.77 | 130.31 | 16254 | 0.712 | 396.6 |
| 2013 | 123.34 | 138.54 | 16880.7 | 0.731 | 422.1 |
| 2014 | 133 | 144.73 | 17608.1 | 0.755 | 451.6 |
| 2015 | 146.69 | 144.62 | 18295 | 0.802 | 490.7 |
| 2016 | 155.87 | 152.51 | 18804.9 | 0.829 | 504.6 |
| 2017 | 159.12 | 159.12 | 19612.1 | 0.811 | 529.4 |
| 2018 | 161.11 | 165.71 | 20656.5 | 0.78 | 550 |
| 2019 | 161.75 | 167.25 | 21540 | 0.751 | 545 |
| 2020 | 142.74 | 148.38 | 21375.3 | 0.668 | 546.8 |
| 2021 | 143.29 | 175.8 | 23725.6 | 0.604 | 697 |
| 2022 | 166.56 | 211.98 | 26054.6 | 0.639 | 726.4 |
| 2023 | 182.74 | 202.68 | 27811.5 | 0.657 | 750.4 |
| 2024 | 185.85 | 203.98 | 29298 | 0.634 | 732.8 |
What this does not prove
None of these series measures Canadian content. None estimates how many of the 513,000 parts jobs depend on Ontario or how many F-350s would be uneconomic if light-duty terms stayed and heavy-duty terms did not. Hours, pay and GDP are descriptions, not a model of incidence. The 50 percent tariff is a 2027 threat, not a 2026 payroll event.
What the books do show is the scale of the U.S. side: about 965,000 factory jobs, more than a million more at dealers, $186 billion in factory GDP, a parts workforce already smaller than before the pandemic, and a state map still centred on Michigan even as Texas and the South gained. If the argument is that America does not need Canada, the payroll file is an odd place to look for comfort. The plants that would have to reroute the supply chain are already a little leaner than they were in 2019, and they still sit in the same states that will be asked to like the politics of a trade war.
Sources and methods
This is retrospective enrichment using pinned catalogue snapshots, not an as-known-on-the-edition-date reconstruction. Research was compiled on 11 September 2026 against the 24 August 2026 National edition.
Employment, hours and earnings are from the U.S. Bureau of Labor Statistics Current Employment Statistics snapshot dated 24 August 2026 (release lineage bls-ce-snapshot-2026-08-24). Series are national, seasonally adjusted, monthly. Motor vehicles and parts (CES3133600101), motor vehicle manufacturing, parts manufacturing, body and trailer manufacturing, automobile dealers, and iron and steel mills are separate industries and are not added together except where the CES aggregate is used. Latest complete month for the aggregate, hours, earnings and dealers is July 2026. Latest complete month for the vehicle/parts/body split, overtime and steel is June 2026.
State and national GDP in motor vehicles, bodies and trailers, and parts manufacturing (NAICS 3361–3363) and all-industry GDP are from BEA annual GDP by state, release bea-regional-state-annual-2026-04-09. Latest complete industry year is 2024; 2025 industry values were not observed. Current-dollar and chained-2017-dollar series are kept distinct. Compensation of employees in the same industry is thousands of dollars and is reported as billions after dividing by 1,000,000. State rankings use a selected set of auto-producing states, not a complete 50-state census; shares of U.S. auto GDP therefore understate the rest-of-country remainder.
Personal consumption of motor vehicles and parts is from BEA PCE by state, release bea-sapce-2025-09-26, through 2024. PCE is household spending, not factory output, and includes new and used vehicles and parts.
Missing observations were skipped and not treated as zero. Annual employment averages use available months in each year; 2026 averages are January–July for the aggregate. No causal effect of tariffs, no Canada import share, and no household price impact is inferred from these descriptive series. Later BEA or BLS revisions may differ from these snapshots.
Research completed 2026-09-11, for the August 24, 2026 news edition. This is retrospective analysis, not a reconstruction of information available that day.