Research
The factory boom, measured where the plants closed
The plant-gate stories, and the statewide books
Today’s Associated Press account walks through factory towns that did not get the renaissance they were promised. Howard Miller, the Zeeland, Michigan, clockmaker, closed after a century. Case’s Burlington, Iowa, backhoe plant emptied out. Winnebago cut jobs in Iowa. Vornado Air laid off workers in Wichita. A bicycle factory in South Carolina went dark. A White House spokeswoman, asked about those losses, said a factory boom was underway anyway, citing manufacturing output and construction trades that would eventually become factory jobs. The payroll question is more specific: in the states those plants sit in, have official factory jobs already fallen since January 2025?
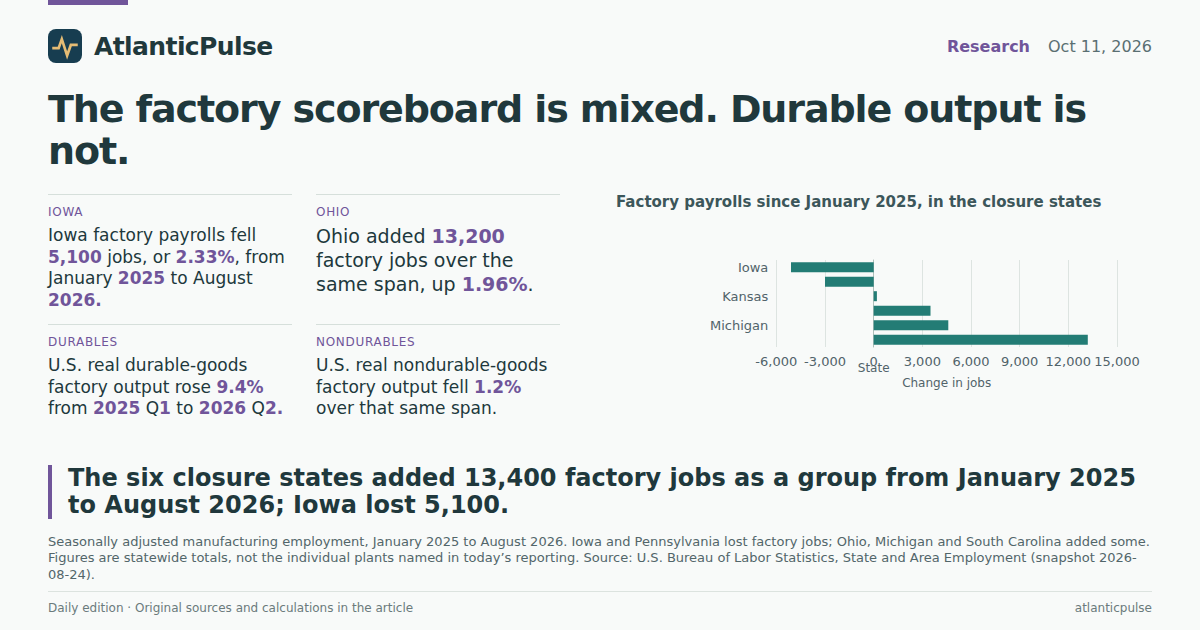
The Bureau of Labor Statistics state manufacturing series, seasonally adjusted, run through August 2026. They are statewide totals, not a census of the named plants, and they are not the national manufacturing count the AP used when it wrote that the sector still had fewer employees than when President Trump returned to office. In these six states the picture is mixed. Iowa lost 5,100 factory jobs, or 2.33 percent, from January 2025 to August 2026. Pennsylvania lost 3,000, or 0.54 percent. Kansas was essentially flat, up 200 jobs. South Carolina added 3,500 (1.33 percent). Michigan added 4,600 (0.79 percent). Ohio added 13,200 (1.96 percent). Taken together, the six states went from 2,469,200 manufacturing jobs to 2,482,600, a net gain of 13,400, or 0.54 percent. A local closure can be real, and still not show up as a statewide collapse.
Factory payrolls since January 2025, in the closure states

View exact chart values
| state | job_change | pct_change |
|---|---|---|
| Iowa | -5100 | -2.33 |
| Pennsylvania | -3000 | -0.54 |
| Kansas | 200 | 0.12 |
| South Carolina | 3500 | 1.33 |
| Michigan | 4600 | 0.79 |
| Ohio | 13200 | 1.96 |
January 2025 is the political baseline. It is not the whole slide.
Index the same series to January 2025 and Iowa is the state that never climbs back. Its manufacturing line sits below the baseline for every month of 2025 and 2026 in the chart, ending August at 97.7. Pennsylvania drifts under 100 and stays there. Kansas hugs the line. South Carolina, Ohio and Michigan finish a little above it. That is the scoreboard that matches the political calendar. It is not the scoreboard that matches the longer factory slump workers have been living through.
Michigan is the clearest example. Seasonally adjusted factory employment there was 613,700 in January 2024, 578,700 in January 2025, and 583,300 in August 2026. From the month Trump returned, Michigan is slightly up. From January 2024 it is down 4.95 percent. January 2025 was also a one-month trough: the index jumped back above 102 in February 2025, which means a slice of Michigan’s “gain” since inauguration is just the rebound from that print. Iowa’s longer window is uglier in the same way, down 4.76 percent from January 2024. Ohio is the outlier that actually gained over both spans. None of those paths, by themselves, prove that tariffs closed a plant or that tariffs saved one. They do show that a January 2025 snapshot can make a sliding factory state look like it has turned the corner.
Indexed factory employment: January 2025 = 100

View exact chart values
| period | Michigan | Ohio | Pennsylvania | South_Carolina | Iowa | Kansas |
|---|---|---|---|---|---|---|
| 2023-01 | 106.7 | 101.96 | 101.41 | 100.38 | 103.37 | 100 |
| 2023-02 | 106.81 | 101.93 | 101.34 | 100.27 | 103.24 | 100.29 |
| 2023-03 | 107.05 | 101.96 | 101.3 | 100.23 | 103.19 | 100.12 |
| 2023-04 | 107.12 | 101.97 | 101.32 | 100.04 | 103.15 | 99.83 |
| 2023-05 | 107.17 | 101.97 | 101.23 | 100.15 | 103.06 | 99.94 |
| 2023-06 | 107.4 | 102.24 | 101.3 | 100.23 | 103.37 | 100.35 |
| 2023-07 | 108.21 | 102.24 | 100.95 | 100.27 | 103.6 | 100.23 |
| 2023-08 | 107.26 | 102.04 | 101 | 100.27 | 103.74 | 100.29 |
| 2023-09 | 107.41 | 102.1 | 101.2 | 100.34 | 103.83 | 100.52 |
| 2023-10 | 104.23 | 100.79 | 100.95 | 100.27 | 102.64 | 99.6 |
| 2023-11 | 105.94 | 101.29 | 100.5 | 100.27 | 102.78 | 100.35 |
| 2023-12 | 106.07 | 101.53 | 101 | 100.27 | 102.87 | 100.75 |
| 2024-01 | 106.05 | 101.61 | 100.86 | 100.34 | 102.55 | 100.87 |
| 2024-02 | 105.69 | 101.51 | 100.75 | 100.34 | 102.74 | 101.04 |
| 2024-03 | 105.44 | 101.47 | 100.86 | 100.38 | 102.74 | 101.1 |
| 2024-04 | 105.27 | 101.36 | 100.55 | 100.61 | 102.42 | 101.21 |
| 2024-05 | 105.43 | 101.45 | 100.5 | 100.61 | 102.46 | 101.44 |
| 2024-06 | 105.1 | 101.53 | 100.64 | 100.84 | 102.37 | 101.33 |
| 2024-07 | 104.03 | 100.96 | 100.5 | 100.5 | 101.19 | 100.63 |
| 2024-08 | 104.84 | 101.02 | 100.5 | 100.46 | 100.96 | 101.21 |
| 2024-09 | 104.89 | 101.27 | 100.54 | 100.42 | 100.91 | 101.21 |
| 2024-10 | 102.21 | 100.4 | 100.29 | 100.34 | 99.54 | 98.79 |
| 2024-11 | 102.85 | 100.67 | 100.21 | 100.3 | 99.41 | 100.87 |
| 2024-12 | 102.92 | 100.56 | 100.14 | 100.23 | 99.18 | 100.23 |
| 2025-01 | 100 | 100 | 100 | 100 | 100 | 100 |
| 2025-02 | 102.06 | 100.55 | 99.89 | 99.85 | 99.59 | 99.77 |
| 2025-03 | 101.81 | 100.55 | 99.8 | 99.85 | 99.41 | 99.88 |
| 2025-04 | 101.81 | 100.56 | 99.71 | 99.85 | 99.45 | 99.83 |
| 2025-05 | 101.97 | 100.49 | 99.66 | 100.19 | 99.36 | 100.52 |
| 2025-06 | 101.59 | 100.33 | 99.39 | 99.85 | 99 | 99.48 |
| 2025-07 | 101.38 | 100.06 | 99.25 | 99.73 | 98.04 | 99.54 |
| 2025-08 | 101.16 | 100.1 | 99.07 | 99.89 | 97.95 | 99.54 |
| 2025-09 | 101.16 | 99.88 | 98.86 | 99.89 | 97.63 | 99.42 |
| 2025-10 | 101.04 | 100.46 | 98.77 | 100.15 | 98.08 | 99.65 |
| 2025-11 | 100.55 | 100.64 | 98.57 | 99.92 | 98.27 | 99.71 |
| 2025-12 | 100.66 | 100.62 | 98.59 | 99.77 | 97.63 | 99.48 |
| 2026-01 | 100 | 100.39 | 98.95 | 99.66 | 98.08 | 99.71 |
| 2026-02 | 100.05 | 100.4 | 98.48 | 100.5 | 97.81 | 99.88 |
| 2026-03 | 100.29 | 100.16 | 98.95 | 100.38 | 97.54 | 99.77 |
| 2026-04 | 100.21 | 100.77 | 99 | 100.34 | 97.54 | 99.08 |
| 2026-05 | 100.64 | 100.9 | 99.16 | 100.08 | 97.49 | 99.6 |
| 2026-06 | 100.55 | 101.29 | 99.3 | 100.3 | 97.13 | 100.81 |
| 2026-07 | 101.14 | 102.06 | 99.5 | 100.88 | 97.08 | 100.12 |
| 2026-08 | 100.79 | 101.96 | 99.46 | 101.33 | 97.67 | 100.12 |
Factories versus the rest of the job market
If factory payrolls were merely tracking a weak state economy, total nonfarm employment would tell the same story. It does not, not evenly. Iowa is the only one of the six where the whole job market shrank from January 2025 to August 2026, and manufacturing fell faster than the statewide total (2.33 percent versus 0.87 percent). Pennsylvania’s overall payroll rose 0.65 percent while factories fell. Kansas, South Carolina and the statewide counts in those places outpaced manufacturing. Michigan and Ohio are the reverse: factory jobs grew faster than all jobs.
Manufacturing’s share of each state’s payroll barely moved. Iowa remained the most factory-heavy of the six, at 13.5 percent of nonfarm jobs in August 2026, down a tenth of a point. Michigan was 13.0 percent, Ohio 12.1 percent, Kansas 11.8 percent, South Carolina 11.0 percent, Pennsylvania 9.0 percent. These are still factory states. They are not states whose official books show a sudden emptying of the shop floor since Liberation Day. The Zeeland and Burlington stories sit inside that slower arithmetic.
Factory jobs versus the rest of the payroll

View exact chart values
| state | manufacturing_pct | total_nonfarm_pct |
|---|---|---|
| Iowa | -2.33 | -0.87 |
| Pennsylvania | -0.54 | 0.65 |
| Kansas | 0.12 | 0.9 |
| South Carolina | 1.33 | 2.2 |
| Michigan | 0.79 | 0.41 |
| Ohio | 1.96 | 0.57 |
The output claim is half right
The White House’s other defense was output, not headcount. Quarterly state GDP from the Bureau of Economic Analysis lets that claim be checked, with two hard limits. The figures are real, seasonally adjusted annual rates in chained 2017 dollars, through 2026 Q2. Durable-goods manufacturing and nondurable-goods manufacturing cannot be added together in chained dollars, so they have to be read as two industries. They do not move as one.
Durable-goods output rose everywhere in the set. From 2025 Q1 to 2026 Q2, U.S. real durable-goods manufacturing GDP increased 9.4 percent, from about $1.27 trillion to $1.39 trillion at an annual rate. Kansas was up 12.81 percent, South Carolina 10.57 percent, Ohio 8.93 percent, Iowa 6.59 percent, Michigan 6.55 percent, Pennsylvania 4.44 percent. That is the chart that most resembles a boom. Nondurable-goods manufacturing went the other way. U.S. real nondurable output fell 1.2 percent over the same span. It fell in all six states, by 1.11 percent in Pennsylvania and 5.11 percent in Kansas. A spokeswoman citing “manufacturing output” without saying which factories is choosing the half of the sector that went up.
Durable-goods factory output rose after early 2025

View exact chart values
| quarter | United_States | Michigan | Ohio | Pennsylvania | South_Carolina | Iowa | Kansas |
|---|---|---|---|---|---|---|---|
| 2023-Q1 | 99.24 | 102.29 | 99.29 | 101.07 | 95.64 | 103.81 | 96.26 |
| 2023-Q2 | 100.8 | 104.74 | 101.02 | 102.34 | 96.81 | 101.68 | 98.11 |
| 2023-Q3 | 101.73 | 105.06 | 101.42 | 102.76 | 99.87 | 103.22 | 99.28 |
| 2023-Q4 | 102.49 | 102.99 | 102.27 | 102.66 | 99.83 | 107.2 | 98.71 |
| 2024-Q1 | 99.87 | 102.98 | 98.56 | 100.67 | 98.42 | 101.84 | 96.18 |
| 2024-Q2 | 100.51 | 104.24 | 100.91 | 101.2 | 99.62 | 104.49 | 98.96 |
| 2024-Q3 | 101.16 | 101.66 | 100.1 | 100.56 | 99.83 | 104.07 | 99.85 |
| 2024-Q4 | 100.25 | 99.19 | 98.82 | 100.11 | 100.41 | 103.07 | 98.7 |
| 2025-Q1 | 100 | 100 | 100 | 100 | 100 | 100 | 100 |
| 2025-Q2 | 103.02 | 101.93 | 101.13 | 101.14 | 103.12 | 101.5 | 102.97 |
| 2025-Q3 | 104.92 | 103.23 | 102.88 | 102.66 | 104.93 | 101.23 | 105.78 |
| 2025-Q4 | 105.5 | 103.97 | 103.95 | 102.44 | 105.72 | 100.75 | 110.53 |
| 2026-Q1 | 106.77 | 103.73 | 105.65 | 101.66 | 106.84 | 104.49 | 109.98 |
| 2026-Q2 | 109.4 | 106.55 | 108.93 | 104.44 | 110.57 | 106.59 | 112.81 |
Jobs and output on the same map
Put job-change against durable-output-change and no state sits in the simple “boom” quadrant of both more jobs and more output without a caveat, because the job axis is mixed. All six states are above zero on durable output. Only Iowa and Pennsylvania are below zero on jobs. Iowa is the starkest split: 5,100 fewer factory jobs and 6.59 percent more durable real GDP. That pattern is consistent with plants running with fewer people, with a mix of industries inside “manufacturing,” and with timing differences between a monthly payroll survey and a quarterly output account. It is not a measurement of tariff incidence.
The honest midterm reading is narrower than either campaign would like. In the states today’s closure reporting actually named, official factory payrolls have not collapsed since January 2025, and in Ohio they have risen. Iowa is the state where the books already match the obituaries. Durable-goods output has risen even in the job-losing states; nondurable output has not. Workers who lost a shift in Zeeland, Burlington or Wichita are not a rounding error, and they are not, on these official series, the same thing as a national factory depression. The renaissance, if it is coming, is not yet a payroll event in Iowa. The boom, if it is here, is showing up more clearly in durable-goods GDP than in the badge readers at the plant gate.
Jobs and durable output did not move together

View exact chart values
| state | mfg_jobs_pct_since_jan2025 | durable_gdp_pct_since_q1_2025 | nondurable_gdp_pct_since_q1_2025 |
|---|---|---|---|
| Michigan | 0.79 | 6.55 | -2.47 |
| Ohio | 1.96 | 8.93 | -1.24 |
| Pennsylvania | -0.54 | 4.44 | -1.11 |
| South Carolina | 1.33 | 10.57 | -2.96 |
| Iowa | -2.33 | 6.59 | -3.67 |
| Kansas | 0.12 | 12.81 | -5.11 |
Sources and methods
Payrolls are BLS State and Area Employment, statewide manufacturing and total nonfarm, seasonally adjusted, monthly, in thousands of jobs. The pinned snapshot is bls-sm-snapshot-2026-08-24; the last month used is August 2026, not September or October 2026. These series are not the national CES manufacturing total cited in today’s reporting.
January 2025 is used as the political baseline because it is the month President Trump returned to office and the comparison in the AP plant-closure account. January 2024 is shown as a longer window. Michigan’s January 2025 manufacturing print was a one-month trough relative to December 2024 and February 2025.
Output is BEA quarterly real GDP by state, seasonally adjusted annual rate, millions of chained 2017 dollars, release bea-regional-state-quarterly-2026-09-30, through 2026 Q2. Durable-goods manufacturing and nondurable-goods manufacturing are kept separate and are not summed. Percent changes compare 2025 Q1 with 2026 Q2.
Null observations were not treated as zero. No duplicate period_start values appeared in the extracts used. Statewide employment sums across the six states are valid; chained-dollar GDP series are not added across industries.
The calculations describe coincident changes in official series. They do not estimate the effect of tariffs, plant closures, or any other single cause. A local plant closing can be real without moving the statewide manufacturing total by the same amount.
Research completed 2026-10-12, for the October 11, 2026 news edition. The available source data may cover earlier periods; see the observation periods and source vintages above.