Research
The Dallas Fed heard a rebound. Texas factory payrolls had not.
A survey bounce is not a hiring boom
On the last Monday in August, a Dallas Fed factory survey did what regional Fed indexes love to do: it leapt. The Texas manufacturing business index, a diffusion measure of executives’ reports on general activity, jumped to 11.6 in August from 1.3 in July. Anything above zero is expansion. The write-up talked of stronger new orders and production in a state that still makes a lot of electronics and petrochemicals. It was one month, and the Bank itself noted that uncertainty had not left the building.
The official payroll tape is less cinematic, and it is also a month behind. Seasonally adjusted state factory employment from the Bureau of Labor Statistics runs only through July 2026 in the snapshot used here. Those books do not yet include whatever August’s purchasing managers thought they saw. They do show that Texas factories employed 979,700 people in July, 5,800 fewer than in July 2025 — a 0.6 percent decline. The national factory payroll, from the Current Employment Statistics survey, was 12.61 million, down 14,000 jobs, or 0.1 percent, over the same year. Illinois, whose Chicago purchasing managers were also in the news that day, added 2,100 factory jobs, a 0.4 percent increase, to 571,000.
That is the first useful distinction. A diffusion index can turn on a handful of plants reporting better orders. A payroll count has to hire someone. Texas is still a larger factory state than Illinois by a wide margin. It is not, on the latest annual comparison, a hiring boom.
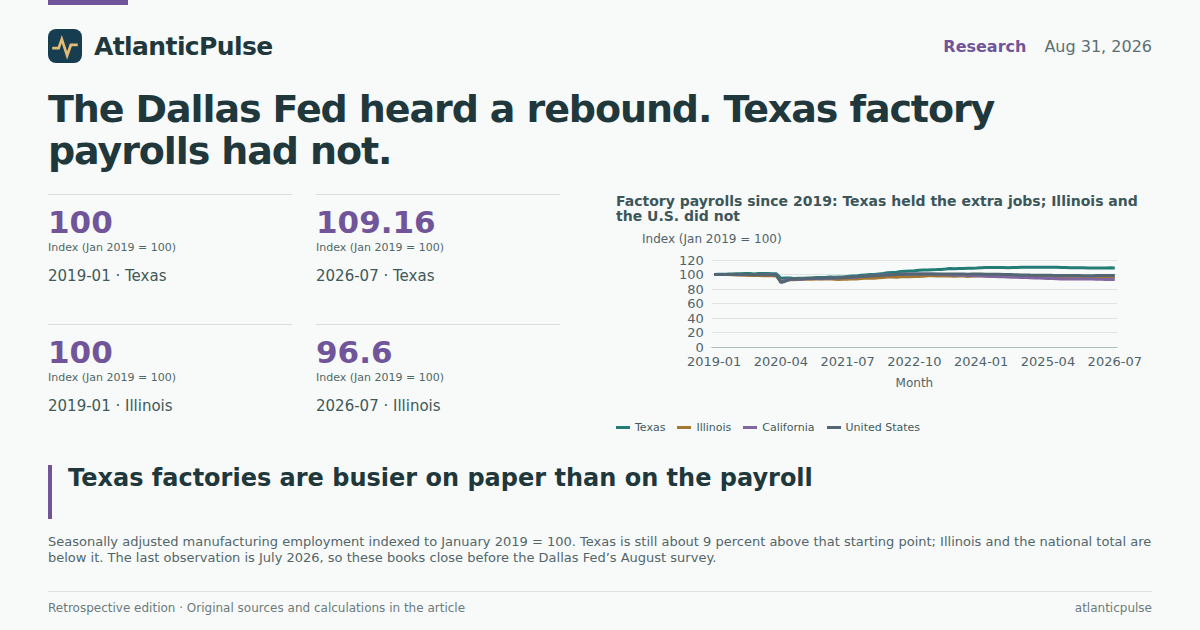
Factory payrolls since 2019: Texas held the extra jobs; Illinois and the U.S. did not

View exact chart values
| month | texas | illinois | california | united_states |
|---|---|---|---|---|
| 2019-01 | 100 | 100 | 100 | 100 |
| 2019-02 | 100.27 | 100.07 | 99.98 | 99.94 |
| 2019-03 | 100.39 | 99.98 | 99.86 | 99.98 |
| 2019-04 | 100.53 | 99.9 | 99.92 | 99.96 |
| 2019-05 | 100.76 | 99.61 | 99.95 | 99.91 |
| 2019-06 | 100.96 | 99.32 | 99.99 | 99.98 |
| 2019-07 | 101.11 | 99.24 | 99.74 | 100 |
| 2019-08 | 101.27 | 98.97 | 99.98 | 99.99 |
| 2019-09 | 101.29 | 98.8 | 99.98 | 99.98 |
| 2019-10 | 100.77 | 98.7 | 99.99 | 99.55 |
| 2019-11 | 101.27 | 98.48 | 99.96 | 99.9 |
| 2019-12 | 101.18 | 98.16 | 99.95 | 99.77 |
| 2020-01 | 101.29 | 98.29 | 100.05 | 99.65 |
| 2020-02 | 101.14 | 98.17 | 99.81 | 99.63 |
| 2020-03 | 100.92 | 97.99 | 99.35 | 99.17 |
| 2020-04 | 94.85 | 90.37 | 90.27 | 88.99 |
| 2020-05 | 95.11 | 91.2 | 92.05 | 90.77 |
| 2020-06 | 95.3 | 92.69 | 93.85 | 93.43 |
| 2020-07 | 94.61 | 92.88 | 93.19 | 93.61 |
| 2020-08 | 94.75 | 93.27 | 93.58 | 93.82 |
| 2020-09 | 94.95 | 93.62 | 93.94 | 94.27 |
| 2020-10 | 95.21 | 93.55 | 94.28 | 94.5 |
| 2020-11 | 95.36 | 93.39 | 94.34 | 94.75 |
| 2020-12 | 95.69 | 93.72 | 94.46 | 95.02 |
| 2021-01 | 95.88 | 93.79 | 94.12 | 94.93 |
| 2021-02 | 95.68 | 93.67 | 94.67 | 95.17 |
| 2021-03 | 96.36 | 94.13 | 95.1 | 95.61 |
| 2021-04 | 96.11 | 93.5 | 95.28 | 95.33 |
| 2021-05 | 96.35 | 93.06 | 95.48 | 95.51 |
| 2021-06 | 96.72 | 93.37 | 95.56 | 95.75 |
| 2021-07 | 97.37 | 93.49 | 96.04 | 96.21 |
| 2021-08 | 97.76 | 94.06 | 96.19 | 96.58 |
| 2021-09 | 97.85 | 93.91 | 96.18 | 96.9 |
| 2021-10 | 98.93 | 94.42 | 97.34 | 97.37 |
| 2021-11 | 99.47 | 94.94 | 97.83 | 97.72 |
| 2021-12 | 100.06 | 95.35 | 98.23 | 98.02 |
| 2022-01 | 100 | 94.94 | 98.51 | 98.23 |
| 2022-02 | 100.79 | 95.57 | 99.12 | 98.52 |
| 2022-03 | 101.45 | 95.97 | 99.43 | 99.09 |
| 2022-04 | 102.36 | 96.63 | 99.85 | 99.5 |
| 2022-05 | 102.8 | 96.36 | 99.94 | 99.57 |
| 2022-06 | 103.12 | 96.11 | 100.15 | 99.82 |
| 2022-07 | 104.03 | 97.01 | 100.5 | 100.08 |
| 2022-08 | 104.52 | 96.94 | 100.7 | 100.33 |
| 2022-09 | 105.01 | 96.94 | 100.67 | 100.46 |
| 2022-10 | 105.29 | 97.23 | 100.7 | 100.73 |
| 2022-11 | 105.75 | 97.29 | 100.72 | 100.83 |
| 2022-12 | 106.07 | 97.48 | 100.65 | 100.82 |
| 2023-01 | 106.23 | 98.29 | 100.65 | 100.88 |
| 2023-02 | 106.53 | 98.17 | 100.52 | 100.84 |
| 2023-03 | 106.81 | 97.9 | 100.35 | 100.77 |
| 2023-04 | 107.03 | 97.82 | 100.04 | 100.73 |
| 2023-05 | 107.41 | 97.83 | 99.86 | 100.62 |
| 2023-06 | 108.17 | 98.09 | 99.64 | 100.66 |
| 2023-07 | 107.82 | 97.48 | 98.96 | 100.56 |
| 2023-08 | 108.14 | 97.8 | 98.87 | 100.56 |
| 2023-09 | 108.37 | 98.05 | 98.99 | 100.64 |
| 2023-10 | 108.55 | 97.14 | 98.83 | 100.37 |
| 2023-11 | 108.58 | 97.89 | 98.21 | 100.54 |
| 2023-12 | 108.85 | 97.94 | 98.16 | 100.64 |
| 2024-01 | 109.27 | 97.94 | 98.24 | 100.66 |
| 2024-02 | 109.46 | 98.04 | 97.62 | 100.48 |
| 2024-03 | 109.59 | 98.17 | 97.4 | 100.36 |
| 2024-04 | 109.6 | 98.12 | 97.19 | 100.34 |
| 2024-05 | 109.72 | 98.17 | 96.91 | 100.27 |
| 2024-06 | 109.77 | 97.99 | 96.81 | 100.19 |
| 2024-07 | 109.4 | 97.9 | 96.43 | 100.13 |
| 2024-08 | 109.75 | 97.83 | 96.22 | 99.86 |
| 2024-09 | 109.84 | 97.8 | 96.1 | 99.75 |
| 2024-10 | 109.91 | 97.56 | 95.8 | 99.27 |
| 2024-11 | 110.06 | 97.5 | 95.68 | 99.38 |
| 2024-12 | 110.05 | 97.21 | 95.42 | 99.24 |
| 2025-01 | 109.98 | 96.58 | 95.31 | 99.09 |
| 2025-02 | 110.01 | 96.67 | 95.09 | 99.07 |
| 2025-03 | 110.06 | 96.84 | 94.82 | 99.03 |
| 2025-04 | 110.11 | 96.92 | 94.67 | 99 |
| 2025-05 | 110.07 | 96.3 | 94.49 | 98.91 |
| 2025-06 | 109.89 | 96.26 | 94.22 | 98.8 |
| 2025-07 | 109.81 | 96.24 | 93.91 | 98.71 |
| 2025-08 | 109.6 | 96.13 | 93.88 | 98.63 |
| 2025-09 | 109.44 | 95.79 | 93.61 | 98.61 |
| 2025-10 | 109.3 | 95.55 | 93.91 | 98.54 |
| 2025-11 | 109.2 | 95.4 | 93.74 | 98.46 |
| 2025-12 | 109.31 | 95.16 | 93.81 | 98.36 |
| 2026-01 | 108.86 | 96.3 | 93.91 | 98.37 |
| 2026-02 | 109.05 | 96.06 | 93.74 | 98.38 |
| 2026-03 | 109.08 | 95.94 | 93.53 | 98.5 |
| 2026-04 | 108.82 | 96.13 | 93.39 | 98.49 |
| 2026-05 | 108.78 | 96.65 | 93.3 | 98.48 |
| 2026-06 | 109.23 | 96.6 | 93.05 | 98.56 |
| 2026-07 | 109.16 | 96.6 | 92.95 | 98.6 |
Texas kept more of the post-2019 jobs. It did not add them this year.
Look further back and Texas still looks like the adult in the room. From January 2019 through July 2026, Texas manufacturing employment is up 9.2 percent. Illinois is down 3.4 percent. The United States is down 1.4 percent. California, still the largest factory payroll in this set at 1.20 million jobs, is down 7.1 percent from early 2019 and down another 1.0 percent over the latest year. The 2020 collapse shows up everywhere; what differs is who got the jobs back. Texas did. Most of the old industrial Midwest, in this cut, did not fully.
Over the year to July 2026, the ranking is almost the reverse of that long view. Among eleven large factory states, Ohio is the clearest gainer, up 13,200 jobs, or 2.0 percent. Georgia, Illinois and Pennsylvania are slightly positive. Wisconsin is flat. Michigan, Indiana and Texas are slightly negative. North Carolina is down 2.2 percent, New York 1.8 percent, California 1.0 percent. Size is not destiny: the two biggest payrolls here, California and Texas, both shrank a little. Ohio combined a large factory base with the only solid gain.
None of this is a verdict on August. July is July. It does mean that if the Dallas Fed’s bounce is the start of something, it had not yet walked onto the employment report. If it is a one-month mood swing, the payrolls will not have to apologize.
Over the year to July 2026, Texas factories shed jobs; Illinois added a few

View exact chart values
| state | change_pct | change_thousands | july_2026_thousands |
|---|---|---|---|
| North Carolina | -2.16 | -9.9 | 449.3 |
| New York | -1.76 | -7.1 | 397.2 |
| California | -1.03 | -12.5 | 1201.9 |
| Texas | -0.59 | -5.8 | 979.7 |
| Indiana | -0.35 | -1.8 | 512 |
| Michigan | -0.2 | -1.2 | 585.5 |
| Wisconsin | -0.02 | -0.1 | 458.4 |
| Pennsylvania | 0.36 | 2 | 558.1 |
| Illinois | 0.37 | 2.1 | 571 |
| Georgia | 0.45 | 1.9 | 426.3 |
| Ohio | 1.95 | 13.2 | 688.7 |
Bigger factory states were not the ones hiring

View exact chart values
| state | jobs_thousands | change_pct |
|---|---|---|
| North Carolina | 449.3 | -2.16 |
| New York | 397.2 | -1.76 |
| California | 1201.9 | -1.03 |
| Texas | 979.7 | -0.59 |
| Indiana | 512 | -0.35 |
| Michigan | 585.5 | -0.2 |
| Wisconsin | 458.4 | -0.02 |
| Pennsylvania | 558.1 | 0.36 |
| Illinois | 571 | 0.37 |
| Georgia | 426.3 | 0.45 |
| Ohio | 688.7 | 1.95 |
The plants are producing more than they are staffing
Employment is the wrong ledger if the question is whether Texas factories are busy. Real manufacturing GDP — output, not headcount — tells a louder story. In 2026Q1, Texas factory output was $280.2 billion at a seasonally adjusted annual rate, in chained 2017 dollars, according to BEA quarterly state GDP. That is 32.5 percent above 2019Q1. Illinois factory output was $108.9 billion, only 3.4 percent above early 2019. The United States was 11.0 percent higher. Over the year to 2026Q1, Texas output was up 2.2 percent; Illinois and the nation were up about 4.8 percent. So Texas has the long boom; Illinois has the fresher year-over-year pulse. Neither series is a jobs report.
The mix inside Texas is the giveaway. Durable-goods output — machinery, metals, equipment — was $119.6 billion in 2026Q1. Nondurables — chemicals, refining, plastics and the rest of the short-lived pile — were $159.3 billion. Those chained-dollar pieces should not be added; they can be compared. After 2021 the nondurable line pulled away. Chemical manufacturing alone, on the annual books, rose from $47.1 billion in 2015 to $71.5 billion in 2024. That is the Gulf Coast showing up in the national accounts: more stuff per worker, and a lot of it measured in tanks rather than assembly lines.
Hours fit the same picture. Average weekly hours of all Texas manufacturing employees, not seasonally adjusted, were 42.5 in July 2026, down from 43.1 in July 2025 and a touch below 42.9 in July 2019. The workweek did not lengthen into a boom. Combined with a slightly smaller payroll, that is not a portrait of plants running extra shifts to keep up with a sudden August rush — at least not yet.
Texas factory output ran far ahead of the payroll

View exact chart values
| quarter | texas | illinois | united_states |
|---|---|---|---|
| 2019Q1 | 100 | 100 | 100 |
| 2019Q2 | 97.69 | 100 | 100.64 |
| 2019Q3 | 97.5 | 99.22 | 101.49 |
| 2019Q4 | 95.69 | 96.36 | 101.08 |
| 2020Q1 | 91.49 | 93.9 | 98.52 |
| 2020Q2 | 83.91 | 85.8 | 88.88 |
| 2020Q3 | 91.16 | 96.31 | 99.26 |
| 2020Q4 | 96.79 | 98.44 | 101.25 |
| 2021Q1 | 99.46 | 101.34 | 102.61 |
| 2021Q2 | 103.23 | 103.65 | 103.91 |
| 2021Q3 | 108 | 101.48 | 103.68 |
| 2021Q4 | 115.67 | 101.23 | 106.61 |
| 2022Q1 | 112.07 | 102.07 | 104.47 |
| 2022Q2 | 110.66 | 97.98 | 103.04 |
| 2022Q3 | 112.06 | 97.76 | 102.77 |
| 2022Q4 | 111.73 | 101.01 | 103.06 |
| 2023Q1 | 114.97 | 94.41 | 100.79 |
| 2023Q2 | 115.13 | 96.71 | 102.55 |
| 2023Q3 | 118.66 | 101.1 | 105.29 |
| 2023Q4 | 121.84 | 102.83 | 106.77 |
| 2024Q1 | 123.11 | 100.68 | 104.85 |
| 2024Q2 | 129.61 | 101.67 | 107.33 |
| 2024Q3 | 133.18 | 102.73 | 108.24 |
| 2024Q4 | 134.44 | 98.3 | 107.54 |
| 2025Q1 | 129.7 | 98.63 | 105.91 |
| 2025Q2 | 134.02 | 101.68 | 108.97 |
| 2025Q3 | 134.62 | 102.86 | 110.31 |
| 2025Q4 | 132.73 | 101.12 | 109.13 |
| 2026Q1 | 132.54 | 103.38 | 110.96 |
The Texas factory boom is a nondurable-goods story

View exact chart values
| quarter | durable | nondurable |
|---|---|---|
| 2015Q1 | 100260.9 | 102361 |
| 2015Q2 | 95469.9 | 97794.1 |
| 2015Q3 | 94869.3 | 102137.8 |
| 2015Q4 | 94809.5 | 107096 |
| 2016Q1 | 95268 | 93602.6 |
| 2016Q2 | 95321.3 | 99573.2 |
| 2016Q3 | 96573.7 | 100401.7 |
| 2016Q4 | 95465.8 | 95877.5 |
| 2017Q1 | 96570.1 | 99154 |
| 2017Q2 | 96242.6 | 98172.6 |
| 2017Q3 | 99516.9 | 98337.4 |
| 2017Q4 | 103031.2 | 104329.1 |
| 2018Q1 | 108031.1 | 111650.4 |
| 2018Q2 | 108842.3 | 114130.2 |
| 2018Q3 | 107936.6 | 115699.8 |
| 2018Q4 | 107607.2 | 115693.1 |
| 2019Q1 | 104267.8 | 107093.9 |
| 2019Q2 | 103015.6 | 103550.5 |
| 2019Q3 | 102975 | 103234.7 |
| 2019Q4 | 101935.3 | 100427.2 |
| 2020Q1 | 100874.5 | 92199.3 |
| 2020Q2 | 88807.6 | 88531 |
| 2020Q3 | 96062.1 | 96718 |
| 2020Q4 | 100349 | 104748.9 |
| 2021Q1 | 103288.5 | 107561.1 |
| 2021Q2 | 102164.1 | 116502.4 |
| 2021Q3 | 102641.1 | 125572.2 |
| 2021Q4 | 106077.2 | 137513.2 |
| 2022Q1 | 107372.4 | 129375.3 |
| 2022Q2 | 107493.6 | 126470.7 |
| 2022Q3 | 106975.2 | 129414.9 |
| 2022Q4 | 108745.3 | 127473.4 |
| 2023Q1 | 109245 | 133330.8 |
| 2023Q2 | 110094.7 | 132933.6 |
| 2023Q3 | 113611.7 | 136797 |
| 2023Q4 | 113073.9 | 143607.7 |
| 2024Q1 | 109702 | 149364.1 |
| 2024Q2 | 113507.8 | 159157.7 |
| 2024Q3 | 114519 | 165648.8 |
| 2024Q4 | 115384.8 | 167425.7 |
| 2025Q1 | 112232.3 | 160578.5 |
| 2025Q2 | 114503.6 | 167444.8 |
| 2025Q3 | 117507.4 | 165667.7 |
| 2025Q4 | 117562.9 | 161645.4 |
| 2026Q1 | 119552.5 | 159265.5 |
Illinois is more of a factory state than the job count suggests
Raw payrolls make Texas look like the factory heavyweight, and it is: 979,700 manufacturing jobs against Illinois’s 571,000. Share of the local economy is a different ranking. Manufacturing was 6.8 percent of Texas nonfarm employment in July 2026 and 9.2 percent of Illinois’s. Illinois, with a much smaller overall job base (6.18 million nonfarm jobs versus 14.47 million in Texas), still leans harder on the shop floor. That is why a Chicago-area factory survey can rattle a state even when the national tape barely moves.
The practical reading for anyone who heard “Texas factories are back” on August 31 is narrower. Through July, Texas had more factory jobs than before the pandemic, a smaller slice of its own booming job market, a workweek that was not stretching, and an output boom concentrated in nondurables. Illinois had fewer factory jobs than in 2019, a slightly better year-over-year hire, and output that had barely beaten its old level. The Dallas Fed may yet be right about August. The Bureau of Labor Statistics had not been asked that question. When the next payroll print arrives, the test is simple: did Texas actually hire, or did the diffusion index just have a good month?
Sources and methods
This is retrospective enrichment using pinned catalogue snapshots, not an as-known-on-the-edition-date reconstruction. Research was compiled on 11 September 2026 for the 31 August 2026 State-News edition. Later releases and revisions may be present in these snapshots.
Manufacturing and total nonfarm wage-and-salary employment are Bureau of Labor Statistics State and Area Employment series, seasonally adjusted, monthly, in thousands of jobs. The SAE snapshot is dated 24 August 2026 (release identifier bls-sm-snapshot-2026-08-24); the latest month in the extracts is July 2026. National manufacturing employment is the CES manufacturing total (CES3000000001) from the 24 August 2026 CES snapshot, also through July 2026. Those payrolls therefore close before the Dallas Fed’s August 2026 survey.
Real manufacturing GDP is BEA quarterly state GDP in millions of chained 2017 dollars at a seasonally adjusted annual rate (table SQGDP9), snapshot associated with the 25 June 2026 regional quarterly release, through 2026Q1. Durable and nondurable manufacturing are shown separately; chained-dollar components are not additive. Chemical manufacturing is annual real GDP (SAGDP9) from the 9 April 2026 annual regional release; the last non-null year in the extract is 2024.
Average weekly hours for Texas manufacturing are not seasonally adjusted July readings for all employees. A matching Illinois monthly hours extract returned no observations and was not used. Null values were excluded and were not treated as zero. No duplicate period keys remained after that filter; status fields in these extracts were null. Index series use January 2019 = 100 for employment and 2019Q1 = 100 for real GDP. Twelve-month employment changes compare July 2026 with July 2025.
The Dallas Fed manufacturing index is a diffusion survey of executives, not a jobs count, and is cited from original reporting rather than from the statistical catalogue. This article does not estimate the causal effect of that survey, of tariffs, or of any single industry on payrolls. State presence in the geography dictionary is not, by itself, proof of coverage; each series was extracted with its returned series and geography identifiers.
Research completed 2026-09-11, for the August 31, 2026 news edition. This is retrospective analysis, not a reconstruction of information available that day.
- BLS State and Area Employment, manufacturing and total nonfarm payrolls: Source 1, Source 2
- BLS Current Employment Statistics, U.S. manufacturing employment: Source 1, Source 2
- BEA quarterly real GDP by state, manufacturing: Source 1, Source 2
- BEA annual real GDP by state, chemical manufacturing: Source 1, Source 2