Research
The cities say they are ready. Their building boom is not small.
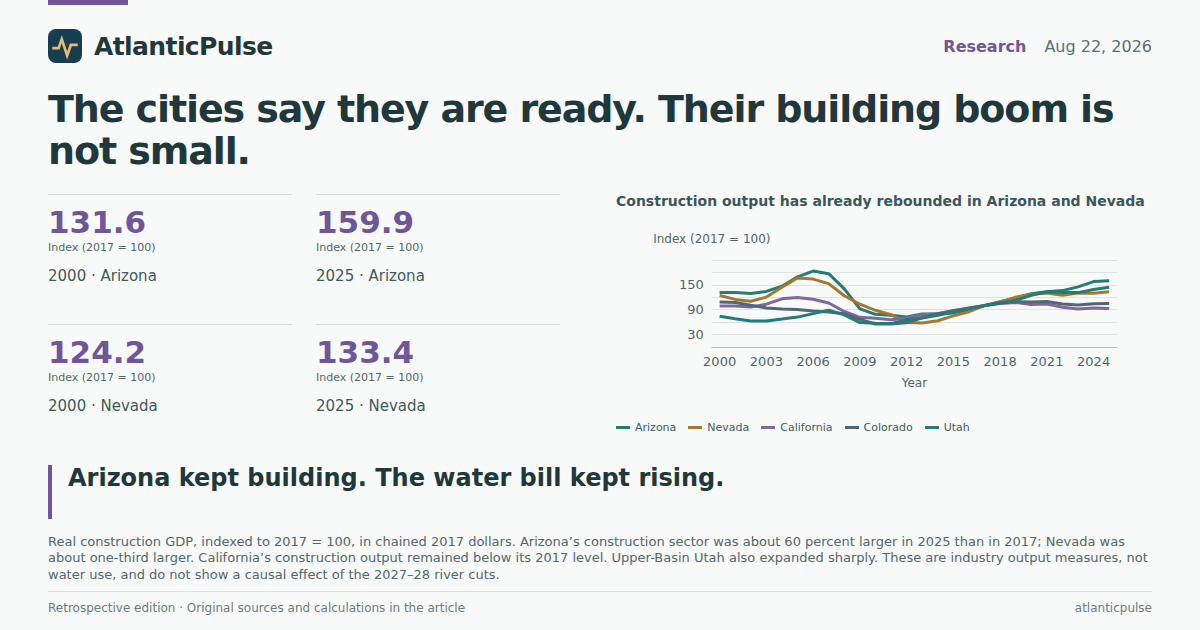
The cut is on paper. The cities are still pouring concrete.
Arizona water lawyer Cynthia Campbell told reporters that for the average customer, life will not change under the Interior Department’s two-year Colorado River plan. Cities have been planning for this shortage, she said. Rates might tick up. Conservation messages might get louder. In Las Vegas, a conservation advocate warned that further cuts could slow real-estate development. Those are claims about the urban economy, not the farms. A prior look at this basin asked how farm output compared with population. This one asks a different question: how large is the building-and-bills side of the same three states that must absorb the 1.25 million acre-feet of Lower Basin reductions?
The Bureau of Economic Analysis’s annual state accounts, in a snapshot that already includes calendar year 2025, show a construction sector that is not waiting politely on the river. Arizona’s real construction GDP, measured in chained 2017 dollars, was about 60 percent larger in 2025 than in 2017. Nevada’s was about one-third larger. California’s construction output was still a little below its 2017 level. Those are industry output figures, not gallons. They do not prove that river cuts will or will not shrink payrolls. They do show that the metro growth machine officials call “prepared” has been adding buildings through the same drought that just produced record-low Lakes Mead and Powell.
Construction output has already rebounded in Arizona and Nevada

View exact chart values
| year | AZ | CA | NV | CO | UT | WY | NM |
|---|---|---|---|---|---|---|---|
| 2000 | 131.6 | 98.9 | 124.2 | 108.4 | 74.3 | 109.9 | 122.2 |
| 2001 | 131.6 | 99.1 | 115 | 107.6 | 68 | 112.8 | 125.2 |
| 2002 | 129.2 | 96.3 | 110.4 | 101 | 62.5 | 112.3 | 117.1 |
| 2003 | 134.2 | 103.2 | 120.4 | 94.4 | 62.9 | 109.2 | 124.4 |
| 2004 | 146.7 | 116.4 | 144.4 | 91.8 | 67.3 | 101.8 | 133.1 |
| 2005 | 169.4 | 119.4 | 166.9 | 90.5 | 72.1 | 104.1 | 140.6 |
| 2006 | 183.2 | 115.5 | 164 | 86.8 | 80.6 | 115.6 | 143.8 |
| 2007 | 176.9 | 106.2 | 153 | 84.8 | 88.6 | 130.6 | 146.3 |
| 2008 | 140.4 | 85.8 | 123.6 | 80.4 | 77.4 | 143.9 | 142.7 |
| 2009 | 92.3 | 71.6 | 103.4 | 66.6 | 59 | 124.7 | 119.3 |
| 2010 | 78.9 | 69.5 | 88.6 | 55.5 | 57.1 | 124.2 | 106.4 |
| 2011 | 76.4 | 65.7 | 78.3 | 55.8 | 56.4 | 116.1 | 99.1 |
| 2012 | 72.6 | 70 | 59.2 | 58.4 | 65.6 | 127 | 94.7 |
| 2013 | 79.4 | 77.8 | 58.2 | 70.6 | 69.8 | 128.3 | 94.2 |
| 2014 | 79.4 | 80.2 | 63.5 | 80.3 | 76.8 | 133.7 | 93.2 |
| 2015 | 82.3 | 88 | 75.1 | 87 | 84.3 | 124.7 | 95.6 |
| 2016 | 89.7 | 94.3 | 85.2 | 93.6 | 92.6 | 110.9 | 95.5 |
| 2017 | 100 | 100 | 100 | 100 | 100 | 100 | 100 |
| 2018 | 109.7 | 104.8 | 108.4 | 106 | 106.2 | 102.2 | 103.6 |
| 2019 | 118.1 | 107.7 | 120.2 | 109.2 | 112.6 | 116.2 | 110.2 |
| 2020 | 128.6 | 102.5 | 127.3 | 108.7 | 124.7 | 109.1 | 108.5 |
| 2021 | 133.4 | 103.9 | 130.7 | 110 | 133.4 | 107.9 | 106.3 |
| 2022 | 136.1 | 95.8 | 125 | 104.1 | 131.3 | 97.7 | 99.4 |
| 2023 | 145.1 | 91.8 | 130 | 101.4 | 131.2 | 101.5 | 107.5 |
| 2024 | 157.9 | 94.3 | 129.5 | 104.2 | 138.7 | 109.8 | 112.3 |
| 2025 | 159.9 | 93.2 | 133.4 | 104.7 | 144 | 108.7 | 117.6 |
Nevada and Arizona lean on construction more than California does
Current-dollar shares make the same point without the index math. In 2025, construction accounted for 7.7 percent of Nevada’s GDP and 6.3 percent of Arizona’s, against 3.7 percent in California. Utah, which faces no mandatory cut in this two-year plan, sat even higher at 7.9 percent. Across the three Lower Basin states that must take the reductions, construction output summed to about $215 billion. The four Upper Basin states that face no mandatory cuts in this round summed to about $68 billion. California dominates the Lower Basin total because it is a $4.3 trillion economy; Nevada’s smaller pie is simply more construction-heavy.
That composition matters for the political fight Hobbs is still waging with the Upper Basin. The reporting from Phoenix stressed that junior Central Arizona Project rights would have eaten the whole federal reduction if California and Nevada had not shared it. Sharing does not change the fact that Arizona’s economy is now a construction-and-services machine with a farm fringe, not the reverse. Construction’s share is still a single-digit slice of GDP. It is also one of the slices most exposed if water uncertainty really does freeze subdivisions, as the Las Vegas warning implied. The data cannot settle that hypothetical. They can show the slice is not tiny in the two states taking the largest percentage cuts.
Construction is a larger slice of Nevada and Arizona than of California

View exact chart values
| state | basin | year | construction_billion | total_gdp_billion | share_pct |
|---|---|---|---|---|---|
| Utah | Upper | 2025 | 24.93 | 316 | 7.89 |
| Nevada | Lower | 2025 | 21.62 | 281.5 | 7.68 |
| Arizona | Lower | 2025 | 37.52 | 598.2 | 6.27 |
| Wyoming | Upper | 2025 | 3.18 | 52.6 | 6.05 |
| Colorado | Upper | 2025 | 33.08 | 584.3 | 5.66 |
| New Mexico | Upper | 2025 | 6.67 | 152.8 | 4.36 |
| California | Lower | 2025 | 156.1 | 4250.8 | 3.67 |
The payrolls tell a louder story than the GDP index
Jobs make the boom harder to miss. Seasonally adjusted construction payrolls in Arizona rose from 109,000 in July 2010 to 227,100 in July 2026, a gain of about 108 percent. Nevada went from 59,200 to 115,800, nearly doubling. California added too, from 557,100 to 887,400, then slipped after 2024. These are Bureau of Labor Statistics State and Area Employment figures, not a forecast of what 2027 deliveries will do to hiring. They are the people who show up if a developer actually cancels a project because the Hoover Dam “loses its shine,” in the phrase a Nevada conservation adviser used this week.
Put the jobs next to population and the picture gets less flattering for the homebuilders. From 2000 to 2025, Nevada’s population rose 63 percent while real construction output rose only 7 percent. Arizona’s population rose 48 percent while construction output rose 22 percent. People arrived faster than the construction sector, measured in real dollars, expanded. Utah is the Basin outlier: population up 58 percent, construction output up 94 percent. California’s population rose 16 percent while construction output fell 6 percent. That is not a housing-shortage model. It is a reminder that a fast-growing desert metro can add residents faster than it adds measured building output, which is exactly the tension buried in “the cities are prepared.”
Arizona construction jobs have more than doubled since 2010

View exact chart values
| year | AZ | CA | NV |
|---|---|---|---|
| 2010 | 109 | 557.1 | 59.2 |
| 2011 | 109.8 | 563.7 | 52.1 |
| 2012 | 114.8 | 591.2 | 51.8 |
| 2013 | 123.5 | 638.3 | 56.7 |
| 2014 | 122.4 | 671.4 | 63.8 |
| 2015 | 126.3 | 734.7 | 70.1 |
| 2016 | 135.2 | 779.1 | 75.9 |
| 2017 | 145.3 | 815.3 | 83.3 |
| 2018 | 157.8 | 861 | 89.3 |
| 2019 | 170.9 | 890.4 | 96.2 |
| 2020 | 171.4 | 842.2 | 93 |
| 2021 | 179.4 | 883.2 | 98.6 |
| 2022 | 197 | 915.9 | 107.3 |
| 2023 | 215.7 | 915 | 111.8 |
| 2024 | 225.8 | 917.1 | 110.2 |
| 2025 | 223.8 | 894.1 | 113.3 |
| 2026 | 227.1 | 887.4 | 115.8 |
People arrived faster than construction output in Arizona and Nevada

View exact chart values
| state | basin | pop_2000 | pop_latest | pop_year | pop_pct | real_con_2000_mil | real_con_latest_mil | rgdp_year | real_con_pct |
|---|---|---|---|---|---|---|---|---|---|
| Arizona | Lower | 5160586 | 7623818 | 2025 | 47.7 | 20424.2 | 24812.5 | 2025 | 21.5 |
| California | Lower | 33987977 | 39355309 | 2025 | 15.8 | 109440.5 | 103201.5 | 2025 | -5.7 |
| Nevada | Lower | 2018741 | 3282188 | 2025 | 62.6 | 13311.3 | 14296.9 | 2025 | 7.4 |
| Colorado | Upper | 4326921 | 6012561 | 2025 | 39 | 22660 | 21867.8 | 2025 | -3.5 |
| Utah | Upper | 2244502 | 3538904 | 2025 | 57.7 | 8508 | 16482.3 | 2025 | 93.7 |
| Wyoming | Upper | 494300 | 588753 | 2025 | 19.1 | 2128.2 | 2104.8 | 2025 | -1.1 |
| New Mexico | Upper | 1821204 | 2125498 | 2025 | 16.7 | 4581.9 | 4407.9 | 2025 | -3.8 |
The water bill has already doubled in Arizona
Campbell’s other prediction was about rates. Household spending on water supply and sanitation, from BEA consumption accounts divided by BEA population, is not a municipal tariff schedule. It is the closest official statewide dollar figure for what people already pay for pipes and treatment. In 2024, Californians spent about $508 per person on water and sanitation; Coloradans $460; Arizonans $450; Nevadans $389. Arizona’s figure was $223 per person in 2000. That is a doubling in nominal dollars over a quarter-century, before the 2027–28 cuts take effect. Nevada rose from $171 to $389. California rose from $197 to $508.
Housing and utilities as a bundle, which folds in rent, imputed owner-occupied rent, electricity and gas, is a much larger bill. In 2024 those categories ran $13,544 per person in Colorado, $12,842 in California, $11,657 in Arizona and $10,974 in Nevada. Water and sanitation are a sliver of that bundle. They are also the sliver most directly tied to the river story. If city managers keep taps running by raising rates and leaning on conservation, they will be adding to a bill that has already been climbing in the states taking the cuts. The accounts cannot say how much of Arizona’s extra $227 per person since 2000 is drought, growth, treatment costs or something else. They can say the “slight” increase officials preview is arriving on top of a long, already-visible rise.
Household water bills are already highest in California

View exact chart values
| state | basin | year | water_pce_million | population | per_capita_dollars |
|---|---|---|---|---|---|
| California | Lower | 2024 | 20011.7 | 39364774 | 508 |
| Colorado | Upper | 2024 | 2752 | 5988502 | 460 |
| Arizona | Lower | 2024 | 3400.6 | 7556424 | 450 |
| New Mexico | Upper | 2024 | 894.6 | 2126774 | 421 |
| Wyoming | Upper | 2024 | 228.8 | 586722 | 390 |
| Nevada | Lower | 2024 | 1265.9 | 3253543 | 389 |
| Utah | Upper | 2024 | 1296.7 | 3502983 | 370 |
What the numbers do not say
None of this estimates how many acre-feet cities versus farms will actually lose inside Arizona. BEA construction is buildings and engineering projects, not swimming pools. Water-and-sanitation spending includes sewers. 2025 state GDP in this extract comes from BEA’s annual file that already reaches that year; later revisions can move the decimals. July 2026 payrolls are the latest month in the BLS snapshot, not a full year. Upper versus Lower Basin is a legal grouping of states, not a hydrology model: New Mexico and Colorado also use Colorado River water, and California’s construction sector is mostly coastal.
The useful finding is narrower, and it is still worth having. The states assigned the first two years of cuts are not waiting in a holding pattern. Arizona and Nevada have been adding construction output and construction jobs through the drought. Household water bills, measured as consumption, have already risen sharply. If the cities really are “prepared,” they are prepared as fast-growing construction economies with rising utility bills, not as static desert towns that can absorb a 30 percent allocation cut without anyone noticing except the alfalfa.
Sources and methods
This is retrospective enrichment using pinned catalogue snapshots, not a reconstruction of what was knowable on the edition date of 22 August 2026. Research was compiled on 11 September 2026 from those snapshots.
BEA annual state GDP and population come from product bea_regional_state_annual, snapshot created 31 August 2026, source release bea-regional-state-annual-2026-04-09. Real construction GDP is SAGDP9, millions of chained 2017 dollars, not seasonally adjusted. Current-dollar GDP and construction GDP are SAGDP2. Population is SAINC1, number of persons. Observation window for real GDP and population is calendar 2000–2025; current-dollar shares use 2025, the latest year present for all seven Basin states. 2025 annual GDP in this file may be revised in later BEA vintages.
BEA personal consumption expenditures come from product bea_state_pce, snapshot created 31 August 2026, source release bea-sapce-2025-09-26. Water supply and sanitation is SAPCE3 in millions of current dollars. Per-capita housing and utilities is SAPCE2 in dollars. PCE observations run through calendar 2024. Per-capita water figures divide statewide water-and-sanitation PCE by SAINC1 population for the same year; they are not household survey averages or municipal tariffs and include sanitation.
Construction payrolls are BLS State and Area Employment, product bls_sae, snapshot created 24 August 2026, release bls-sm-snapshot-2026-08-24, seasonally adjusted all employees in thousands, statewide construction. July values for 2010–2026 are used for the jobs history. Nulls were skipped, not treated as zero. No status flags in these extracts required dropping observations.
Lower Basin here means Arizona, California and Nevada, the states assigned mandatory 2027–28 delivery reductions in the Interior plan described in the 22 August 2026 reporting. Upper Basin means Colorado, Utah, Wyoming and New Mexico. That legal grouping is not a claim about where every acre-foot is diverted. Construction GDP is not water use. Indexed real GDP uses 2017 = 100 because the chained-dollar series is expressed in 2017 dollars. Shares use current dollars so they are not mixed with chained-dollar ratios. No causal effect of river operations on construction or bills is inferred from these descriptive comparisons. Duplicate rows were not present in the yearly maps; the last observation for a calendar year was used when annual extracts contained one row per year.
Research completed 2026-09-11, for the August 22, 2026 news edition. This is retrospective analysis, not a reconstruction of information available that day.