Research
The cheaper-car promise, measured against a fuel bill that already matches it
A 1970s rule, rewritten on a $4 gallon weekend
On Saturday, President Donald Trump posted that he had approved new fuel-economy standards that would, in his telling, terminate an electric-vehicle mandate and deliver cheaper, safer cars. The Biden-era Corporate Average Fuel Economy path had aimed at 50.4 miles per gallon by 2031. The proposed rewrite drops that target to 34.5 mpg — below the average fuel economy of the existing U.S. fleet as of 2024. Transportation Secretary Sean Duffy has argued the old rules forced automakers into EVs. The government's own analysis of the proposal, reported the same day, warned that drivers could pay hundreds more for gasoline each year and that the country would be less able to weather oil-price shocks — which is, inconveniently, the problem CAFE was invented to address after the 1973 embargo.
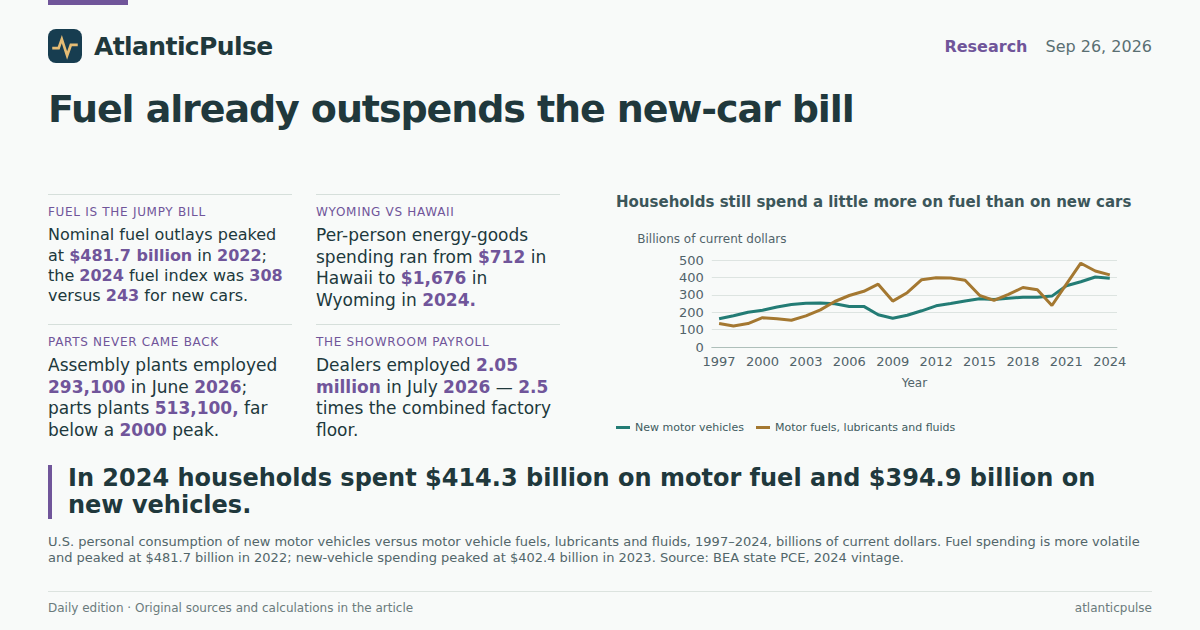
The White House is making a household-budget claim: lighter rules, cheaper cars. The counter-claim, in the same reporting, is a fatter fuel bill. Official consumption books cannot say whether this particular rewrite will do either. They can say which bill is already larger. Through 2024, the last full year of BEA state personal consumption expenditures, Americans spent $394.9 billion on new motor vehicles and $414.3 billion on motor vehicle fuels, lubricants and fluids. Fuel was 51 percent of that pair. Both items are small slices of a $19.9 trillion consumption total — 1.98 percent for new cars, 2.08 percent for fuel — but they are the two slices this rule is arguing over.
Households still spend a little more on fuel than on new cars

View exact chart values
| year | new_vehicles_bil | motor_fuels_bil | total_pce_bil | new_vehicles_share_pct | motor_fuels_share_pct | fuels_to_new_ratio | pc_gasoline_energy | pc_vehicles_parts |
|---|---|---|---|---|---|---|---|---|
| 1997 | 162.2 | 134.4 | 5536.8 | 2.93 | 2.43 | 0.829 | 542 | 1075 |
| 1998 | 179.4 | 120.8 | 5877.2 | 3.05 | 2.06 | 0.673 | 480 | 1161 |
| 1999 | 200.1 | 134.2 | 6283.8 | 3.18 | 2.14 | 0.671 | 525 | 1257 |
| 2000 | 210.7 | 168.6 | 6767.2 | 3.11 | 2.49 | 0.8 | 654 | 1287 |
| 2001 | 230 | 162.5 | 7073.8 | 3.25 | 2.3 | 0.706 | 625 | 1345 |
| 2002 | 243.6 | 153.6 | 7348.9 | 3.31 | 2.09 | 0.631 | 584 | 1395 |
| 2003 | 251.6 | 179 | 7740.7 | 3.25 | 2.31 | 0.711 | 677 | 1384 |
| 2004 | 252.4 | 213.4 | 8232 | 3.07 | 2.59 | 0.845 | 795 | 1398 |
| 2005 | 248.9 | 261.4 | 8769.1 | 2.84 | 2.98 | 1.05 | 960 | 1387 |
| 2006 | 233 | 295.9 | 9277.2 | 2.51 | 3.19 | 1.27 | 1071 | 1324 |
| 2007 | 233.2 | 319.9 | 9746.6 | 2.39 | 3.28 | 1.372 | 1147 | 1330 |
| 2008 | 185.2 | 361 | 10050.1 | 1.84 | 3.59 | 1.949 | 1286 | 1129 |
| 2009 | 165.6 | 263.8 | 9891.2 | 1.67 | 2.67 | 1.593 | 936 | 1039 |
| 2010 | 182.3 | 312.1 | 10260.3 | 1.78 | 3.04 | 1.712 | 1088 | 1113 |
| 2011 | 207.9 | 386.8 | 10698.9 | 1.94 | 3.62 | 1.861 | 1327 | 1171 |
| 2012 | 237 | 397.8 | 11047.4 | 2.14 | 3.6 | 1.679 | 1342 | 1262 |
| 2013 | 249.8 | 395.7 | 11388.2 | 2.19 | 3.47 | 1.584 | 1331 | 1333 |
| 2014 | 264.4 | 383.1 | 11874.5 | 2.23 | 3.23 | 1.449 | 1287 | 1415 |
| 2015 | 276.9 | 297.4 | 12297.4 | 2.25 | 2.42 | 1.074 | 991 | 1525 |
| 2016 | 273.8 | 268.6 | 12726.8 | 2.15 | 2.11 | 0.981 | 885 | 1556 |
| 2017 | 280.7 | 302.5 | 13290.6 | 2.11 | 2.28 | 1.078 | 992 | 1621 |
| 2018 | 286.4 | 341.7 | 13934.4 | 2.06 | 2.45 | 1.193 | 1116 | 1674 |
| 2019 | 285.7 | 328.7 | 14437.5 | 1.98 | 2.28 | 1.15 | 1067 | 1650 |
| 2020 | 292.8 | 238.4 | 14231.4 | 2.06 | 1.68 | 0.814 | 779 | 1649 |
| 2021 | 351.6 | 361.1 | 16119.7 | 2.18 | 2.24 | 1.027 | 1162 | 2099 |
| 2022 | 375.1 | 481.7 | 17690 | 2.12 | 2.72 | 1.284 | 1541 | 2175 |
| 2023 | 402.4 | 436.9 | 18833.1 | 2.14 | 2.32 | 1.086 | 1380 | 2228 |
| 2024 | 394.9 | 414.3 | 19896 | 1.98 | 2.08 | 1.049 | 1295 | 2155 |
The fuel bill used to be the smaller one
It was not always this way. In 1997, new vehicles ($162.2 billion) outspent motor fuels ($134.4 billion). The relationship flipped in the mid-2000s as oil prices rose, and it has flipped back and forth with every energy spike since. Fuel spending peaked at $481.7 billion in 2022; new-vehicle spending peaked a year later at $402.4 billion. Indexed to 1997, nominal fuel outlays stood at 308 in 2024 and new-vehicle outlays at 243. That is not a forecast of 2026 pump prices. It is the official record of how violently the fuel side of the ledger moves when oil does.
Per person, the same pattern shows up in a slightly broader BEA category — gasoline and other energy goods, which includes fuel oil as well as motor fuel. That bill was $542 per person in 1997 and $1,295 in 2024. Per-person spending on motor vehicles and parts, a category that folds in used cars and parts, rose from $1,075 to $2,155. None of those figures is inflation-adjusted. They still show that the fuel side of the garage is not a rounding error next to the car side, and that it is the more cyclical of the two.
A weaker CAFE standard is a bet that households will notice the sticker more than the pump. The 2024 books say those two bills are already close to a tie. They also say the pump is the one that jumped when oil did. Saturday's diesel record and $4.49 regular gasoline, reported separately, sit after this 2024 vintage; they are a reminder that 2026 is not a calm year to test the theory.
Fuel bills have grown faster than the new-car bill

View exact chart values
| year | new_vehicles_index | motor_fuels_index |
|---|---|---|
| 1997 | 100 | 100 |
| 1998 | 110.6 | 89.9 |
| 1999 | 123.3 | 99.8 |
| 2000 | 129.9 | 125.4 |
| 2001 | 141.8 | 120.9 |
| 2002 | 150.1 | 114.3 |
| 2003 | 155.1 | 133.1 |
| 2004 | 155.6 | 158.7 |
| 2005 | 153.4 | 194.5 |
| 2006 | 143.7 | 220.1 |
| 2007 | 143.7 | 238 |
| 2008 | 114.2 | 268.5 |
| 2009 | 102.1 | 196.2 |
| 2010 | 112.4 | 232.2 |
| 2011 | 128.1 | 287.7 |
| 2012 | 146.1 | 295.9 |
| 2013 | 154 | 294.3 |
| 2014 | 163 | 285 |
| 2015 | 170.7 | 221.2 |
| 2016 | 168.8 | 199.8 |
| 2017 | 173.1 | 225 |
| 2018 | 176.6 | 254.2 |
| 2019 | 176.2 | 244.5 |
| 2020 | 180.5 | 177.4 |
| 2021 | 216.7 | 268.6 |
| 2022 | 231.2 | 358.3 |
| 2023 | 248.1 | 325 |
| 2024 | 243.4 | 308.2 |
Wyoming already pays more than twice Hawaii
The national average conceals a long drive. In 2024, per-person spending on gasoline and other energy goods was $1,676 in Wyoming and $1,451 in Alabama, against $1,367 in Texas, $1,360 in Michigan, $1,217 in California, $816 in New York and $712 in Hawaii. The U.S. average was $1,295. These are selected states, not a complete ranking, and the category is broader than gasoline at the pump. Even so, the spread is the point: a rule that trades miles per gallon for a lower sticker does not land evenly on a commuter in Manhattan and a driver in Cheyenne.
Auto-producing states sit in the middle of that spread, not at the bottom. Michigan and Alabama, which still stamp out vehicles, already spend more per person on energy goods than California or New York. If the administration's theory is that Detroit needs relief more than drivers need efficiency, the household books in those factory states do not show a cheap-fuel cushion waiting to absorb a less efficient fleet.
Wyoming’s energy-goods bill is more than double Hawaii’s

View exact chart values
| state | pc_gasoline_energy |
|---|---|
| Hawaii | 712 |
| New York | 816 |
| North Dakota | 1000 |
| California | 1217 |
| Michigan | 1360 |
| Texas | 1367 |
| D.C. | 1408 |
| Alabama | 1451 |
| Wyoming | 1676 |
The factory jobs that actually exist
The other half of the Saturday pitch is industrial: automakers, Trump wrote, will build in America if the rules get out of the way. Payroll employment tells a more specific story than that sentence. Motor vehicle manufacturing — the assembly plants — employed 293,100 people in June 2026, seasonally adjusted, near a July 2024 peak of 303,400 and close to the annual averages of the late 1990s. The assembly line, in other words, is not a missing-worker mystery. It came back.
Motor vehicle parts manufacturing did not. Parts plants employed 513,100 in June 2026, against a June 2000 peak of 847,400. That is a hole of more than 330,000 jobs that never refilled, even as Americans spent nearly $400 billion a year on new cars. Annual averages show the same split: vehicle manufacturing around 290,000 in 2024–26, parts manufacturing stuck near 510,000–550,000 after a 2000 peak above 800,000. A CAFE rewrite that is sold as a factory-jobs policy is aimed at an assembly workforce that is already near a generation high, not at the parts plants that actually shrank.
And then there is the sales floor. Motor vehicle and parts dealers employed 2.05 million people in July 2026 — 2.5 times the combined factory payroll of 806,200. Dealerships, not stamping plants, are where most of the auto paycheck lives. If cheaper cars are supposed to be an employment story, the official books say the employment is already in the showroom.
The assembly line came back. The parts plants did not.

View exact chart values
| year | vehicle_mfg_thousands | parts_mfg_thousands | dealers_thousands | factory_total_thousands |
|---|---|---|---|---|
| 1990 | 274.9 | 653.1 | 1498.3 | 928 |
| 1991 | 258.5 | 639.1 | 1438.8 | 897.6 |
| 1992 | 260 | 661.6 | 1432.1 | 921.6 |
| 1993 | 263.8 | 678.1 | 1479.5 | 941.9 |
| 1994 | 281.6 | 735.8 | 1569.1 | 1017.4 |
| 1995 | 294.8 | 786.9 | 1631.7 | 1081.7 |
| 1996 | 285.3 | 799.9 | 1690 | 1085.2 |
| 1997 | 286.8 | 809 | 1727.7 | 1095.8 |
| 1998 | 283.6 | 818.2 | 1745.5 | 1101.8 |
| 1999 | 291.2 | 837 | 1801.9 | 1128.2 |
| 2000 | 291.4 | 839.4 | 1852.4 | 1130.8 |
| 2001 | 278.7 | 774.8 | 1859.7 | 1053.5 |
| 2002 | 265.4 | 733.7 | 1884 | 999.2 |
| 2003 | 264.6 | 707.9 | 1887.2 | 972.4 |
| 2004 | 255.9 | 692.1 | 1907 | 948 |
| 2005 | 247.6 | 678 | 1923.6 | 925.6 |
| 2006 | 236.5 | 654.6 | 1914.6 | 891.1 |
| 2007 | 220 | 607.8 | 1913.4 | 827.7 |
| 2008 | 191.6 | 543.6 | 1836.1 | 735.2 |
| 2009 | 146.5 | 413.6 | 1642.3 | 560.1 |
| 2010 | 152.7 | 418.9 | 1634.2 | 571.6 |
| 2011 | 157.8 | 445.6 | 1696.6 | 603.5 |
| 2012 | 167.5 | 482.9 | 1742.8 | 650.3 |
| 2013 | 181.5 | 508.8 | 1799.2 | 690.3 |
| 2014 | 193.9 | 537 | 1868.4 | 730.9 |
| 2015 | 200.8 | 564.8 | 1935.8 | 765.6 |
| 2016 | 211.9 | 581.1 | 1987 | 793 |
| 2017 | 219.1 | 589.4 | 2012.3 | 808.5 |
| 2018 | 233.7 | 599.8 | 2022.8 | 833.5 |
| 2019 | 237.1 | 594.1 | 2034.6 | 831.2 |
| 2020 | 206.2 | 530.3 | 1904.6 | 736.5 |
| 2021 | 253.6 | 541.7 | 1958.1 | 795.4 |
| 2022 | 281.5 | 551.9 | 2009.5 | 833.4 |
| 2023 | 293.5 | 563.8 | 2037 | 857.2 |
| 2024 | 297.8 | 550.9 | 2047.6 | 848.7 |
| 2025 | 285.8 | 524.8 | 2049.8 | 810.5 |
| 2026 | 291.3 | 513.6 | 2049.4 | 804.9 |
Dealerships employ 2.5 times as many people as the factories

View exact chart values
| job | thousands | period |
|---|---|---|
| Motor vehicle manufacturing | 293.1 | period:calendar:2026:06 |
| Motor vehicle parts manufacturing | 513.1 | period:calendar:2026:06 |
| Motor vehicle and parts dealers | 2050.1 | period:calendar:2026:07 |
Sources and methods
BEA state personal consumption expenditures are annual, current-dollar totals through calendar 2024 from the SAPCE 2025-09-26 release (normalized snapshot 2026-08-31). New motor vehicles and motor vehicle fuels, lubricants and fluids are type-of-product lines; they are compared with total PCE from the function table. Per-person 'gasoline and other energy goods' includes fuel oil and other fuels as well as motor fuel; it is not a pump-only gasoline series. Selected states are not a complete 50-state ranking. Figures are not inflation-adjusted and are not household averages.
BLS Current Employment Statistics are national, seasonally adjusted monthly payrolls. Motor vehicle manufacturing and parts manufacturing run through June 2026; motor vehicle and parts dealers through July 2026 (CES snapshot 2026-08-24). Annual averages for 2026 use January–June only. A January 1990 motor vehicle manufacturing print of 233,000 was excluded from the peak search as a possible series break; later 1990 months were retained. Employment counts are jobs, not unique people, and do not identify CAFE, EV, or gasoline-engine work.
Observation dates are not release dates. 2024 consumption does not incorporate 2026 pump prices. No causal effect of the proposed CAFE rewrite is inferred from these descriptive series. Provider/refresh lag is normal.
Research completed 2026-09-27, for the September 26, 2026 news edition. The available source data may cover earlier periods; see the observation periods and source vintages above.