Research
The Battleground Jobs Ledger: What Official Payrolls Say About the States Voting Hardest
Seven weeks out, two scoreboards
Election Day is about seven weeks away, and the state coverage in this edition reads like a road movie: James Talarico and Ken Paxton deadlocked in Texas (FOX8/The Hill), Kamala Harris flying into Michigan to stand next to Abdul El-Sayed at a maternal-health roundtable (The Hill), an AARP poll nudging Mary Peltola ahead of Dan Sullivan in Alaska (The Hill), Xavier Becerra's lead quietly stretching in California (ABC30), and Oregon's governor's race called a toss-up with 50 days to go. Campaigns sell narratives about the economy. Payrolls keep a more boring, more honest ledger.
So we pulled the ledger — BLS state payroll employment, seasonally adjusted, for the ten states this edition's own reporting is watching: Texas, Michigan, Alaska, California, Georgia, Iowa, Maine, North Carolina, Ohio and Oregon. July 2026 is the newest month in the dataset we work from (the snapshot was cut before August's state figures landed), and July's numbers are preliminary. With those caveats stamped on, the picture is sharper than any poll crosstab.
Six states are growing. Four are shrinking.
Over the year to July 2026, Texas leads the group with payrolls up 1.16%, about 165,600 jobs — no other featured state comes close in headcount. North Carolina follows at +1.02%, and Alaska (+0.71%), California (+0.63%), Ohio (+0.31%) and Michigan (+0.18%) add jobs at a jog. Then the ledger turns negative: Iowa (-0.11%), Maine (-0.14%), Georgia (-0.31%) and Oregon (-0.91%) employ fewer people than a year ago.
The Oregon number is the least surprising in the set. This edition's own reporting has Oregon's building trades in open crisis, with some union locals topping 20% unemployment and members commuting to Idaho and Nevada for work (Philomath News). The state payroll series says the same thing from the employer side: Oregon's total nonfarm count fell about 18,000 over the year and another 10,900 within 2026 itself. Georgia is the subtler wobble — a state that gained lavishly through 2023 and 2024 now leaking 15,700 jobs on an annual basis while both parties' Senate spenders keep it on the marquee.
Ten battlegrounds, one jobs ledger

View exact chart values
| state | name | emp_jul2026_k | emp_jul2025_k | emp_feb2020_k | yy_change_k | yy_pct | vs_feb2020_pct | ytd2026_change_k |
|---|---|---|---|---|---|---|---|---|
| TX | Texas | 14468 | 14302.4 | 12958.1 | 165.6 | 1.16 | 11.65 | 104.9 |
| NC | North Carolina | 5112 | 5060.4 | 4641.4 | 51.6 | 1.02 | 10.14 | 40 |
| AK | Alaska | 339.7 | 337.3 | 329.4 | 2.4 | 0.71 | 3.13 | 2.5 |
| CA | California | 18133 | 18020.3 | 17660.9 | 112.7 | 0.63 | 2.67 | -11.3 |
| OH | Ohio | 5690 | 5672.6 | 5608.5 | 17.4 | 0.31 | 1.45 | 16.1 |
| MI | Michigan | 4498.4 | 4490.2 | 4449.9 | 8.2 | 0.18 | 1.09 | 23.2 |
| IA | Iowa | 1583.1 | 1584.9 | 1588.3 | -1.8 | -0.11 | -0.33 | 2.3 |
| ME | Maine | 660.8 | 661.7 | 638.2 | -0.9 | -0.14 | 3.54 | 0.1 |
| GA | Georgia | 4977.5 | 4993.2 | 4675.2 | -15.7 | -0.31 | 6.47 | -3.9 |
| OR | Oregon | 1963.2 | 1981.2 | 1969.2 | -18 | -0.91 | -0.3 | -10.9 |
Two states never got all their jobs back
Index every state to February 2020 = 100 and the pandemic era compresses into one picture. Michigan took the deepest initial plunge of the group — payroll employment fell to roughly 76% of its pre-pandemic level in April 2020 — and its climb back has been the slowest of the ten: July 2026 employment sits just 1.09% above the February 2020 mark. Texas (+11.65%) and North Carolina (+10.14%) are in another galaxy; Georgia, despite its current wobble, remains 6.47% above.
And then there are two. Oregon (-0.30%) and Iowa (-0.33%) still have fewer payroll jobs than in the month before the pandemic — six years later. Iowa's case is striking because the state barely moved in either direction: a 2021-22 recovery that stalled around the pre-pandemic line, and a 2025 slide that has not fully reversed. Both states host marquee races this fall; both enter it with employment ledgers that never closed the 2020 account.
The long road back, state by state

View exact chart values
| period | TX | MI | AK | CA | GA | IA | ME | NC | OH | OR |
|---|---|---|---|---|---|---|---|---|---|---|
| 2019-01 | 97.86 | 99.73 | 99.61 | 98.07 | 98.46 | 100 | 99.31 | 98.52 | 99.59 | 98.74 |
| 2019-02 | 98.12 | 99.77 | 99.7 | 98.14 | 98.59 | 99.68 | 99.34 | 98.52 | 99.55 | 98.45 |
| 2019-03 | 98.21 | 99.91 | 99.91 | 98.27 | 98.68 | 99.67 | 99.42 | 98.74 | 99.64 | 98.62 |
| 2019-04 | 98.42 | 99.87 | 99.88 | 98.3 | 98.72 | 99.92 | 99.4 | 98.72 | 99.71 | 98.92 |
| 2019-05 | 98.66 | 99.88 | 100.18 | 98.44 | 98.89 | 99.96 | 99.78 | 98.85 | 99.75 | 99.03 |
| 2019-06 | 98.86 | 99.84 | 100.85 | 98.65 | 99.01 | 99.91 | 99.92 | 99.01 | 99.8 | 99.13 |
| 2019-07 | 99.04 | 99.79 | 100.55 | 98.7 | 99.11 | 99.99 | 99.39 | 99.02 | 99.83 | 99.33 |
| 2019-08 | 99.26 | 99.98 | 100.46 | 98.89 | 99.3 | 99.99 | 99.83 | 99.15 | 99.89 | 99.54 |
| 2019-09 | 99.38 | 99.98 | 100.82 | 98.96 | 99.45 | 99.96 | 100.03 | 99.41 | 99.84 | 99.61 |
| 2019-10 | 99.4 | 99.42 | 100.39 | 99.08 | 99.44 | 100.01 | 99.91 | 99.48 | 99.83 | 99.77 |
| 2019-11 | 99.67 | 100.01 | 100.12 | 99.43 | 99.57 | 99.96 | 99.86 | 99.61 | 99.98 | 99.92 |
| 2019-12 | 99.7 | 100.25 | 99.67 | 99.52 | 99.77 | 100.13 | 99.87 | 99.66 | 100.02 | 99.99 |
| 2020-01 | 99.87 | 99.99 | 99.76 | 99.87 | 100.03 | 100.05 | 100.09 | 99.97 | 100.06 | 100.02 |
| 2020-02 | 100 | 100 | 100 | 100 | 100 | 100 | 100 | 100 | 100 | 100 |
| 2020-03 | 99.59 | 99.29 | 99.42 | 99 | 99.52 | 99.54 | 99.4 | 99.52 | 99.1 | 99.23 |
| 2020-04 | 88.84 | 76.3 | 86.07 | 84.49 | 86.97 | 88.94 | 85.24 | 87.83 | 84.31 | 85.67 |
| 2020-05 | 90.71 | 79.2 | 86.16 | 85.55 | 89.77 | 89.73 | 87.45 | 89.48 | 87.44 | 86.67 |
| 2020-06 | 92.52 | 86.66 | 86.85 | 88.49 | 92.08 | 92.33 | 88.91 | 92.41 | 91.56 | 89.59 |
| 2020-07 | 92.54 | 89.33 | 86.76 | 88.72 | 92.67 | 93.63 | 90.14 | 93.41 | 92.5 | 91.1 |
| 2020-08 | 93.39 | 90.73 | 88.25 | 89.25 | 93.7 | 94.19 | 91.7 | 94.65 | 93.24 | 92.02 |
| 2020-09 | 93.96 | 91.74 | 89.95 | 90.11 | 94.15 | 94.89 | 94.3 | 95.53 | 94.08 | 92.54 |
| 2020-10 | 94.64 | 92.58 | 92.81 | 91.26 | 95.04 | 95.39 | 95.24 | 96.34 | 94.55 | 93.05 |
| 2020-11 | 95 | 92.49 | 93.72 | 91.65 | 95.5 | 95.27 | 95.77 | 96.75 | 94.71 | 93.36 |
| 2020-12 | 95.39 | 91.05 | 93.66 | 91.19 | 96.1 | 95.62 | 95.57 | 97.36 | 94.78 | 92.27 |
| 2021-01 | 95.72 | 91.79 | 93.44 | 90.63 | 96.28 | 96.05 | 95.99 | 97.39 | 95.1 | 92.27 |
| 2021-02 | 95.41 | 93.01 | 93.41 | 91.78 | 96.45 | 95.75 | 96.55 | 97.6 | 95.04 | 92.87 |
| 2021-03 | 96.39 | 93.48 | 93.81 | 92.54 | 96.84 | 96.22 | 97.07 | 98.14 | 95.36 | 94.09 |
| 2021-04 | 96.78 | 93.04 | 94.05 | 93.42 | 96.88 | 96.4 | 97.26 | 98.39 | 95.24 | 94.53 |
| 2021-05 | 97.22 | 93.26 | 92.87 | 94.05 | 97.39 | 96.42 | 97.24 | 98.81 | 95.4 | 94.59 |
| 2021-06 | 97.75 | 93.67 | 92.9 | 94.45 | 97.85 | 96.71 | 97.07 | 99.13 | 95.69 | 94.84 |
| 2021-07 | 98.65 | 94.64 | 93.78 | 95.57 | 98.98 | 97.36 | 97.77 | 99.99 | 96.44 | 96.34 |
| 2021-08 | 98.85 | 94.77 | 93.99 | 96.1 | 98.94 | 97.39 | 97.74 | 99.74 | 96.54 | 96.23 |
| 2021-09 | 99.3 | 95.02 | 94.51 | 96.07 | 99.07 | 97.23 | 97.71 | 99.78 | 96.18 | 96.2 |
| 2021-10 | 100.41 | 96.22 | 95.36 | 97.46 | 100.27 | 97.68 | 98.26 | 100.87 | 97.09 | 96.76 |
| 2021-11 | 100.82 | 96.6 | 96.14 | 97.83 | 100.59 | 97.56 | 98.51 | 101.16 | 97.4 | 97.15 |
| 2021-12 | 101.38 | 96.78 | 96.24 | 98.22 | 100.85 | 98 | 98.46 | 101.65 | 97.55 | 97.32 |
| 2022-01 | 101.37 | 96.79 | 96.05 | 98.26 | 101.01 | 97.97 | 98.59 | 101.35 | 97.68 | 97.43 |
| 2022-02 | 102.11 | 97.27 | 96.24 | 99.05 | 101.65 | 98.62 | 99.15 | 102.27 | 97.98 | 97.97 |
| 2022-03 | 102.4 | 97.66 | 96.51 | 99.42 | 101.82 | 98.61 | 99.59 | 102.7 | 98.17 | 98.27 |
| 2022-04 | 103.1 | 98.12 | 96.63 | 99.75 | 102.44 | 98.67 | 100.03 | 103 | 98.59 | 98.49 |
| 2022-05 | 103.39 | 97.97 | 96.66 | 99.89 | 102.58 | 98.68 | 99.84 | 103.26 | 98.56 | 98.44 |
| 2022-06 | 103.61 | 98 | 96.36 | 100.16 | 102.74 | 99.01 | 99.48 | 103.62 | 98.52 | 98.42 |
| 2022-07 | 104.54 | 98.58 | 97.12 | 100.44 | 103.45 | 99.1 | 100.38 | 104.3 | 98.93 | 99.67 |
| 2022-08 | 104.91 | 98.62 | 96.99 | 100.65 | 103.44 | 99.16 | 100.3 | 104.49 | 98.98 | 99.75 |
| 2022-09 | 105.3 | 98.67 | 96.84 | 100.74 | 103.76 | 99.48 | 100.49 | 104.73 | 99.04 | 99.73 |
| 2022-10 | 105.51 | 98.77 | 97.02 | 100.67 | 103.95 | 99.54 | 100.33 | 104.73 | 99.15 | 99.54 |
| 2022-11 | 105.72 | 99.02 | 97.81 | 100.76 | 104.11 | 99.65 | 100.75 | 104.9 | 99.2 | 99.55 |
| 2022-12 | 105.89 | 99.1 | 97.75 | 100.81 | 104.22 | 99.62 | 100.75 | 105.1 | 99.23 | 99.76 |
| 2023-01 | 106.46 | 99.56 | 98.39 | 100.54 | 104.6 | 99.76 | 101.49 | 105.66 | 99.72 | 100.63 |
| 2023-02 | 106.63 | 99.62 | 98.6 | 100.69 | 104.7 | 99.94 | 101.43 | 105.82 | 99.83 | 100.65 |
| 2023-03 | 106.9 | 99.76 | 98.72 | 100.64 | 104.8 | 99.9 | 101.44 | 105.98 | 99.9 | 100.71 |
| 2023-04 | 106.95 | 100.06 | 99 | 100.58 | 104.64 | 100.2 | 101.41 | 105.9 | 99.88 | 100.7 |
| 2023-05 | 107.16 | 100.41 | 98.63 | 100.9 | 104.68 | 100.09 | 101.79 | 106.12 | 99.99 | 100.85 |
| 2023-06 | 107.63 | 100.54 | 99.91 | 101.06 | 105.06 | 100.38 | 102.32 | 106.77 | 100.4 | 101.18 |
| 2023-07 | 107.43 | 100.71 | 99.73 | 100.81 | 104.96 | 100.33 | 102.54 | 106.51 | 100.33 | 100.83 |
| 2023-08 | 107.67 | 100.51 | 99.91 | 100.99 | 105.17 | 100.45 | 102.35 | 106.74 | 100.38 | 100.9 |
| 2023-09 | 107.94 | 100.74 | 100.49 | 101.24 | 105.47 | 100.54 | 102.3 | 106.97 | 100.5 | 101.17 |
| 2023-10 | 107.97 | 100.12 | 99.97 | 101.04 | 105.39 | 100.71 | 102.29 | 107.16 | 100.29 | 100.88 |
| 2023-11 | 108.06 | 100.31 | 100.18 | 101.12 | 105.6 | 100.64 | 102.38 | 107.25 | 100.32 | 101.01 |
| 2023-12 | 108.23 | 100.66 | 100.27 | 101.41 | 105.74 | 100.79 | 102.51 | 107.67 | 100.45 | 101.01 |
| 2024-01 | 108.43 | 100.55 | 100.21 | 102.07 | 105.7 | 100.07 | 102.9 | 107.56 | 100.6 | 100.43 |
| 2024-02 | 108.58 | 100.71 | 100.67 | 101.67 | 105.76 | 100.95 | 102.9 | 107.73 | 100.66 | 100.84 |
| 2024-03 | 108.73 | 100.91 | 101.18 | 101.74 | 106.18 | 101.01 | 103.01 | 107.94 | 100.84 | 100.99 |
| 2024-04 | 108.8 | 100.81 | 101.24 | 101.56 | 106.2 | 100.96 | 102.88 | 108.08 | 100.72 | 101.15 |
| 2024-05 | 109.02 | 100.96 | 101.49 | 101.54 | 106.44 | 101 | 103.35 | 108.28 | 100.85 | 101.12 |
| 2024-06 | 109.22 | 100.92 | 101.31 | 101.52 | 106.47 | 100.76 | 103.84 | 108.32 | 101 | 101.24 |
| 2024-07 | 108.92 | 100.67 | 101.67 | 101.63 | 106.32 | 100.64 | 103.59 | 108.12 | 100.86 | 101.13 |
| 2024-08 | 109.47 | 101.07 | 101.58 | 101.72 | 106.36 | 100.77 | 103.78 | 108.27 | 100.85 | 101.18 |
| 2024-09 | 109.62 | 101.08 | 102.22 | 101.86 | 106.4 | 100.5 | 103.74 | 108.5 | 101.03 | 101.46 |
| 2024-10 | 109.74 | 100.71 | 101.94 | 102.22 | 106.41 | 100.44 | 103.71 | 108.07 | 100.98 | 101.39 |
| 2024-11 | 109.9 | 100.82 | 102.06 | 102.2 | 106.58 | 100.44 | 103.68 | 108.3 | 101.06 | 101.2 |
| 2024-12 | 110.04 | 100.8 | 102.22 | 101.95 | 106.67 | 100.4 | 103.68 | 108.34 | 101.08 | 101.33 |
| 2025-01 | 110.1 | 100.62 | 102.58 | 102.06 | 106.41 | 100.72 | 103.81 | 108.4 | 100.86 | 101.21 |
| 2025-02 | 110.21 | 100.75 | 102.55 | 101.94 | 106.58 | 100.46 | 103.45 | 108.44 | 100.98 | 100.88 |
| 2025-03 | 110.25 | 100.78 | 102.58 | 101.97 | 106.53 | 100.52 | 103.57 | 108.46 | 100.98 | 100.77 |
| 2025-04 | 110.45 | 100.83 | 102.7 | 102.25 | 106.8 | 100.45 | 103.49 | 108.81 | 101.11 | 100.9 |
| 2025-05 | 110.52 | 101.02 | 102.79 | 102.28 | 106.81 | 100.49 | 103.87 | 108.96 | 101.16 | 100.86 |
| 2025-06 | 110.29 | 100.87 | 102.46 | 102.13 | 106.58 | 100.33 | 103.59 | 108.86 | 101.01 | 100.75 |
| 2025-07 | 110.37 | 100.91 | 102.4 | 102.04 | 106.8 | 99.79 | 103.68 | 109.03 | 101.14 | 100.61 |
| 2025-08 | 110.43 | 100.86 | 102.43 | 102.14 | 106.8 | 99.8 | 103.54 | 109.08 | 101.25 | 100.59 |
| 2025-09 | 110.41 | 100.8 | 102.16 | 102.05 | 106.59 | 99.69 | 103.59 | 109.04 | 101.09 | 100.3 |
| 2025-10 | 110.33 | 100.66 | 102.31 | 102.06 | 106.33 | 99.43 | 102.95 | 108.96 | 100.91 | 100.06 |
| 2025-11 | 110.41 | 100.63 | 102.19 | 102.25 | 106.4 | 99.58 | 103.38 | 109.11 | 100.92 | 100.16 |
| 2025-12 | 110.66 | 100.65 | 102.28 | 102.27 | 106.59 | 99.35 | 103.27 | 109.2 | 100.98 | 100.17 |
| 2026-01 | 110.84 | 100.57 | 102.37 | 102.74 | 106.55 | 99.53 | 103.53 | 109.28 | 101.17 | 100.25 |
| 2026-02 | 110.79 | 100.46 | 102.34 | 102.63 | 106.48 | 99.24 | 103.6 | 109.21 | 101.08 | 99.9 |
| 2026-03 | 111.08 | 100.58 | 102.22 | 102.84 | 106.71 | 99.28 | 103.54 | 109.45 | 101.26 | 99.68 |
| 2026-04 | 111.14 | 100.78 | 102.49 | 102.84 | 106.85 | 99.55 | 103.67 | 109.91 | 101.41 | 99.71 |
| 2026-05 | 111.33 | 100.82 | 103.07 | 102.75 | 106.93 | 99.7 | 103.51 | 110.2 | 101.31 | 99.84 |
| 2026-06 | 111.64 | 100.92 | 103.28 | 102.79 | 106.66 | 99.87 | 103.48 | 110.15 | 101.36 | 99.9 |
| 2026-07 | 111.65 | 101.09 | 103.13 | 102.67 | 106.47 | 99.67 | 103.54 | 110.14 | 101.45 | 99.7 |
The California surprise: level up, momentum down
Ask which state is performing worst and the annual numbers indict Oregon. Ask which is losing momentum and the 2026-only numbers point somewhere else entirely. California added roughly 112,700 payroll jobs over the year to July — fourth-best in the group — but lost about 11,300 between January and July of this year. No other featured state pairs a positive annual gain with a shrinking current-year ledger by that margin.
The timing is awkward for the biggest governor's race on the map, where Xavier Becerra's lead over Steve Hilton keeps widening in the polls and cost-of-living complaints are the opposition's core pitch (ABC30, LA Times). Payrolls are not the price of gas or rent, and a five-month dip is not a trend line; but for a campaign being fought on economic competence, the newest official numbers run the wrong way. Michigan shows the opposite pattern — barely above pre-pandemic on level, yet +23,200 jobs within 2026, the third-fastest in-year gain of the group.
This year's momentum, not last year's

View exact chart values
| name | state | ytd2026_change_k | yy_pct |
|---|---|---|---|
| Texas | TX | 104.9 | 1.16 |
| North Carolina | NC | 40 | 1.02 |
| Michigan | MI | 23.2 | 0.18 |
| Ohio | OH | 16.1 | 0.31 |
| Alaska | AK | 2.5 | 0.71 |
| Iowa | IA | 2.3 | -0.11 |
| Maine | ME | 0.1 | -0.14 |
| Georgia | GA | -3.9 | -0.31 |
| Oregon | OR | -10.9 | -0.91 |
| California | CA | -11.3 | 0.63 |
Growing now versus recovered
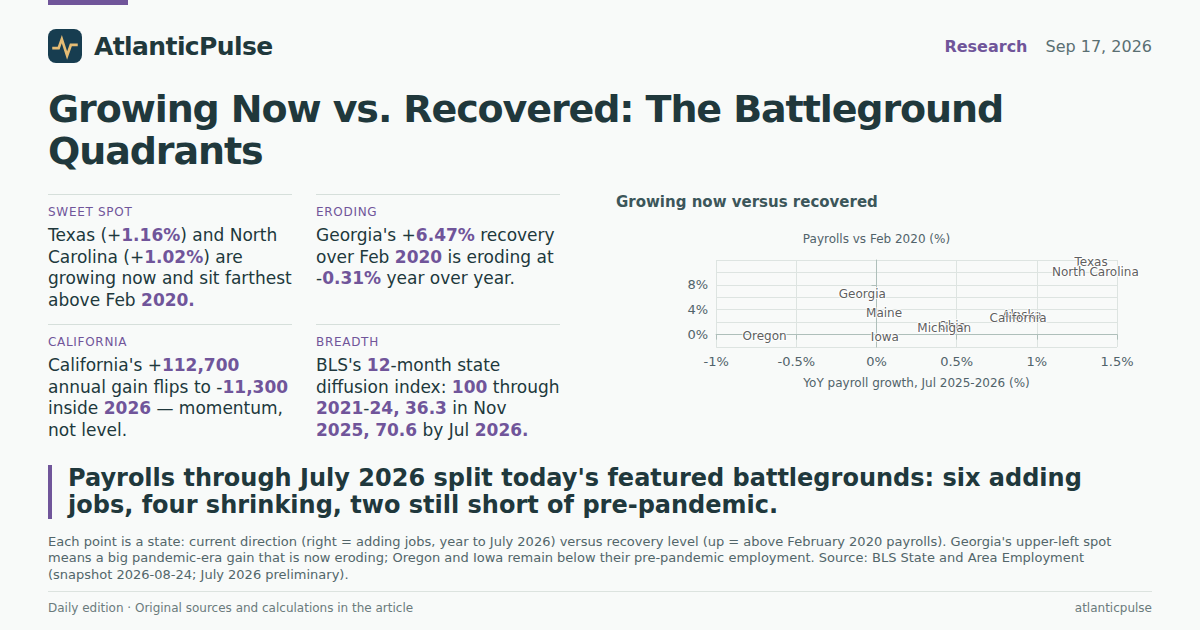
Put the two questions on one chart — horizontal axis: year-over-year growth; vertical axis: payroll level versus February 2020 — and each battleground lands in a quadrant that tells its campaign story. Texas and North Carolina occupy the sweet spot, growing now and far above their old peaks. Georgia floats upper-left: a rich recovery that is currently eroding. Maine sits oddly — above pre-pandemic on level, slightly negative on the year, essentially flat.
The lower-left quadrant is the lonely one. Iowa and Oregon are the only two states that are both shrinking year-over-year and still below their February 2020 employment. If incumbents in those states want to run on the recovery, the payroll ledger gives them a one-word rebuttal: which recovery?.
Growing now versus recovered

View exact chart values
| name | yy_pct | vs_feb2020_pct | yy_change_k |
|---|---|---|---|
| Texas | 1.16 | 11.65 | 165.6 |
| North Carolina | 1.02 | 10.14 | 51.6 |
| Alaska | 0.71 | 3.13 | 2.4 |
| California | 0.63 | 2.67 | 112.7 |
| Ohio | 0.31 | 1.45 | 17.4 |
| Michigan | 0.18 | 1.09 | 8.2 |
| Iowa | -0.11 | -0.33 | -1.8 |
| Maine | -0.14 | 3.54 | -0.9 |
| Georgia | -0.31 | 6.47 | -15.7 |
| Oregon | -0.91 | -0.3 | -18 |
And the map itself has narrowed
One more series ties the ten together: BLS's 12-month state diffusion index, which measures the share of states with more payroll jobs than twelve months earlier. From spring 2021 through most of 2024 it sat pinned at 100 — every state adding jobs, an economy wide as a barn door. It slid through late 2024, then collapsed to 36.3 in November 2025 — the deepest reading of this cycle — before clawing back to 70.6 by July 2026, where it stood when the data window closed.
That is the macro backdrop every battleground inherits: even after the 2026 rebound, roughly three states in ten are still shedding jobs on an annual basis. A scoreboard that universal in 2022 could hide a lot of local weakness. This one cannot.
Job growth is no longer everywhere

View exact chart values
| period | value |
|---|---|
| 2019-01 | 100 |
| 2019-02 | 98 |
| 2019-03 | 95.1 |
| 2019-04 | 100 |
| 2019-05 | 96.1 |
| 2019-06 | 91.2 |
| 2019-07 | 92.2 |
| 2019-08 | 90.2 |
| 2019-09 | 90.2 |
| 2019-10 | 90.2 |
| 2019-11 | 90.2 |
| 2019-12 | 90.2 |
| 2020-01 | 94.1 |
| 2020-02 | 89.2 |
| 2020-03 | 54.9 |
| 2020-04 | 0 |
| 2020-05 | 0 |
| 2020-06 | 0 |
| 2020-07 | 0 |
| 2020-08 | 0 |
| 2020-09 | 0 |
| 2020-10 | 0 |
| 2020-11 | 2 |
| 2020-12 | 3.9 |
| 2021-01 | 3.9 |
| 2021-02 | 3.9 |
| 2021-03 | 5.9 |
| 2021-04 | 100 |
| 2021-05 | 100 |
| 2021-06 | 100 |
| 2021-07 | 100 |
| 2021-08 | 100 |
| 2021-09 | 100 |
| 2021-10 | 100 |
| 2021-11 | 100 |
| 2021-12 | 100 |
| 2022-01 | 100 |
| 2022-02 | 100 |
| 2022-03 | 100 |
| 2022-04 | 100 |
| 2022-05 | 100 |
| 2022-06 | 100 |
| 2022-07 | 100 |
| 2022-08 | 100 |
| 2022-09 | 100 |
| 2022-10 | 100 |
| 2022-11 | 100 |
| 2022-12 | 100 |
| 2023-01 | 100 |
| 2023-02 | 100 |
| 2023-03 | 100 |
| 2023-04 | 100 |
| 2023-05 | 100 |
| 2023-06 | 100 |
| 2023-07 | 100 |
| 2023-08 | 100 |
| 2023-09 | 100 |
| 2023-10 | 100 |
| 2023-11 | 100 |
| 2023-12 | 100 |
| 2024-01 | 98 |
| 2024-02 | 100 |
| 2024-03 | 100 |
| 2024-04 | 100 |
| 2024-05 | 100 |
| 2024-06 | 98 |
| 2024-07 | 98 |
| 2024-08 | 100 |
| 2024-09 | 98 |
| 2024-10 | 96.1 |
| 2024-11 | 96.1 |
| 2024-12 | 95.1 |
| 2025-01 | 88.2 |
| 2025-02 | 88.2 |
| 2025-03 | 82.4 |
| 2025-04 | 86.3 |
| 2025-05 | 80.4 |
| 2025-06 | 66.7 |
| 2025-07 | 75.5 |
| 2025-08 | 65.7 |
| 2025-09 | 47.1 |
| 2025-10 | 39.2 |
| 2025-11 | 36.3 |
| 2025-12 | 43.1 |
| 2026-01 | 51 |
| 2026-02 | 43.1 |
| 2026-03 | 42.2 |
| 2026-04 | 58.8 |
| 2026-05 | 59.8 |
| 2026-06 | 72.5 |
| 2026-07 | 70.6 |
What the ledger cannot tell you
Plain limits, stated plainly. Payrolls count jobs on employer payrolls — not unemployment, not wages, not rents or diesel prices, and not how any voter feels about any of it. July's state figures are preliminary and will be revised; August's estimates were published after this dataset's snapshot was cut, so the newest month analyzed here is July. The ten-state set is an editorial selection from this edition's coverage, not a statistical definition of 'battleground.'
What the ledger can tell you is where the economic ground actually sits under the campaign rhetoric. Six of the ten featured states enter the final stretch adding jobs; four are shedding them; two never recovered their pre-pandemic payrolls at all; and the biggest state on the map is watching its in-year gains evaporate. None of that determines an election. All of it will be quoted in one.
Sources and methods
Data: U.S. Bureau of Labor Statistics, State and Area Employment (state Current Employment Statistics), series 'Total Nonfarm / All Employees, In Thousands, Seasonally Adjusted', monthly, January 2019 through July 2026, plus the 12-month state employment diffusion index. Retrieved from the pinned read-only snapshot bls-sm-snapshot-2026-08-24 (product bls_sae); observations were read through extract_evidence and all arithmetic was run reproducibly in calculate.
Vintage and revisions: July 2026 is the newest month in the pinned snapshot. BLS published preliminary August state estimates after this snapshot was cut (for example, New Jersey's August report), so those figures are not included here; July 2026 observations carry preliminary status flags and are subject to benchmark and annual revision (series benchmark year 2025).
Measures: year-over-year change compares July 2025 with July 2026; the recovery comparison uses February 2020 as the pre-pandemic reference; within-year momentum compares January 2026 with July 2026. All values are seasonally adjusted establishment payrolls in thousands of jobs; they are not household income, unemployment rates or prices.
Battleground selection: the ten states (Alaska, California, Georgia, Iowa, Maine, Michigan, North Carolina, Ohio, Oregon, Texas) are the ones featured in this edition's campaign reporting. That is an editorial choice, not a statistical screen, and findings do not generalize to all competitive states.
Interpretation limits: payroll levels and growth describe employer payrolls only, say nothing directly about unemployment, wages or prices, and imply no causal effect on polling or election outcomes. The diffusion index measures the share of states with non-negative 12-month payroll change as published by BLS.
Research completed 2026-09-18, for the September 17, 2026 news edition. The available source data may cover earlier periods; see the observation periods and source vintages above.
- U.S. Bureau of Labor Statistics — State and Area Employment (state CES payroll series and 12-month state diffusion index), pinned snapshot 2026-08-24: Source 1