Research
The AI boom is showing up in output, not in headcount
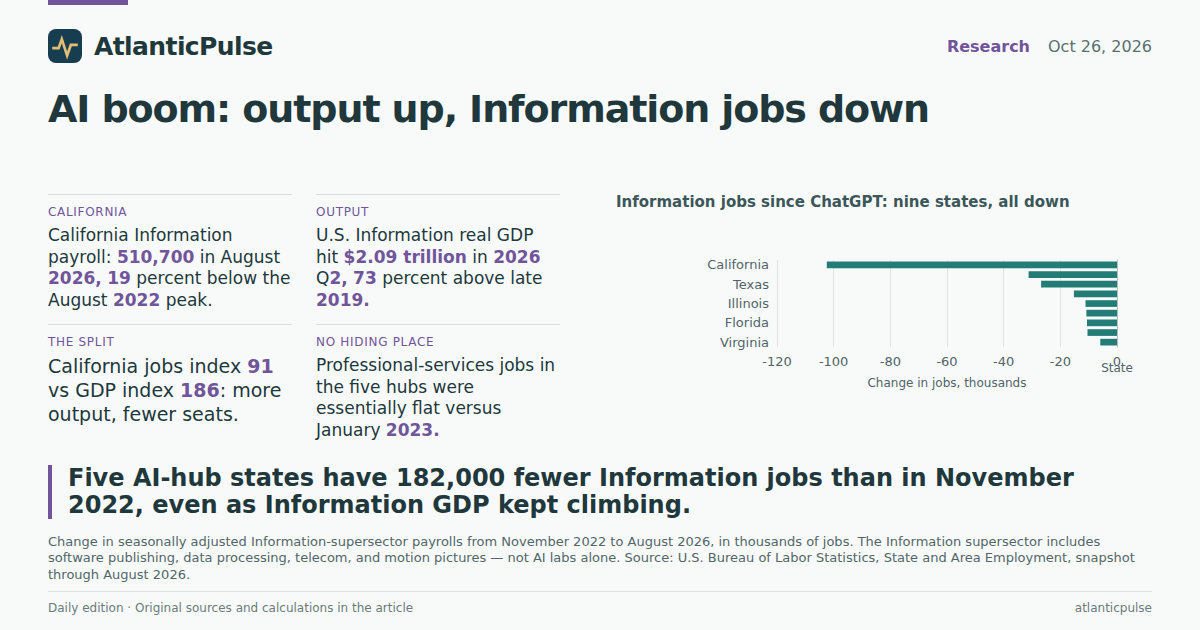
A record IPO, and a payroll that already turned
Anthropic walked into the SEC on Monday with a prospectus that could become the largest IPO on record, even as it reported an $80.7 billion first-half net loss and warned that its own models might pose “catastrophic or existential risks to humanity.” The same day, Microsoft offered voluntary buyouts to 60,000 employees — about 27 percent of a global workforce of roughly 223,000 — in the United States, India, the United Kingdom and Canada. SpaceX, for its part, locked in $40 billion of debt to buy AI chips. The industry is simultaneously warning that AI might end us, borrowing like there is no tomorrow, and asking a quarter of the staff if they would like to leave.
Those headlines are about companies. The official books are about industries. The question for readers walking into the midterms is simpler than a valuation: if this is the great American AI build-out, is it still adding the software-and-media jobs that used to travel with a tech boom? The short answer, in the Bureau of Labor Statistics’ Information supersector, is no.
That supersector is broader than Claude and Copilot. It includes software publishing, data processing, telecommunications, broadcasting and motion pictures. It is still the closest official payroll home for Microsoft-style software firms, and it is the industry California, Washington, New York, Texas and Massachusetts actually report each month. Professional, scientific and technical services — lawyers, accountants, consultants and computer-systems design shops — is the other place the AI labor story might hide. The two series tell different stories.
The AI hubs did not keep adding Information payrolls

View exact chart values
| period | california | california_thousands | washington | washington_thousands | texas | new_york | massachusetts |
|---|---|---|---|---|---|---|---|
| 2015-01 | 84.7 | 475.5 | 79.4 | 111.2 | 96.7 | 95 | 96.6 |
| 2016-01 | 92.5 | 519.4 | 84.4 | 118.2 | 97.7 | 95.8 | 98.2 |
| 2017-01 | 93.4 | 524.7 | 88.9 | 124.5 | 98.5 | 97.1 | 99.3 |
| 2018-01 | 97 | 544.4 | 92.1 | 129 | 99 | 97.9 | 100.9 |
| 2019-01 | 100 | 561.5 | 100 | 140 | 100 | 100 | 100 |
| 2020-01 | 103.8 | 582.9 | 106.4 | 149 | 102.7 | 102.8 | 103.5 |
| 2021-01 | 94.6 | 531.1 | 108.5 | 151.9 | 97 | 94 | 98.9 |
| 2022-01 | 107.5 | 603.7 | 117.9 | 165 | 106.4 | 101.5 | 103.5 |
| 2023-01 | 107 | 600.6 | 124.7 | 174.6 | 114.8 | 104.1 | 106.9 |
| 2024-01 | 96.5 | 542 | 116.9 | 163.6 | 110.1 | 98.6 | 102.1 |
| 2025-01 | 93.1 | 523 | 117 | 163.8 | 108.5 | 95.3 | 98.6 |
| 2026-01 | 92.6 | 519.9 | 117.7 | 164.8 | 105 | 95.9 | 96.9 |
| 2026-08 | 91 | 510.7 | 117.2 | 164.1 | 102.2 | 94.5 | 95.3 |
Every large hub has fewer Information jobs than in late 2022
By August 2026, California’s seasonally adjusted Information payroll was 510,700 jobs. That is 119,100 below the August 2022 peak of 629,800, an 18.9 percent drop, and 102,400 below November 2022, the month ChatGPT went public. New York was down 31,200 jobs from that November, Texas down 26,800, Massachusetts down 10,800, Washington down 10,400. Add those five together and the AI-hub Information payroll has shed 181,600 jobs, or 12.7 percent, since November 2022.
The pattern is not a California-only hangover from Hollywood strikes and streaming write-downs, though those sit inside the same supersector. Colorado’s Information payroll is down 19.1 percent from November 2022. Illinois is down 11.3 percent. Florida, often sold as the destination for remote tech workers, is down 6.7 percent. Virginia, home of the Loudoun County data-center corridor, is down 8.3 percent. In all nine states checked, August 2026 was below November 2022.
Washington is the mild outlier on levels, not on direction. Microsoft’s home state is still 17 percent above January 2019. California is 9 percent below that pre-pandemic January. Texas, which actually added Information jobs into late 2022, has given most of that back and sits only 2 percent above January 2019. The boom that was supposed to keep adding software seats after generative AI arrived has, on these books, been a bust for headcount.
Information jobs since ChatGPT: nine states, all down

View exact chart values
| state | jobs_change_thousands | pct_change | aug2026_thousands | nov2022_thousands |
|---|---|---|---|---|
| California | -102.4 | -16.7 | 510.7 | 613.1 |
| New York | -31.2 | -10.4 | 269.4 | 300.6 |
| Texas | -26.8 | -11.2 | 211.5 | 238.3 |
| Colorado | -15.2 | -19.1 | 64.4 | 79.6 |
| Illinois | -11.1 | -11.3 | 87.1 | 98.2 |
| Massachusetts | -10.8 | -10.9 | 87.9 | 98.7 |
| Florida | -10.6 | -6.7 | 148.3 | 158.9 |
| Washington | -10.4 | -6 | 164.1 | 174.5 |
| Virginia | -5.9 | -8.3 | 64.9 | 70.8 |
Output went the other way
The GDP side of the same industry does not look like a bust. U.S. Information real GDP, measured in chained 2017 dollars at a seasonally adjusted annual rate, was $2.09 trillion in the second quarter of 2026. That is 72.6 percent above 2019 Q4 and 35.3 percent above 2022 Q4. California’s Information output was $614 billion, up 86.1 percent from 2019 Q4. Washington nearly doubled, up 94.3 percent. New York was up 61.1 percent; Texas, 76.5 percent.
Put California’s two series on the same chart and the split is almost comic. Index Information jobs to January 2019 and they finish 2026 Q2 at 91.5. Index Information real GDP to 2019 Q4 and it finishes at 186. The state that hosts Anthropic, plus a large share of OpenAI, Google and Meta, is producing far more Information output with a smaller Information payroll than it had before the pandemic, let alone at the 2022 peak.
That is not proof that AI models are doing the work of 100,000 missing Californians. Information GDP includes advertising-funded platforms, streaming libraries, telecom traffic and software licenses. Real output can rise because of prices, product mix, overseas contractors, or a handful of very expensive GPU clusters. It is proof that the official industry can expand in dollars while shrinking in seats — which is the opposite of the 2010s software boom, when the payroll and the output climbed together.
California's Information output kept climbing. The payroll did not.

View exact chart values
| period | jobs_index_jan2019 | gdp_index_2019q4 | jobs_thousands | gdp_mil_ch2017 |
|---|---|---|---|---|
| 2015-01 | 84.7 | 61.8 | 475.5 | 203864.8 |
| 2015-04 | 86.4 | 64.8 | 485.3 | 213663.2 |
| 2015-07 | 88.1 | 66.9 | 494.9 | 220659.1 |
| 2015-10 | 90 | 71 | 505.3 | 234364 |
| 2016-01 | 92.5 | 72.2 | 519.4 | 238295.2 |
| 2016-04 | 95.1 | 71.3 | 534.1 | 235282.6 |
| 2016-07 | 95.3 | 75.3 | 534.9 | 248536.6 |
| 2016-10 | 94.2 | 75.2 | 529.2 | 247987 |
| 2017-01 | 93.4 | 78.9 | 524.7 | 260411.8 |
| 2017-04 | 94 | 81.2 | 527.7 | 267843.5 |
| 2017-07 | 95.5 | 83.5 | 536 | 275421.8 |
| 2017-10 | 96.5 | 85.5 | 542.1 | 282068 |
| 2018-01 | 97 | 84.3 | 544.4 | 278168.9 |
| 2018-04 | 96.1 | 87.4 | 539.8 | 288432 |
| 2018-07 | 97.7 | 87 | 548.7 | 287060.8 |
| 2018-10 | 98.6 | 86.7 | 553.5 | 285973.3 |
| 2019-01 | 100 | 90.2 | 561.5 | 297594.4 |
| 2019-04 | 98.9 | 95.5 | 555.5 | 314995.4 |
| 2019-07 | 100.7 | 97.2 | 565.6 | 320714.7 |
| 2019-10 | 101.4 | 100 | 569.6 | 329864.7 |
| 2020-01 | 103.8 | 99.1 | 582.9 | 326876.1 |
| 2020-04 | 91.4 | 98.4 | 513.4 | 324643.8 |
| 2020-07 | 92.1 | 104.3 | 517 | 343925.2 |
| 2020-10 | 94.6 | 105.8 | 531.3 | 349043.4 |
| 2021-01 | 94.6 | 110.2 | 531.1 | 363469.6 |
| 2021-04 | 99.3 | 114.9 | 557.5 | 378915.8 |
| 2021-07 | 101.3 | 120.9 | 568.6 | 398815.5 |
| 2021-10 | 105.3 | 126.5 | 591.4 | 417352.4 |
| 2022-01 | 107.5 | 120.2 | 603.7 | 396531.9 |
| 2022-04 | 109.7 | 122.7 | 616.1 | 404905.6 |
| 2022-07 | 111.8 | 120.6 | 627.7 | 397864.2 |
| 2022-10 | 110.2 | 118.6 | 618.5 | 391350.4 |
| 2023-01 | 107 | 125.4 | 600.6 | 413623.6 |
| 2023-04 | 102 | 129.3 | 572.8 | 426634.7 |
| 2023-07 | 97.9 | 137.7 | 549.5 | 454077.3 |
| 2023-10 | 95.2 | 139.6 | 534.3 | 460504 |
| 2024-01 | 96.5 | 145.7 | 542 | 480613.6 |
| 2024-04 | 96.8 | 146.7 | 543.4 | 483849.2 |
| 2024-07 | 96.3 | 150.2 | 540.5 | 495330.2 |
| 2024-10 | 95.5 | 155.9 | 536.2 | 514270.3 |
| 2025-01 | 93.1 | 158.2 | 523 | 521807.9 |
| 2025-04 | 94.3 | 162.3 | 529.7 | 535369.3 |
| 2025-07 | 94.8 | 177.1 | 532.4 | 584156.8 |
| 2025-10 | 93.3 | 177 | 524.1 | 583762.9 |
| 2026-01 | 92.6 | 181.9 | 519.9 | 600188.6 |
| 2026-04 | 91.5 | 186.1 | 513.7 | 613779.2 |
Information output: Washington nearly doubled, the U.S. rose 73 percent

View exact chart values
| period | united_states | california | washington | us_mil_ch2017 | ca_mil_ch2017 | wa_mil_ch2017 |
|---|---|---|---|---|---|---|
| 2015-01 | 69 | 61.8 | 48.1 | 834786 | 203864.8 | 43865.8 |
| 2015-04 | 70.8 | 64.8 | 50.2 | 856469 | 213663.2 | 45767.2 |
| 2015-07 | 72.8 | 66.9 | 51.2 | 881602 | 220659.1 | 46698.8 |
| 2015-10 | 75.2 | 71 | 53.7 | 909746 | 234364 | 48972 |
| 2016-01 | 77.1 | 72.2 | 57.5 | 932804 | 238295.2 | 52435.3 |
| 2016-04 | 77.6 | 71.3 | 56.7 | 938745 | 235282.6 | 51755.7 |
| 2016-07 | 79 | 75.3 | 57.9 | 955713 | 248536.6 | 52846.5 |
| 2016-10 | 79.7 | 75.2 | 60.9 | 964537 | 247987 | 55583.7 |
| 2017-01 | 81.4 | 78.9 | 65.1 | 985484 | 260411.8 | 59399.7 |
| 2017-04 | 82.5 | 81.2 | 65.5 | 998470 | 267843.5 | 59725.5 |
| 2017-07 | 84.2 | 83.5 | 68 | 1019582 | 275421.8 | 62042.9 |
| 2017-10 | 85.6 | 85.5 | 69.8 | 1036543 | 282068 | 63649.3 |
| 2018-01 | 85.6 | 84.3 | 72.4 | 1036677 | 278168.9 | 66074.1 |
| 2018-04 | 87.6 | 87.4 | 73.5 | 1060334 | 288432 | 66997.4 |
| 2018-07 | 88.9 | 87 | 79.2 | 1076562 | 287060.8 | 72251.4 |
| 2018-10 | 90.1 | 86.7 | 81.6 | 1090618 | 285973.3 | 74460.4 |
| 2019-01 | 93.2 | 90.2 | 86.1 | 1127800 | 297594.4 | 78526.4 |
| 2019-04 | 96.8 | 95.5 | 90.4 | 1172303 | 314995.4 | 82416.2 |
| 2019-07 | 99.2 | 97.2 | 93.8 | 1200345 | 320714.7 | 85571.3 |
| 2019-10 | 100 | 100 | 100 | 1210446 | 329864.7 | 91211 |
| 2020-01 | 98.7 | 99.1 | 103.7 | 1194339 | 326876.1 | 94556.4 |
| 2020-04 | 97.9 | 98.4 | 108.8 | 1184678 | 324643.8 | 99261.3 |
| 2020-07 | 103.7 | 104.3 | 122.8 | 1255224 | 343925.2 | 112029.1 |
| 2020-10 | 105.1 | 105.8 | 117.7 | 1272112 | 349043.4 | 107327.7 |
| 2021-01 | 109.1 | 110.2 | 122.8 | 1320890 | 363469.6 | 112014.3 |
| 2021-04 | 113.9 | 114.9 | 127.6 | 1378431 | 378915.8 | 116382.4 |
| 2021-07 | 116.7 | 120.9 | 127.1 | 1413006 | 398815.5 | 115934.5 |
| 2021-10 | 121.8 | 126.5 | 135.6 | 1473853 | 417352.4 | 123640.1 |
| 2022-01 | 120.2 | 120.2 | 129.1 | 1454982 | 396531.9 | 117787.7 |
| 2022-04 | 122.4 | 122.7 | 132.4 | 1481520 | 404905.6 | 120746.8 |
| 2022-07 | 125.1 | 120.6 | 137.8 | 1514122 | 397864.2 | 125683.5 |
| 2022-10 | 127.6 | 118.6 | 144.8 | 1544174 | 391350.4 | 132083.1 |
| 2023-01 | 130.1 | 125.4 | 151.4 | 1574479 | 413623.6 | 138074.2 |
| 2023-04 | 133.3 | 129.3 | 153.9 | 1613968 | 426634.7 | 140357.1 |
| 2023-07 | 139 | 137.7 | 161.5 | 1682273 | 454077.3 | 147283.3 |
| 2023-10 | 141.8 | 139.6 | 168.4 | 1716125 | 460504 | 153618.2 |
| 2024-01 | 142.9 | 145.7 | 170 | 1729802 | 480613.6 | 155044 |
| 2024-04 | 144.8 | 146.7 | 169.5 | 1752236 | 483849.2 | 154613.4 |
| 2024-07 | 147.3 | 150.2 | 171.4 | 1782912 | 495330.2 | 156315.8 |
| 2024-10 | 149.2 | 155.9 | 179.9 | 1806106 | 514270.3 | 164051.1 |
| 2025-01 | 152.1 | 158.2 | 185.4 | 1841304 | 521807.9 | 169083.4 |
| 2025-04 | 156.6 | 162.3 | 188.8 | 1895249 | 535369.3 | 172162.8 |
| 2025-07 | 160.6 | 177.1 | 194.6 | 1943519 | 584156.8 | 177454.6 |
| 2025-10 | 162.8 | 177 | 193.5 | 1970867 | 583762.9 | 176504.8 |
| 2026-01 | 168.9 | 181.9 | 194.3 | 2044445 | 600188.6 | 177233.5 |
| 2026-04 | 172.6 | 186.1 | 194.3 | 2089763 | 613779.2 | 177178.1 |
The other tech payroll did not collapse
If the missing jobs had simply hopped next door into professional, scientific and technical services, the PST series would show it. In the same five hub states, that payroll was 3.82 million in August 2026, 0.2 percent above January 2023. Texas is the genuine expander: 1.09 million PST jobs, a record, up 60,100 since January 2023. California is 35,800 below January 2023. Massachusetts is 18,300 below. Washington and New York are roughly flat.
Computer systems design, a slice of PST that covers custom software, systems integration and on-site IT, kept growing on the annual GDP books through 2025. U.S. real output in that industry was $744 billion last year, 82.7 percent above 2019. California’s was $161 billion, 87 percent above 2019, and about 22 percent of the national total. That is the consulting-and-integration cousin of the Information supersector, not a substitute for Microsoft’s software-publishing line. It is also annual data that ends in 2025, so it cannot yet answer what 2026 buyouts will do.
Pay, at least in California Information, has not followed the headcount down. Average weekly earnings of all Information employees in August 2026 were $2,437, not seasonally adjusted, 29.9 percent above August 2019. That comparison uses the same calendar month to avoid mixing bonuses and hours across the year. A thinner, better-paid payroll is consistent with a boom that is capital-heavy and headcount-light. It is also consistent with the remaining workers capturing more of a very expensive industry.
Computer-systems design kept expanding on the GDP books

View exact chart values
| year | california_mil_ch2017 | us_mil_ch2017 | ca_share_pct |
|---|---|---|---|
| 2015 | 52330.9 | 271794 | 19.3 |
| 2016 | 58044.3 | 298041 | 19.5 |
| 2017 | 65932.1 | 326373 | 20.2 |
| 2018 | 77193.8 | 374072 | 20.6 |
| 2019 | 86074.9 | 406982 | 21.1 |
| 2020 | 97646 | 437921 | 22.3 |
| 2021 | 117154.8 | 514752 | 22.8 |
| 2022 | 111922.1 | 567759 | 19.7 |
| 2023 | 118396.5 | 613906 | 19.3 |
| 2024 | 134691.4 | 660708 | 20.4 |
| 2025 | 160933.3 | 743524 | 21.6 |
What the buyouts can and cannot tell you
None of this says Microsoft’s 60,000 offers will show up one-for-one in next month’s California or Washington print. Voluntary exits are not layoffs, many of the jobs sit outside the Information supersector, and a large share of Microsoft’s headcount is abroad. Anthropic’s filing is about a company that was still private for most of the payroll collapse already in the books. The official series also cannot separate an AI researcher from a cable installer or a studio grip.
What the books can say is narrower, and more useful. The Information payroll in the states that actually host the AI labs peaked in 2022, before most of the GPU debt and the IPO prospectus, and has not recovered. Information real GDP in those same states did not peak. Professional services, the other place a software worker might land, has not absorbed a 182,000-job Information decline in the five hubs. If the public markets are about to be asked to value Anthropic like a country, they are valuing an industry that has already learned to grow without hiring.
Sources and methods
Edition date is 2026-10-26. Employment figures are from the BLS State and Area Employment snapshot dated 2026-08-24, with observations through August 2026, not same-day prints. GDP figures are from BEA regional releases dated 2026-09-30; quarterly Information GDP runs through 2026 Q2 and annual computer-systems-design GDP through 2025.
Information is NAICS supersector 50 (software publishing, data processing, telecom, broadcasting, motion pictures). It is not a census of AI labs. Professional, scientific and technical services is a different supersector; computer systems design (NAICS 5415) is a component of that supersector on the GDP books, not of Information.
Employment is seasonally adjusted all employees, in thousands. GDP is real, millions of chained 2017 dollars; quarterly figures are seasonally adjusted annual rates, not quarterly totals. Chain-weighted industry GDP is not additive across industries. Weekly earnings are not seasonally adjusted; August-to-August comparisons avoid mixing months.
Null observations were dropped, never treated as zero. No duplicate periods appeared in the extracted seasonally adjusted series. Peak dates are the maximum value from January 2019 through August 2026. The five-hub total is the sum of California, Washington, Texas, New York and Massachusetts; it is not a national Information total. National SAE Information employment is not in this extract.
Microsoft headcount and Anthropic financials come from today’s reporting, not from BLS or BEA. This article does not attribute the payroll decline to those two firms, to AI adoption, or to any causal effect of buyouts.
Research completed 2026-10-27, for the October 26, 2026 news edition. The available source data may cover earlier periods; see the observation periods and source vintages above.