Research
The $75 COLA, next to a $1.6 trillion check
A raise measured against the books
The Social Security Administration's Wednesday announcement was built for a midterm mailbox: a 3.6 percent cost-of-living adjustment beginning in 2027, about $75 extra a month for 73 million people who receive monthly benefits, plus nearly 7.5 million on Supplemental Security Income. Retirees quoted in the same reporting called it a pittance next to drug prices and property taxes. The official economic accounts cannot tell you what Lorrie Ufkin will pay for a prescription outside Rochester. They can tell you how large the check already is, and how much of Americans' income it has become.
Those accounts are the Bureau of Economic Analysis state personal-income tables, not the SSA press release. In calendar year 2025, the latest full year on the books, Social Security benefits paid to U.S. residents totaled $1.57 trillion. That is old-age, survivors and disability insurance — the monthly checks and lump-sum survivor payments — not SSI and not Medicare. Personal income that year was $26.33 trillion, so Social Security was 6.0 percent of the nation's income. Divide the same $1.57 trillion by 342 million residents and you get $4,593 a year, or about $383 a month. That per-resident figure is not a typical beneficiary's check. It is the program spread across children, workers and retirees alike.
Social Security benefits paid, United States

View exact chart values
| year | ss_billions | pi_billions | ss_share_pct | index_ss | index_pi | index_wages | index_medicare | ss_per_capita |
|---|---|---|---|---|---|---|---|---|
| 1990 | 244.1 | 4897.3 | 4.99 | 100 | 100 | 100 | 100 | 978 |
| 1991 | 264.2 | 5072.3 | 5.21 | 108.2 | 103.6 | 102.6 | 109.2 | 1044 |
| 1992 | 281.8 | 5406.5 | 5.21 | 115.4 | 110.4 | 108.3 | 123.2 | 1098 |
| 1993 | 297.9 | 5643.6 | 5.28 | 122 | 115.2 | 112.6 | 136.4 | 1146 |
| 1994 | 312.2 | 5933.9 | 5.26 | 127.9 | 121.2 | 118.4 | 152.8 | 1186 |
| 1995 | 327.7 | 6278.1 | 5.22 | 134.2 | 128.2 | 125.1 | 168.4 | 1231 |
| 1996 | 342 | 6660.9 | 5.13 | 140.1 | 136 | 132.3 | 181 | 1270 |
| 1997 | 356.6 | 7068.4 | 5.04 | 146.1 | 144.3 | 141.9 | 192.2 | 1308 |
| 1998 | 369.2 | 7584 | 4.87 | 151.2 | 154.9 | 153 | 191 | 1338 |
| 1999 | 379.9 | 7978.4 | 4.76 | 155.6 | 162.9 | 163.3 | 193.9 | 1361 |
| 2000 | 401.4 | 8620.2 | 4.66 | 164.4 | 176 | 176.7 | 203.6 | 1423 |
| 2001 | 425.1 | 8990.1 | 4.73 | 174.1 | 183.6 | 181.3 | 225.4 | 1492 |
| 2002 | 446.9 | 9146.7 | 4.89 | 183.1 | 186.8 | 182.9 | 241.3 | 1554 |
| 2003 | 463.5 | 9474.7 | 4.89 | 189.9 | 193.5 | 188.1 | 257.1 | 1598 |
| 2004 | 485.5 | 10008.9 | 4.85 | 198.9 | 204.4 | 198.4 | 282.8 | 1658 |
| 2005 | 512.7 | 10540.8 | 4.86 | 210 | 215.2 | 208.4 | 308.6 | 1735 |
| 2006 | 544.1 | 11291.4 | 4.82 | 222.9 | 230.6 | 221.7 | 370.8 | 1824 |
| 2007 | 575.7 | 11925 | 4.83 | 235.8 | 243.5 | 234.2 | 397.8 | 1911 |
| 2008 | 605.5 | 12423.4 | 4.87 | 248 | 253.7 | 239.2 | 428.9 | 1991 |
| 2009 | 664.5 | 12058.3 | 5.51 | 272.2 | 246.2 | 228.6 | 458 | 2166 |
| 2010 | 690.2 | 12547.5 | 5.5 | 282.7 | 256.2 | 233.1 | 477 | 2231 |
| 2011 | 713.3 | 13299.8 | 5.36 | 292.2 | 271.6 | 242.3 | 497.6 | 2287 |
| 2012 | 762.1 | 13905.7 | 5.48 | 312.2 | 283.9 | 253.4 | 515.4 | 2425 |
| 2013 | 799 | 14063.3 | 5.68 | 327.3 | 287.2 | 260.3 | 532.2 | 2523 |
| 2014 | 834.6 | 14778.2 | 5.65 | 341.9 | 301.8 | 273.6 | 557.4 | 2614 |
| 2015 | 871.8 | 15467.1 | 5.64 | 357.1 | 315.8 | 287.6 | 589.9 | 2709 |
| 2016 | 896.5 | 15884.7 | 5.64 | 367.2 | 324.4 | 296.2 | 615.1 | 2764 |
| 2017 | 926.1 | 16659 | 5.56 | 379.3 | 340.2 | 310.3 | 642.7 | 2835 |
| 2018 | 972.4 | 17514.4 | 5.55 | 398.3 | 357.6 | 325.6 | 681.5 | 2960 |
| 2019 | 1030.7 | 18349.6 | 5.62 | 422.2 | 374.7 | 341.2 | 734.4 | 3121 |
| 2020 | 1077.9 | 19613.1 | 5.5 | 441.5 | 400.5 | 346.1 | 768.7 | 3251 |
| 2021 | 1114.6 | 21492.8 | 5.19 | 456.6 | 438.9 | 377.4 | 824.4 | 3356 |
| 2022 | 1211.5 | 22149.3 | 5.47 | 496.2 | 452.3 | 407.2 | 876.8 | 3627 |
| 2023 | 1357 | 23637.1 | 5.74 | 555.8 | 482.7 | 429.7 | 953.1 | 4030 |
| 2024 | 1448 | 25035.8 | 5.78 | 593.1 | 511.2 | 454.4 | 1031.4 | 4259 |
| 2025 | 1570 | 26327 | 5.96 | 643.1 | 537.6 | 475.1 | 1114.5 | 4593 |
Faster than paychecks. Slower than Medicare.
From 1990 to 2025, Social Security benefits rose more than sixfold in current dollars, to an index of 643 if 1990 equals 100. Personal income rose to 538. Wages and salaries, the paycheck line in the same accounts, rose only to 475. Medicare benefits, recorded as federal payments through intermediaries for care, rose to 1,114 — almost twice Social Security's climb. The 2009 recession is visible as a jump in Social Security's share of income, to 5.5 percent, when paychecks shrank and benefits did not. The 2021 bounce in personal income, stuffed with pandemic transfers, briefly pulled the Social Security share down to 5.2 percent. By 2025 it was back to 6.0 percent, the highest in this 35-year window.
The quarterly series, published at a seasonally adjusted annual rate, is already a step ahead of that annual total. In the second quarter of 2026 it stood at $1.64 trillion. That is not a realized half-year payout, and it is not the 2027 COLA. It is the run-rate on the books a few months before SSA said the raise would be 3.6 percent. Apply 3.6 percent to the 2025 annual stock and you get about $57 billion. Multiply the announced $75 a month by 73 million people for twelve months and you get about $66 billion. The two numbers are not supposed to match: one is a percentage of last year's BEA total, the other is a round monthly amount times SSA's beneficiary count, which also covers SSI. Both are large next to a $1.2 billion bank fine and small next to $26 trillion of personal income.
Workers and employers still put more into government social insurance than Social Security pays out. Contributions for government social insurance — a broader bucket that includes Medicare and unemployment as well as Social Security payroll taxes — were $1.98 trillion in 2025. Social Security benefits were 79 percent of that contribution total. SSI, the needs-tested companion program that also gets a COLA, was $67 billion, a rounding error beside the $1.57 trillion insurance check and the $1.20 trillion Medicare line.
Social Security grew faster than wages, slower than Medicare

View exact chart values
| year | ss_billions | pi_billions | ss_share_pct | index_ss | index_pi | index_wages | index_medicare | ss_per_capita |
|---|---|---|---|---|---|---|---|---|
| 1990 | 244.1 | 4897.3 | 4.99 | 100 | 100 | 100 | 100 | 978 |
| 1991 | 264.2 | 5072.3 | 5.21 | 108.2 | 103.6 | 102.6 | 109.2 | 1044 |
| 1992 | 281.8 | 5406.5 | 5.21 | 115.4 | 110.4 | 108.3 | 123.2 | 1098 |
| 1993 | 297.9 | 5643.6 | 5.28 | 122 | 115.2 | 112.6 | 136.4 | 1146 |
| 1994 | 312.2 | 5933.9 | 5.26 | 127.9 | 121.2 | 118.4 | 152.8 | 1186 |
| 1995 | 327.7 | 6278.1 | 5.22 | 134.2 | 128.2 | 125.1 | 168.4 | 1231 |
| 1996 | 342 | 6660.9 | 5.13 | 140.1 | 136 | 132.3 | 181 | 1270 |
| 1997 | 356.6 | 7068.4 | 5.04 | 146.1 | 144.3 | 141.9 | 192.2 | 1308 |
| 1998 | 369.2 | 7584 | 4.87 | 151.2 | 154.9 | 153 | 191 | 1338 |
| 1999 | 379.9 | 7978.4 | 4.76 | 155.6 | 162.9 | 163.3 | 193.9 | 1361 |
| 2000 | 401.4 | 8620.2 | 4.66 | 164.4 | 176 | 176.7 | 203.6 | 1423 |
| 2001 | 425.1 | 8990.1 | 4.73 | 174.1 | 183.6 | 181.3 | 225.4 | 1492 |
| 2002 | 446.9 | 9146.7 | 4.89 | 183.1 | 186.8 | 182.9 | 241.3 | 1554 |
| 2003 | 463.5 | 9474.7 | 4.89 | 189.9 | 193.5 | 188.1 | 257.1 | 1598 |
| 2004 | 485.5 | 10008.9 | 4.85 | 198.9 | 204.4 | 198.4 | 282.8 | 1658 |
| 2005 | 512.7 | 10540.8 | 4.86 | 210 | 215.2 | 208.4 | 308.6 | 1735 |
| 2006 | 544.1 | 11291.4 | 4.82 | 222.9 | 230.6 | 221.7 | 370.8 | 1824 |
| 2007 | 575.7 | 11925 | 4.83 | 235.8 | 243.5 | 234.2 | 397.8 | 1911 |
| 2008 | 605.5 | 12423.4 | 4.87 | 248 | 253.7 | 239.2 | 428.9 | 1991 |
| 2009 | 664.5 | 12058.3 | 5.51 | 272.2 | 246.2 | 228.6 | 458 | 2166 |
| 2010 | 690.2 | 12547.5 | 5.5 | 282.7 | 256.2 | 233.1 | 477 | 2231 |
| 2011 | 713.3 | 13299.8 | 5.36 | 292.2 | 271.6 | 242.3 | 497.6 | 2287 |
| 2012 | 762.1 | 13905.7 | 5.48 | 312.2 | 283.9 | 253.4 | 515.4 | 2425 |
| 2013 | 799 | 14063.3 | 5.68 | 327.3 | 287.2 | 260.3 | 532.2 | 2523 |
| 2014 | 834.6 | 14778.2 | 5.65 | 341.9 | 301.8 | 273.6 | 557.4 | 2614 |
| 2015 | 871.8 | 15467.1 | 5.64 | 357.1 | 315.8 | 287.6 | 589.9 | 2709 |
| 2016 | 896.5 | 15884.7 | 5.64 | 367.2 | 324.4 | 296.2 | 615.1 | 2764 |
| 2017 | 926.1 | 16659 | 5.56 | 379.3 | 340.2 | 310.3 | 642.7 | 2835 |
| 2018 | 972.4 | 17514.4 | 5.55 | 398.3 | 357.6 | 325.6 | 681.5 | 2960 |
| 2019 | 1030.7 | 18349.6 | 5.62 | 422.2 | 374.7 | 341.2 | 734.4 | 3121 |
| 2020 | 1077.9 | 19613.1 | 5.5 | 441.5 | 400.5 | 346.1 | 768.7 | 3251 |
| 2021 | 1114.6 | 21492.8 | 5.19 | 456.6 | 438.9 | 377.4 | 824.4 | 3356 |
| 2022 | 1211.5 | 22149.3 | 5.47 | 496.2 | 452.3 | 407.2 | 876.8 | 3627 |
| 2023 | 1357 | 23637.1 | 5.74 | 555.8 | 482.7 | 429.7 | 953.1 | 4030 |
| 2024 | 1448 | 25035.8 | 5.78 | 593.1 | 511.2 | 454.4 | 1031.4 | 4259 |
| 2025 | 1570 | 26327 | 5.96 | 643.1 | 537.6 | 475.1 | 1114.5 | 4593 |
Social Security’s share of personal income

View exact chart values
| year | ss_billions | pi_billions | ss_share_pct | index_ss | index_pi | index_wages | index_medicare | ss_per_capita |
|---|---|---|---|---|---|---|---|---|
| 1990 | 244.1 | 4897.3 | 4.99 | 100 | 100 | 100 | 100 | 978 |
| 1991 | 264.2 | 5072.3 | 5.21 | 108.2 | 103.6 | 102.6 | 109.2 | 1044 |
| 1992 | 281.8 | 5406.5 | 5.21 | 115.4 | 110.4 | 108.3 | 123.2 | 1098 |
| 1993 | 297.9 | 5643.6 | 5.28 | 122 | 115.2 | 112.6 | 136.4 | 1146 |
| 1994 | 312.2 | 5933.9 | 5.26 | 127.9 | 121.2 | 118.4 | 152.8 | 1186 |
| 1995 | 327.7 | 6278.1 | 5.22 | 134.2 | 128.2 | 125.1 | 168.4 | 1231 |
| 1996 | 342 | 6660.9 | 5.13 | 140.1 | 136 | 132.3 | 181 | 1270 |
| 1997 | 356.6 | 7068.4 | 5.04 | 146.1 | 144.3 | 141.9 | 192.2 | 1308 |
| 1998 | 369.2 | 7584 | 4.87 | 151.2 | 154.9 | 153 | 191 | 1338 |
| 1999 | 379.9 | 7978.4 | 4.76 | 155.6 | 162.9 | 163.3 | 193.9 | 1361 |
| 2000 | 401.4 | 8620.2 | 4.66 | 164.4 | 176 | 176.7 | 203.6 | 1423 |
| 2001 | 425.1 | 8990.1 | 4.73 | 174.1 | 183.6 | 181.3 | 225.4 | 1492 |
| 2002 | 446.9 | 9146.7 | 4.89 | 183.1 | 186.8 | 182.9 | 241.3 | 1554 |
| 2003 | 463.5 | 9474.7 | 4.89 | 189.9 | 193.5 | 188.1 | 257.1 | 1598 |
| 2004 | 485.5 | 10008.9 | 4.85 | 198.9 | 204.4 | 198.4 | 282.8 | 1658 |
| 2005 | 512.7 | 10540.8 | 4.86 | 210 | 215.2 | 208.4 | 308.6 | 1735 |
| 2006 | 544.1 | 11291.4 | 4.82 | 222.9 | 230.6 | 221.7 | 370.8 | 1824 |
| 2007 | 575.7 | 11925 | 4.83 | 235.8 | 243.5 | 234.2 | 397.8 | 1911 |
| 2008 | 605.5 | 12423.4 | 4.87 | 248 | 253.7 | 239.2 | 428.9 | 1991 |
| 2009 | 664.5 | 12058.3 | 5.51 | 272.2 | 246.2 | 228.6 | 458 | 2166 |
| 2010 | 690.2 | 12547.5 | 5.5 | 282.7 | 256.2 | 233.1 | 477 | 2231 |
| 2011 | 713.3 | 13299.8 | 5.36 | 292.2 | 271.6 | 242.3 | 497.6 | 2287 |
| 2012 | 762.1 | 13905.7 | 5.48 | 312.2 | 283.9 | 253.4 | 515.4 | 2425 |
| 2013 | 799 | 14063.3 | 5.68 | 327.3 | 287.2 | 260.3 | 532.2 | 2523 |
| 2014 | 834.6 | 14778.2 | 5.65 | 341.9 | 301.8 | 273.6 | 557.4 | 2614 |
| 2015 | 871.8 | 15467.1 | 5.64 | 357.1 | 315.8 | 287.6 | 589.9 | 2709 |
| 2016 | 896.5 | 15884.7 | 5.64 | 367.2 | 324.4 | 296.2 | 615.1 | 2764 |
| 2017 | 926.1 | 16659 | 5.56 | 379.3 | 340.2 | 310.3 | 642.7 | 2835 |
| 2018 | 972.4 | 17514.4 | 5.55 | 398.3 | 357.6 | 325.6 | 681.5 | 2960 |
| 2019 | 1030.7 | 18349.6 | 5.62 | 422.2 | 374.7 | 341.2 | 734.4 | 3121 |
| 2020 | 1077.9 | 19613.1 | 5.5 | 441.5 | 400.5 | 346.1 | 768.7 | 3251 |
| 2021 | 1114.6 | 21492.8 | 5.19 | 456.6 | 438.9 | 377.4 | 824.4 | 3356 |
| 2022 | 1211.5 | 22149.3 | 5.47 | 496.2 | 452.3 | 407.2 | 876.8 | 3627 |
| 2023 | 1357 | 23637.1 | 5.74 | 555.8 | 482.7 | 429.7 | 953.1 | 4030 |
| 2024 | 1448 | 25035.8 | 5.78 | 593.1 | 511.2 | 454.4 | 1031.4 | 4259 |
| 2025 | 1570 | 26327 | 5.96 | 643.1 | 537.6 | 475.1 | 1114.5 | 4593 |
West Virginia's tenth, California's twenty-fifth
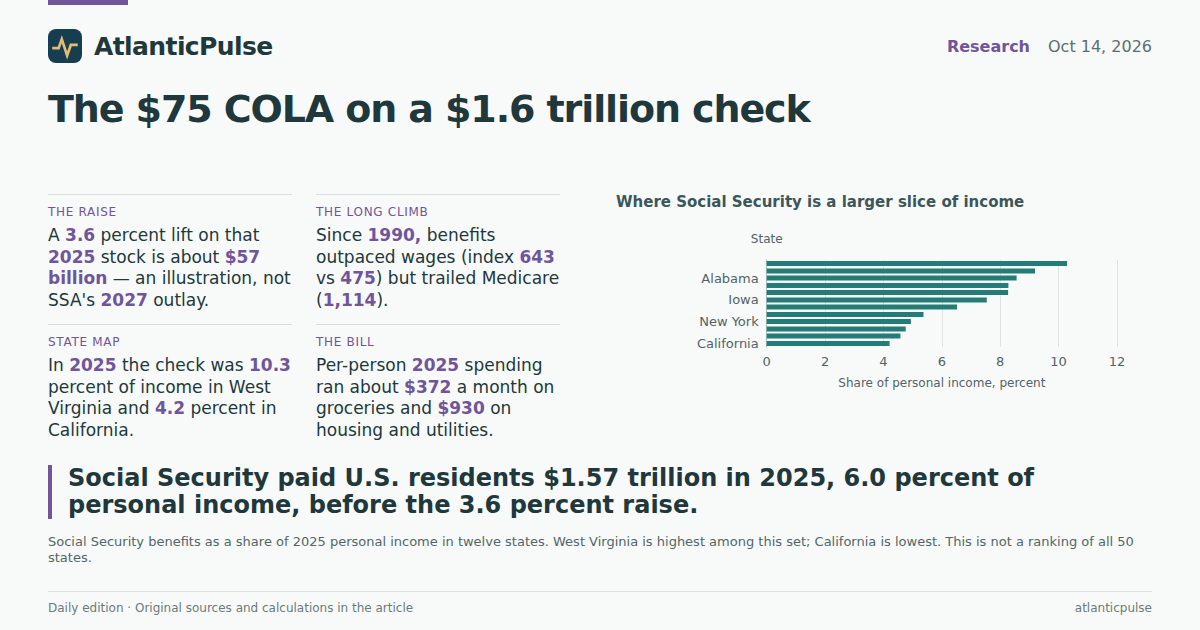
The national 6 percent average hides a map. In 2025, Social Security benefits were 10.3 percent of personal income in West Virginia and 9.2 percent in Mississippi. Maine, Alabama, Michigan and Iowa all sat between 7.5 and 8.6 percent. Florida, the retirement magnet, was 6.5 percent — high for a big state, still below the Appalachian and Deep South examples. California was 4.2 percent. Alaska, which hosted a presidential energy rally this week, was 4.6 percent. Texas was 4.8 percent. New York was 4.9 percent. Maryland, a high-income East Coast payroll, was 5.4 percent.
These twelve states are a sample, not a census of all fifty. They are enough to make the political point without pretending BEA has ranked every legislature. A 3.6 percent raise is the same formula in Charleston and in San Jose. It is a larger share of local income where paychecks are thinner and the beneficiary rolls are thicker. That is not a finding about who "deserves" the COLA. It is a finding about where the check already is the economy.
Where Social Security is a larger slice of income

View exact chart values
| state | ss_billions | pi_billions | ss_share_pct |
|---|---|---|---|
| California | 150.84 | 3579.7 | 4.21 |
| Alaska | 2.72 | 59.4 | 4.58 |
| Texas | 110.34 | 2319.8 | 4.76 |
| New York | 90.42 | 1830.3 | 4.94 |
| Maryland | 27.73 | 516.2 | 5.37 |
| Florida | 119.8 | 1838.2 | 6.52 |
| Iowa | 16.45 | 218 | 7.54 |
| Michigan | 56.32 | 681.1 | 8.27 |
| Maine | 8.4 | 101.5 | 8.28 |
| Alabama | 26.57 | 310.3 | 8.56 |
| Mississippi | 14.79 | 160.8 | 9.19 |
| West Virginia | 10.58 | 102.8 | 10.29 |
What $75 actually sits next to
The $75 figure is a monthly raise for a beneficiary. The household bill is not. In 2025, BEA per-person spending — everyone, not just retirees — was $4,459 a year on food and beverages bought for home, $10,442 on health care, and $11,159 on housing and utilities. Converted to a monthly rate that is about $372, $870 and $930. Housing here includes the imputed rent on owner-occupied homes, so it is larger than a renter's check to a landlord. Health care is outpatient, hospital and nursing-home services, not premiums alone. Groceries are off-premises food and drinks, including alcohol.
Put $75 on that page and it covers a fifth of the average person's grocery month and a small slice of housing or medical care. It is not nothing. It is also not a housing policy. The BEA per-resident Social Security flow, $383 a month, looks similar to the grocery line only because it is diluted across the whole population. Beneficiaries receive more; children receive none. SSA's own $75 is a percentage of the check people already get, which for a typical retired worker is a few thousand dollars a month, not $383.
None of this is 2026 inflation, and none of it is a forecast of 2027 prices. The personal-income and PCE tables run through calendar 2025. The quarterly benefit run-rate runs through mid-2026. The COLA was announced for January 2027. The honest comparison is last year's books against this week's promise, with the usual warning that a cost-of-living formula tracks a price index, not any one household's rent, insulin or heating oil.
A $75 raise next to the monthly household bill

View exact chart values
| item | monthly_dollars |
|---|---|
| Announced COLA ($75 a month) | 75 |
| U.S. per-person groceries (PCE, monthly) | 372 |
| U.S. per-person health care (PCE, monthly) | 870 |
| U.S. per-person housing and utilities (PCE, monthly) | 930 |
| BEA Social Security per resident (monthly) | 383 |
Sources and methods
BEA annual SAINC tables (release bea-regional-state-annual-2026-09-30) supply calendar-year Social Security benefits, Medicare benefits, SSI, personal income, wages and salaries, population and contributions for government social insurance through 2025. Social Security and Medicare/SSI are in thousands of dollars; personal income, wages and contributions are in millions. Shares convert both to dollars before dividing. Per-resident Social Security divides benefits by BEA resident population, not by the number of beneficiaries.
Quarterly SQINC Social Security benefits are seasonally adjusted annual rates, not realized quarterly totals, through 2026 Q2 (release bea-regional-state-quarterly-2026-09-30). They are not the 2027 COLA.
BEA PCE by state (release bea-sapce-2026-09-30) supplies per-person spending on housing and utilities, health care, and food and beverages purchased for off-premises consumption through 2025. Housing includes imputed rent on owner-occupied dwellings. Monthly rates divide annual per-person totals by 12. These are population-wide averages, not retiree budgets.
The 3.6 percent and $75 figures, and the 73 million beneficiary count, come from today's Social Security Administration announcement as reported in the digest, not from BEA. Applying 3.6 percent to the 2025 BEA benefit stock is an arithmetic illustration, not SSA's 2027 outlay. Multiplying $75 by 73 million people for twelve months uses the news beneficiary count, which also covers SSI, and is not a BEA series.
State comparisons use 2025 observations for twelve states chosen to span high- and low-income places and states in today's news. They are not a ranking of all fifty states. No causal claim is made about the COLA, inflation or election outcomes. Snapshot vintage is October 2026; 2025 annual values are not current-day observations.
Research completed 2026-10-15, for the October 14, 2026 news edition. The available source data may cover earlier periods; see the observation periods and source vintages above.